Home > Comparison > Technology > TER vs NVEC
The strategic rivalry between Teradyne, Inc. and NVE Corporation shapes the semiconductor sector’s innovation landscape. Teradyne operates as a capital-intensive leader in automatic test equipment and industrial automation, while NVE specializes in niche spintronic sensors with a focus on factory automation. This analysis contrasts their growth trajectories and technological moats to identify which stock offers superior risk-adjusted returns for a diversified portfolio in 2026.
Table of contents
Companies Overview
Teradyne and NVE Corporation occupy pivotal roles in the semiconductor industry, each commanding unique technological niches.
Teradyne, Inc.: Global Leader in Automated Test Equipment
Teradyne dominates the semiconductor test equipment market with products spanning wafer testing to wireless device validation. Its core revenue stems from selling automated test systems to integrated device manufacturers, foundries, and fabless companies. In 2026, Teradyne focuses strategically on expanding its industrial automation segment, developing advanced robotics and software for manufacturing and logistics.
NVE Corporation: Pioneer in Spintronic Sensor Technology
NVE Corporation specializes in spintronic sensors and couplers, leveraging electron spin for data acquisition and transmission. Its revenue primarily arises from selling sensors for factory automation and medical devices, alongside industrial IoT applications. In 2026, NVE prioritizes research and development in spintronic memory and sensor licensing, aiming to deepen its foothold in niche, high-tech semiconductor applications.
Strategic Collision: Similarities & Divergences
Teradyne pursues a broad, scale-driven approach with integrated automated testing and industrial robotics, while NVE embraces a focused, innovation-led strategy in spintronics. Their primary market battleground lies in industrial automation and sensor technologies, where precision and innovation dictate success. Teradyne offers a diversified, large-cap profile with volume-driven growth; NVE presents a specialized, small-cap play emphasizing cutting-edge nanotech advancements.
Income Statement Comparison
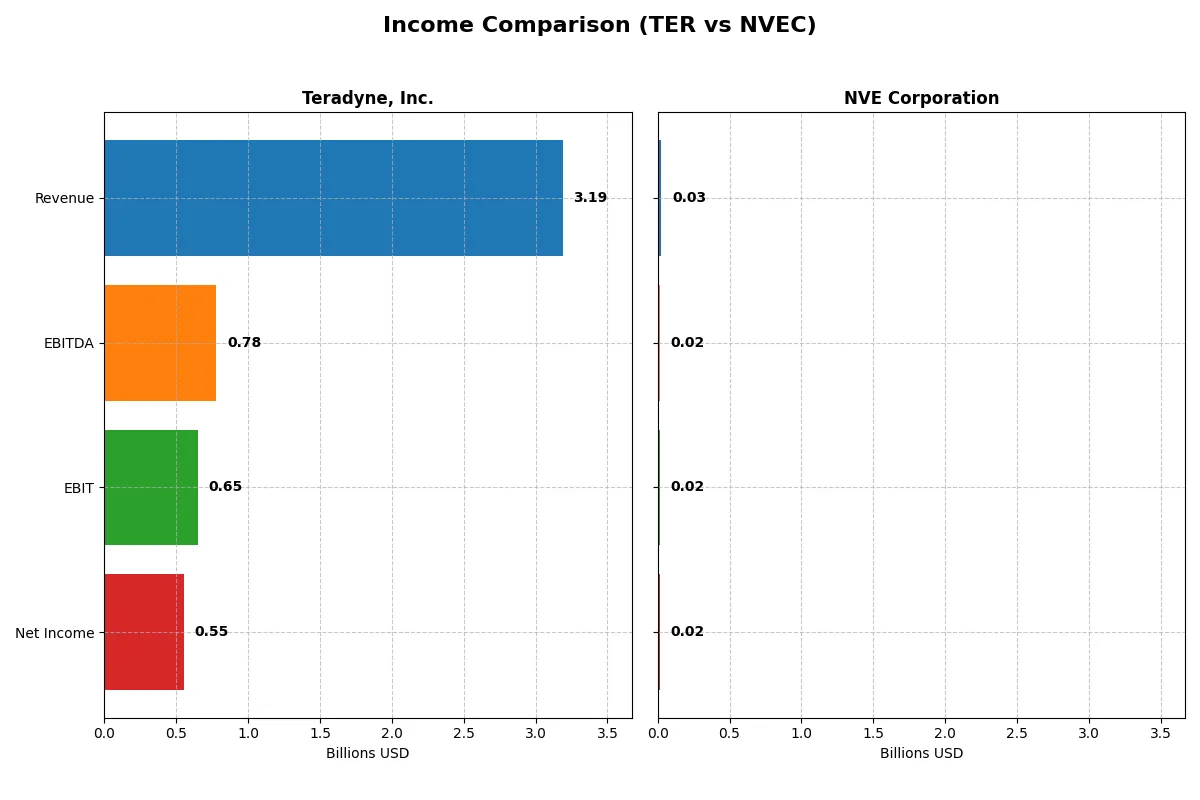
This data dissects the core profitability and scalability of both corporate engines to reveal who dominates the bottom line:
| Metric | Teradyne, Inc. (TER) | NVE Corporation (NVEC) |
|---|---|---|
| Revenue | 3.19B | 25.9M |
| Cost of Revenue | 1.32B | 4.24M |
| Operating Expenses | 1.17B | 5.64M |
| Gross Profit | 1.87B | 21.6M |
| EBITDA | 780M | 16.3M |
| EBIT | 653M | 16.0M |
| Interest Expense | 8.02M | 0 |
| Net Income | 554M | 15.1M |
| EPS | 3.49 | 3.12 |
| Fiscal Year | 2025 | 2025 |
Income Statement Analysis: The Bottom-Line Duel
This income statement comparison reveals which company runs a more efficient and profitable business engine in 2025.
Teradyne, Inc. Analysis
Teradyne’s revenue rose 13% from 2024, reaching 3.19B, with net income also increasing to 554M. The company maintains solid gross and net margins at 58.6% and 17.4%, showing robust operational efficiency. Despite a slight net margin decline year-over-year, its EPS grew nearly 5%, reflecting steady momentum and cost discipline.
NVE Corporation Analysis
NVE’s 2025 revenue slipped 13% to 26M, with net income down 12% to 15M. However, it boasts superior margin strength, with gross and net margins at 83.6% and 58.2%, respectively, underscoring exceptional profitability. The slight net margin improvement signals resilience despite top-line pressure, although EPS contracted, indicating some earnings volatility.
Margin Prowess vs. Revenue Momentum
Teradyne delivers stronger revenue growth and rising EPS, but with moderate margins typical of its sector. NVE outperforms in profitability metrics, sustaining high margins despite revenue declines. Fundamentally, Teradyne leads in scale and growth, while NVE excels in margin quality. Investors seeking growth might favor Teradyne’s momentum; those prioritizing profitability should consider NVE’s margin profile.
Financial Ratios Comparison
These vital ratios act as a diagnostic tool to expose underlying fiscal health, valuation premiums, and capital efficiency for the companies compared below:
| Ratios | Teradyne, Inc. (TER) | NVE Corporation (NVEC) |
|---|---|---|
| ROE | 19.2% (2024) | 24.2% (2025) |
| ROIC | 17.2% (2024) | 21.1% (2025) |
| P/E | 36.9x (2024) | 20.5x (2025) |
| P/B | 7.1x (2024) | 4.9x (2025) |
| Current Ratio | 2.91 (2024) | 28.4 (2025) |
| Quick Ratio | 1.84 (2024) | 22.0 (2025) |
| D/E | 0.05 (2024) | 0.01 (2025) |
| Debt-to-Assets | 3.6% (2024) | 1.4% (2025) |
| Interest Coverage | 166x (2024) | N/A |
| Asset Turnover | 0.76 (2024) | 0.40 (2025) |
| Fixed Asset Turnover | 4.88 (2024) | 8.91 (2025) |
| Payout Ratio | 14.1% (2024) | 128.4% (2025) |
| Dividend Yield | 0.38% (2024) | 6.28% (2025) |
| Fiscal Year | 2024 | 2025 |
Efficiency & Valuation Duel: The Vital Signs
Ratios act as the company’s DNA, unveiling hidden operational strengths and risks critical for informed investment decisions.
Teradyne, Inc.
Teradyne shows a moderate net margin of 17.37%, but zero reported ROE and ROIC signal limited profitability insight. Its P/E of 54.64 suggests an expensive valuation, stretching shareholder value. Dividend yield is minimal at 0.25%, implying limited income return and possibly reinvestment into R&D or growth initiatives.
NVE Corporation
NVE boasts a robust 58.22% net margin with a strong 24.19% ROE and 21.14% ROIC, indicating efficient capital use. Its P/E of 20.46 looks fairly valued compared to peers. NVE offers a 6.28% dividend yield, balancing income with solid operational returns and a favorable capital structure.
Premium Valuation vs. Operational Safety
NVE’s superior profitability and reasonable valuation offer a stronger risk-reward profile than Teradyne’s stretched P/E and unclear returns. Investors seeking operational efficiency and income may favor NVE, while those accepting premium valuation face greater uncertainty with Teradyne.
Which one offers the Superior Shareholder Reward?
I compare Teradyne, Inc. (TER) and NVE Corporation (NVEC) on dividend yield, payout ratio, and buyback intensity. TER yields 0.25% with a modest 14% payout ratio, sustaining dividends through solid free cash flow (3B+). NVEC boasts a 6.3% yield but payout ratio exceeds 100%, signaling risk despite strong cash flow. TER’s buybacks appear conservative but steady, NVEC’s aggressive dividends may strain capital. Long-term, TER’s balanced distribution and cash flow coverage offer superior sustainability and total return potential in 2026. I favor TER for prudent shareholder reward.
Comparative Score Analysis: The Strategic Profile
The radar chart reveals the fundamental DNA and trade-offs of Teradyne, Inc. and NVE Corporation, highlighting their financial strengths and valuation profiles:
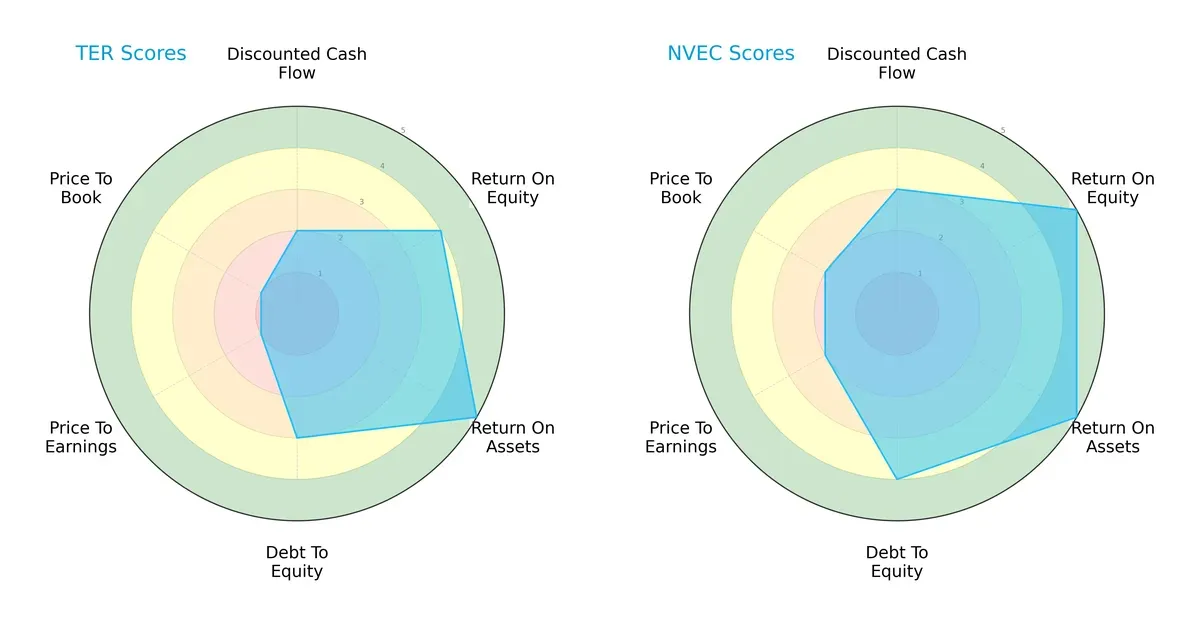
NVE Corporation shows a more balanced profile with strong scores in ROE, ROA, and debt-to-equity, indicating efficient capital use and lower financial risk. Teradyne relies more heavily on asset efficiency but suffers from very unfavorable valuation metrics, signaling potential overvaluation or market skepticism.
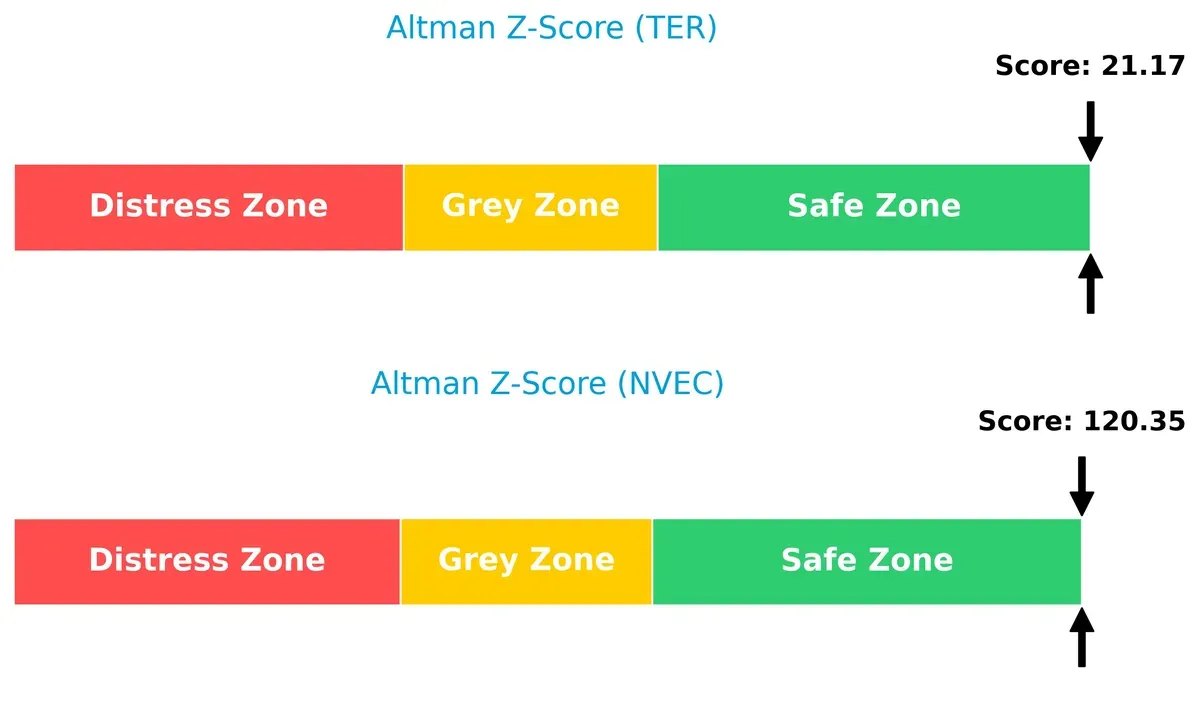
Bankruptcy Risk: Solvency Showdown
NVE’s Altman Z-Score far exceeds Teradyne’s, signaling superior long-term solvency and financial resilience in today’s market cycle:
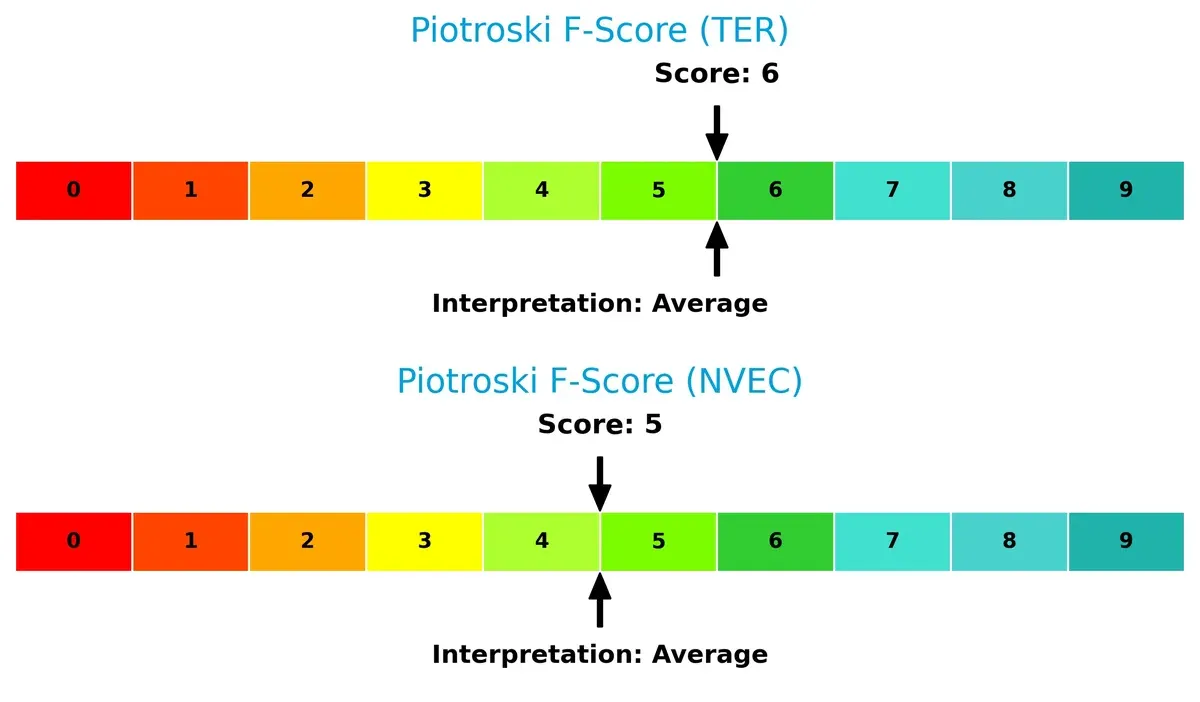
Financial Health: Quality of Operations
Both companies post average Piotroski F-Scores, but Teradyne’s slightly higher score suggests marginally stronger internal financial health, though neither is in peak condition:
How are the two companies positioned?
This section dissects the operational DNA of TER and NVEC by comparing their revenue distribution by segment and internal dynamics. The goal is to confront their economic moats to identify which model offers the most resilient, sustainable competitive advantage today.
Revenue Segmentation: The Strategic Mix
This visual comparison dissects how Teradyne, Inc. and NVE Corporation diversify their income streams and where their primary sector bets lie:
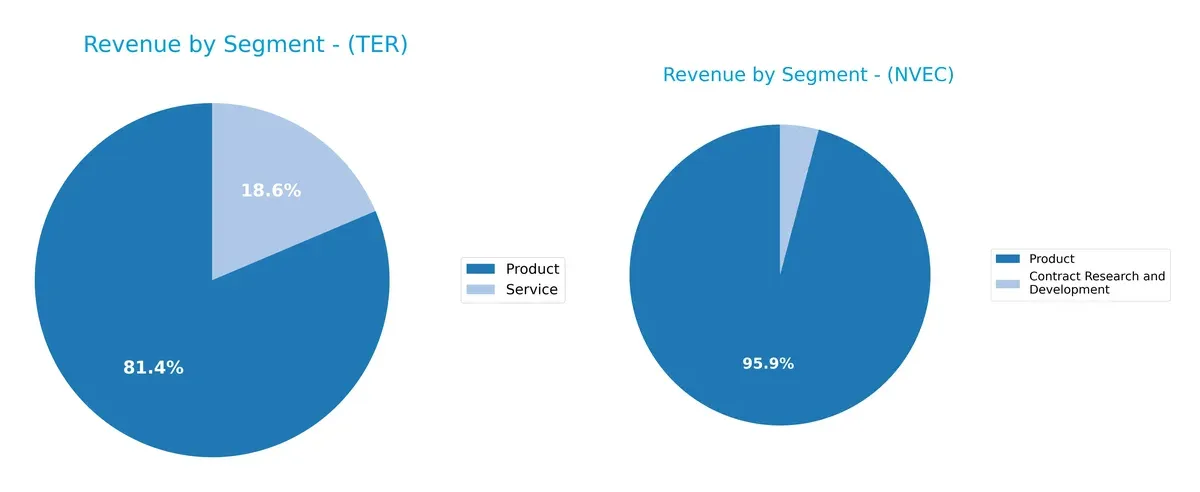
Teradyne anchors its revenue in Products, generating $2.29B in 2024, with Services contributing $525M, showing moderate diversification. NVE Corporation pivots almost entirely on Product sales at $25.9M in 2022, with minimal Contract Research and Development revenue near $1.1M. Teradyne’s broader base reduces concentration risk and supports ecosystem lock-in, while NVE’s reliance on a single segment heightens vulnerability to market swings.
Strengths and Weaknesses Comparison
This table compares the Strengths and Weaknesses of Teradyne, Inc. and NVE Corporation:
TER Strengths
- Diversified revenue with products and services
- Significant global sales across Asia and Americas
- Favorable net margin at 17.37%
- Strong interest coverage ratio at 81.43
- Low debt-to-assets ratio and debt-to-equity favorable
NVEC Strengths
- High profitability with 58.22% net margin
- Strong ROE at 24.19% and ROIC at 21.14%
- Favorable quick ratio and low debt levels
- High fixed asset turnover at 8.91
- Solid global presence including US, Europe, Asia Pacific
TER Weaknesses
- Unfavorable ROE and ROIC at 0%
- Unfavorable liquidity ratios (current and quick)
- High P/E ratio at 54.64
- Poor asset turnover and fixed asset turnover
- Low dividend yield at 0.25%
NVEC Weaknesses
- Unfavorable current ratio at 28.4
- Unfavorable price-to-book at 4.95
- Moderate P/E ratio at 20.46
- Asset turnover considered low at 0.4
- Dividend yield neutral at 6.28%
Teradyne shows strengths in diversified revenue and strong coverage but suffers from profitability and efficiency issues. NVE excels in profitability and asset efficiency but faces liquidity and valuation concerns. Each company’s profile suggests different strategic priorities ahead.
The Moat Duel: Analyzing Competitive Defensibility
A structural moat shields long-term profits from competitive erosion. It defines sustainable advantage and drives enduring value creation:
Teradyne, Inc.: Diversified Industrial Automation Moat
Teradyne’s moat stems from intangible assets and system integration, supporting stable 20% EBIT margins. However, declining ROIC signals rising pressure. New automation tech in 2026 could either deepen or challenge this position.
NVE Corporation: Niche Spintronics Innovation Moat
NVE’s moat relies on proprietary spintronic technology, delivering exceptional 58% net margins and robust ROIC growth. Unlike Teradyne, NVE’s focused innovation fuels stronger value creation and expansion potential in IoT and medical sectors.
Innovation Focus vs. Diversification Strength
NVE holds the deeper moat with growing ROIC and superior margin sustainability. Teradyne’s broader portfolio faces margin pressure and ROIC decline, making NVE better poised to defend and expand its market share.
Which stock offers better returns?
Over the past 12 months, Teradyne, Inc. surged over 160%, showing strong acceleration and wide price swings. In contrast, NVE Corporation declined by 20%, despite recent mild upward momentum.
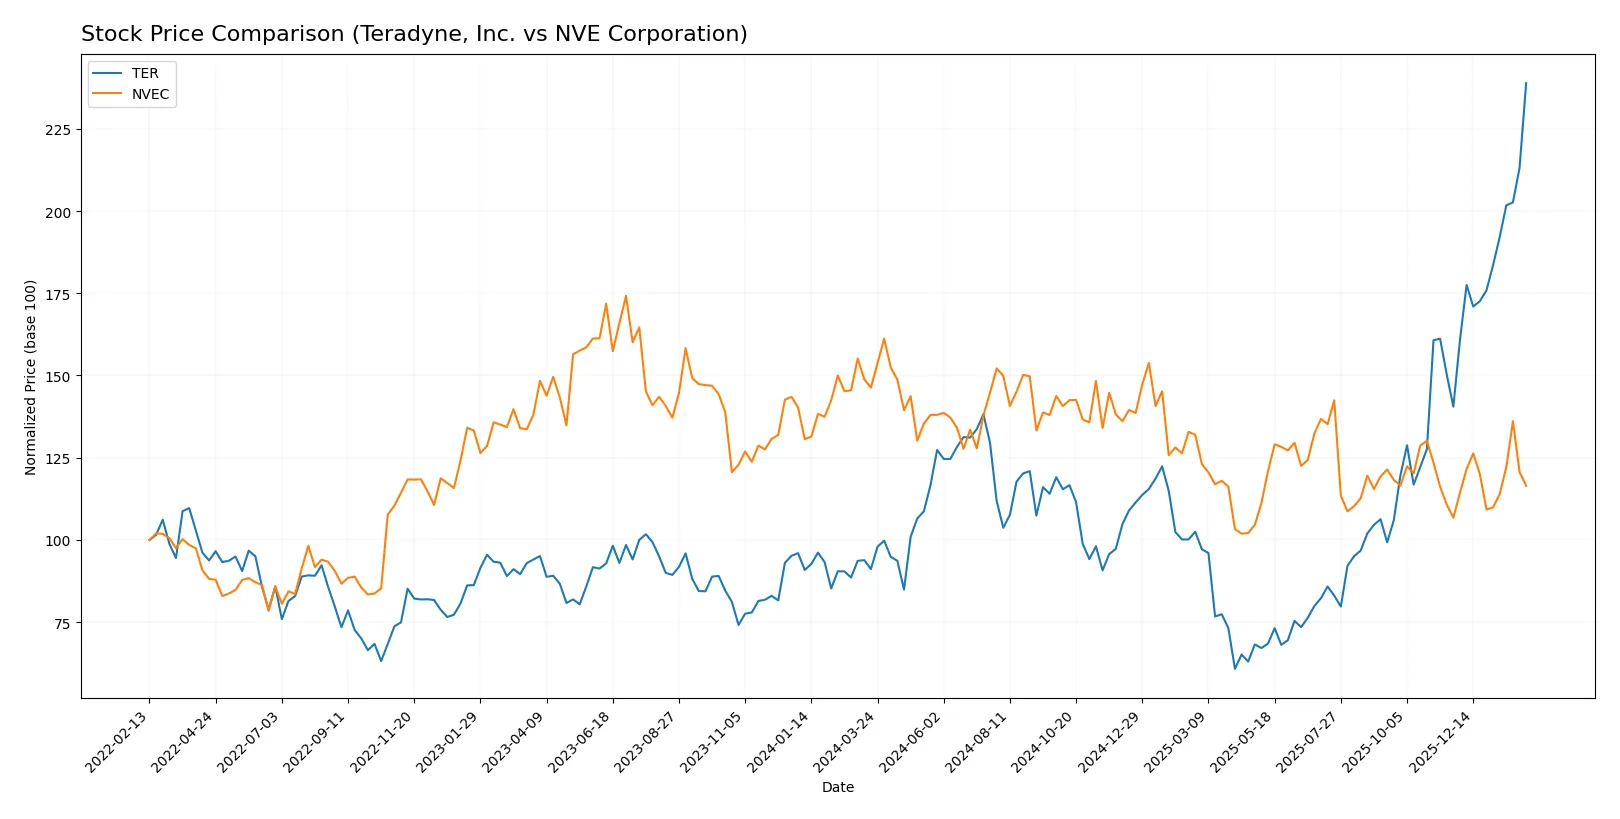
Trend Comparison
Teradyne, Inc. shows a bullish trend with a 162.16% price increase over the past year, marked by accelerating gains and high volatility (std dev 39.24). It reached a peak of 270.18 and a low of 68.72.
NVE Corporation’s stock is bearish, falling 20.41% over the same period despite recent slight recovery (9.08%). Volatility is low (std dev 7.56), with a highest price of 90.18 and lowest of 56.99.
Teradyne’s stock outperformed NVE by a wide margin, delivering the highest market returns with stronger buyer dominance and accelerating upward momentum.
Target Prices
Teradyne, Inc. shows a confident target price consensus from analysts.
| Company | Target Low | Target High | Consensus |
|---|---|---|---|
| Teradyne, Inc. | 175 | 305 | 267.33 |
Analysts expect Teradyne’s stock to trade near $267, slightly below the current $272.28 price, indicating moderate upside potential.
No verified target price data is available for NVE Corporation.

Don’t Let Luck Decide Your Entry Point
Optimize your entry points with our advanced ProRealTime indicators. You’ll get efficient buy signals with precise price targets for maximum performance. Start outperforming now!
How do institutions grade them?
The following grades reflect recent institutional assessments of Teradyne, Inc. and NVE Corporation:
Teradyne, Inc. Grades
The table below summarizes recent grades issued by recognized financial institutions for Teradyne, Inc.:
| Grading Company | Action | New Grade | Date |
|---|---|---|---|
| Evercore ISI Group | Maintain | Outperform | 2026-02-03 |
| Cantor Fitzgerald | Maintain | Overweight | 2026-02-02 |
| Stifel | Maintain | Buy | 2026-01-30 |
| UBS | Maintain | Buy | 2026-01-26 |
| B of A Securities | Maintain | Buy | 2026-01-22 |
| Stifel | Maintain | Buy | 2026-01-14 |
| B of A Securities | Maintain | Buy | 2026-01-13 |
| Goldman Sachs | Upgrade | Buy | 2025-12-16 |
| Stifel | Upgrade | Buy | 2025-12-02 |
| Citigroup | Maintain | Buy | 2025-11-12 |
Which company has the best grades?
Teradyne, Inc. has consistently received strong buy and outperform ratings from multiple reputable institutions. NVE Corporation lacks any available grades. Investors typically view Teradyne’s positive grades as a signal of institutional confidence, potentially influencing demand and liquidity.
Risks specific to each company
The following categories identify the critical pressure points and systemic threats facing both firms in the 2026 market environment:
1. Market & Competition
Teradyne, Inc.
- Faces intense competition in semiconductor test equipment and automation, requiring constant innovation to maintain market share.
NVE Corporation
- Operates in niche spintronics segment, limiting competition but also market size and growth potential.
2. Capital Structure & Debt
Teradyne, Inc.
- Shows favorable debt ratios and strong interest coverage, indicating manageable leverage and financial stability.
NVE Corporation
- Maintains very low debt levels, providing strong balance sheet resilience and low financial risk.
3. Stock Volatility
Teradyne, Inc.
- High beta at 1.82 signals elevated stock price volatility, increasing investment risk during market downturns.
NVE Corporation
- Lower beta of 1.22 suggests more stable share price movements and reduced volatility exposure.
4. Regulatory & Legal
Teradyne, Inc.
- Operates globally in heavily regulated tech sectors, exposing it to compliance costs and potential litigation risks.
NVE Corporation
- Smaller scale and specialized products reduce exposure but may face regulatory scrutiny in medical device applications.
5. Supply Chain & Operations
Teradyne, Inc.
- Complex global supply chains subject to semiconductor cycle fluctuations and geopolitical disruptions.
NVE Corporation
- More focused manufacturing reduces complexity but dependence on niche suppliers could risk operational continuity.
6. ESG & Climate Transition
Teradyne, Inc.
- Larger footprint demands robust ESG compliance; transition risks from energy-intensive manufacturing.
NVE Corporation
- Smaller scale limits ESG impact but pressure to innovate sustainable materials and processes exists.
7. Geopolitical Exposure
Teradyne, Inc.
- Significant exposure to US-China trade tensions and semiconductor export controls.
NVE Corporation
- Limited global footprint reduces geopolitical risks, but niche market may face export restrictions.
Which company shows a better risk-adjusted profile?
NVE Corporation’s strongest risk factor is its extreme liquidity ratios, suggesting inefficient capital use despite balance sheet safety. Teradyne’s primary risk lies in its high stock volatility and valuation multiples, exposing investors to market swings and potential overvaluation. Overall, NVE demonstrates a better risk-adjusted profile due to its solid financial scores and lower volatility. The recent surge in Teradyne’s beta to 1.82 justifies caution for risk-averse investors.
Final Verdict: Which stock to choose?
Teradyne, Inc. (TER) excels as a cash-generating powerhouse with robust profitability and accelerating revenue growth. Its main point of vigilance is the declining return on invested capital, which suggests caution on capital efficiency. TER fits well in aggressive growth portfolios seeking exposure to semiconductor testing innovation.
NVE Corporation (NVEC) boasts a durable strategic moat with strong ROIC outpacing its cost of capital and a highly favorable margin profile. It offers better financial stability and a more conservative risk posture compared to TER. NVEC suits GARP investors who value sustainable profitability with moderate valuation discipline.
If you prioritize dynamic growth and are comfortable with operational and capital efficiency risks, TER outshines as a compelling choice due to its market momentum and profit expansion. However, if you seek better stability and a proven economic moat, NVEC offers superior risk-adjusted returns and consistent value creation. Both represent distinct investor archetypes under current market conditions.
Disclaimer: Investment carries a risk of loss of initial capital. The past performance is not a reliable indicator of future results. Be sure to understand risks before making an investment decision.
Go Further
I encourage you to read the complete analyses of Teradyne, Inc. and NVE Corporation to enhance your investment decisions: