Home > Comparison > Technology > TSM vs NVEC
The strategic rivalry between Taiwan Semiconductor Manufacturing Company Limited (TSM) and NVE Corporation (NVEC) shapes the semiconductor sector’s innovation frontier. TSM operates as a capital-intensive manufacturing powerhouse with expansive wafer fabrication capabilities. In contrast, NVEC specializes in niche spintronic sensor technology, targeting industrial and medical applications. This analysis evaluates their divergent operational models to identify which company offers superior risk-adjusted returns for a diversified portfolio in today’s evolving technology landscape.
Table of contents
Companies Overview
Taiwan Semiconductor Manufacturing Company Limited and NVE Corporation stand as pivotal players in the semiconductor industry.
Taiwan Semiconductor Manufacturing Company Limited: The Foundry Titan
Taiwan Semiconductor Manufacturing Company Limited dominates as a leading semiconductor foundry. It generates revenue by manufacturing and packaging integrated circuits for clients worldwide. In 2026, it focuses on expanding wafer fabrication capabilities and investing in advanced process technologies to maintain its cutting-edge competitive advantage in high-performance computing and mobile markets.
NVE Corporation: Spintronics Innovator
NVE Corporation specializes in spintronic devices that use electron spin for data acquisition and transmission. Its core revenue comes from sensors and couplers serving factory automation and medical device markets. The company’s 2026 strategy emphasizes developing custom sensors and licensing spintronic memory technology, targeting growth in the industrial Internet of Things sector.
Strategic Collision: Similarities & Divergences
TSMC pursues a broad foundry model, offering versatile semiconductor manufacturing, while NVE focuses on niche spintronic innovation. They mainly compete in the semiconductor space but serve different end markets—TSMC in high-volume chip fabrication, NVE in specialized sensor applications. Their distinct investment profiles reflect scale and scope contrasts, with TSMC leveraging global scale and NVE banking on technological specialization.
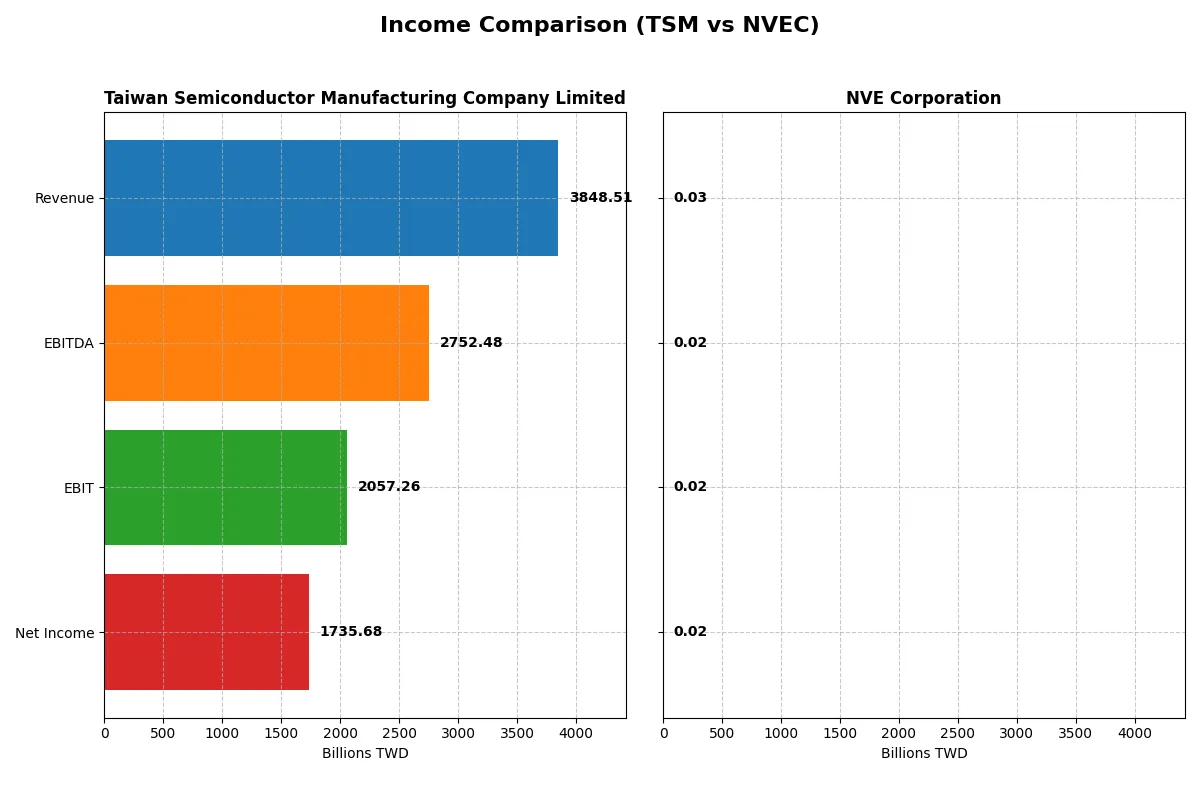
Income Statement Comparison
This data dissects the core profitability and scalability of both corporate engines to reveal who dominates the bottom line:
| Metric | Taiwan Semiconductor Manufacturing Company Limited (TSM) | NVE Corporation (NVEC) |
|---|---|---|
| Revenue | 3.85T TWD | 25.9M USD |
| Cost of Revenue | 1.54T TWD | 4.24M USD |
| Operating Expenses | 349.2B TWD | 5.64M USD |
| Gross Profit | 2.30T TWD | 21.6M USD |
| EBITDA | 2.75T TWD | 16.3M USD |
| EBIT | 2.06T TWD | 16.0M USD |
| Interest Expense | 0 | 0 |
| Net Income | 1.74T TWD | 15.1M USD |
| EPS | 334.6 TWD | 3.12 USD |
| Fiscal Year | 2025 | 2025 |
Income Statement Analysis: The Bottom-Line Duel
This income statement comparison exposes each company’s true operational efficiency and profitability momentum over recent years.
Taiwan Semiconductor Manufacturing Company Limited Analysis
TSM’s revenue soared from 1.59T TWD in 2021 to 3.85T TWD in 2025, reflecting robust growth. Net income nearly tripled to 1.74T TWD, driven by stellar gross margins near 60% and a net margin exceeding 45%. The 2025 figures highlight strong operational leverage, with EBIT margin climbing to 53.5%, signaling highly efficient cost management and scaling momentum.
NVE Corporation Analysis
NVEC’s revenue peaked at $38M in 2023 then slipped to $25.9M in 2025, marking a recent downturn. Despite this, the company maintains impressive margin health, boasting an 83.6% gross margin and a 58.2% net margin in 2025. EBIT margin remains solid at 61.8%. The latest year shows margin resilience but lacks revenue growth momentum, with a 13% decline signaling efficiency under pressure.
Margin Dominance vs. Growth Trajectory
TSM clearly outpaces NVEC in scale and growth, with revenue and net income surging over 140% and 190% respectively since 2021. NVEC excels in margin quality but faces a recent revenue contraction of 13%. For investors, TSM’s profile suits those prioritizing robust expansion and earnings leverage, while NVEC appeals to those valuing high margin stability amid slower top-line growth.
Financial Ratios Comparison
These vital ratios act as a diagnostic tool to expose the underlying fiscal health, valuation premiums, and capital efficiency of the companies compared below:
| Ratios | Taiwan Semiconductor Manufacturing Company Limited (TSM) | NVE Corporation (NVEC) |
|---|---|---|
| ROE | 32.1% | 24.2% |
| ROIC | 24.9% | 21.1% |
| P/E | 28.5 | 20.5 |
| P/B | 9.14 | 4.95 |
| Current Ratio | 2.62 | 28.4 |
| Quick Ratio | 2.42 | 22.0 |
| D/E | 0.18 | 0.015 |
| Debt-to-Assets | 12.5% | 1.4% |
| Interest Coverage | 0 | 0 |
| Asset Turnover | 0.49 | 0.40 |
| Fixed Asset Turnover | 1.05 | 8.91 |
| Payout ratio | 27.2% | 128.4% |
| Dividend yield | 0.95% | 6.28% |
| Fiscal Year | 2025 | 2025 |
Efficiency & Valuation Duel: The Vital Signs
Financial ratios act as the company’s DNA, revealing hidden risks and operational excellence that underpin investor confidence and valuation.
Taiwan Semiconductor Manufacturing Company Limited
TSM boasts a strong ROE of 32.12% and a robust net margin of 45.1%, signaling profitable operations and solid capital efficiency. However, its P/E ratio at 28.45 suggests the stock trades at a premium, potentially stretched versus peers. Dividend yield is modest at 0.95%, indicating a cautious shareholder return focus with some reinvestment.
NVE Corporation
NVEC delivers an impressive net margin of 58.22% and a respectable ROE of 24.19%, demonstrating efficient profitability. The P/E ratio of 20.46 reflects a more reasonable valuation relative to earnings. A high dividend yield of 6.28% signals strong shareholder returns alongside reinvestment in growth, balancing income and expansion.
Premium Valuation vs. Income Efficiency
Both firms show favorable financial health, but TSM’s premium valuation contrasts with NVEC’s attractive dividend yield and solid profitability. NVEC offers a better risk-reward balance for income-focused investors, while TSM suits those prioritizing growth at a higher price.
Which one offers the Superior Shareholder Reward?
I compare Taiwan Semiconductor Manufacturing Company Limited (TSM) and NVE Corporation (NVEC) by their dividend yields, payout ratios, and buybacks. TSM yields about 1.08% with a sustainable payout ratio near 31%, backed by strong free cash flow of 211B TWD. NVEC offers a higher yield around 6.3% but with payout ratios exceeding 100%, signaling potential dividend sustainability risks. Both firms engage in buybacks, but TSM’s buybacks are more consistent and supported by robust operating cash flow. TSM’s balanced distribution, combining dividends and buybacks, is more sustainable for long-term value. I see TSM offering a superior total return profile in 2026 due to prudent capital allocation and dividend sustainability.
Comparative Score Analysis: The Strategic Profile
The radar chart reveals the fundamental DNA and trade-offs of Taiwan Semiconductor Manufacturing Company Limited and NVE Corporation:
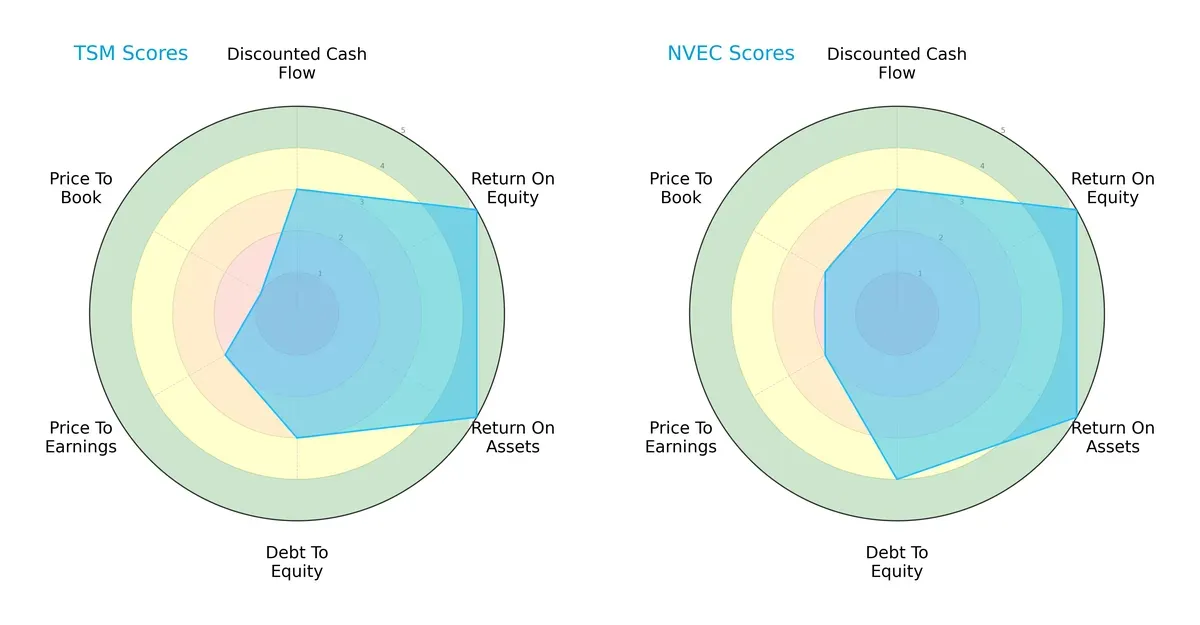
Taiwan Semiconductor shows a balanced strength in ROE and ROA with scores of 5 each, yet it lags in valuation metrics like price-to-book (1) and price-to-earnings (2). NVE Corporation matches TSM’s operational efficiency but achieves a better debt-to-equity score (4 vs. 3) and slightly superior overall score (4 vs. 3). NVE leans on stronger financial stability, while TSM depends on operational excellence despite valuation concerns.
Bankruptcy Risk: Solvency Showdown
The Altman Z-Scores illustrate both companies operate in the safe zone, but NVE’s exceptionally high score signals an even stronger solvency position than TSM:
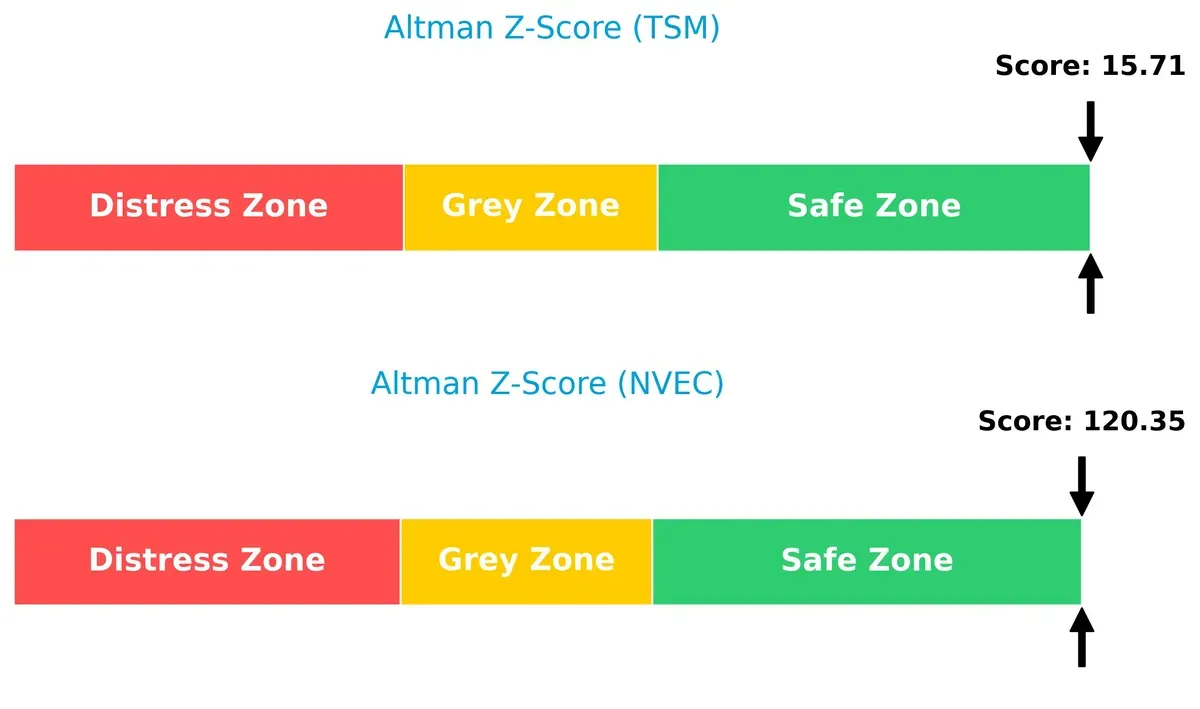
TSM’s Z-Score of 15.7 reflects robust financial health, yet NVE’s 120.4 is extraordinary, implying near-zero bankruptcy risk and exceptional resilience in this cycle.
Financial Health: Quality of Operations
Taiwan Semiconductor scores an 8 on the Piotroski F-Score, signaling very strong financial health, while NVE’s 5 marks an average position:
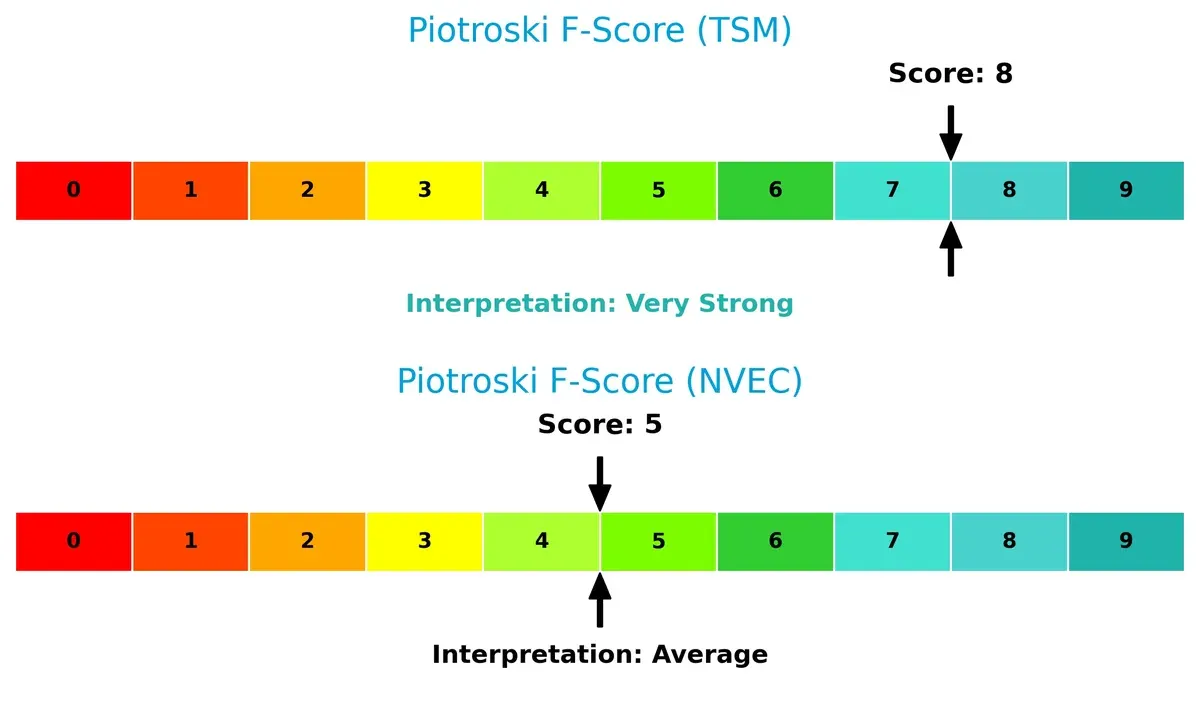
TSM’s high score reflects superior profitability, liquidity, and operational efficiency. NVE’s moderate score highlights potential red flags in internal metrics, suggesting TSM has a more reliable quality of earnings and balance sheet management.
How are the two companies positioned?
This section dissects TSM and NVEC’s operational DNA by comparing revenue distribution and internal dynamics—strengths and weaknesses. The goal is to confront their economic moats and identify the more resilient competitive advantage today.
Revenue Segmentation: The Strategic Mix
This comparison dissects how Taiwan Semiconductor Manufacturing Company Limited and NVE Corporation diversify income streams and where their primary sector bets lie:
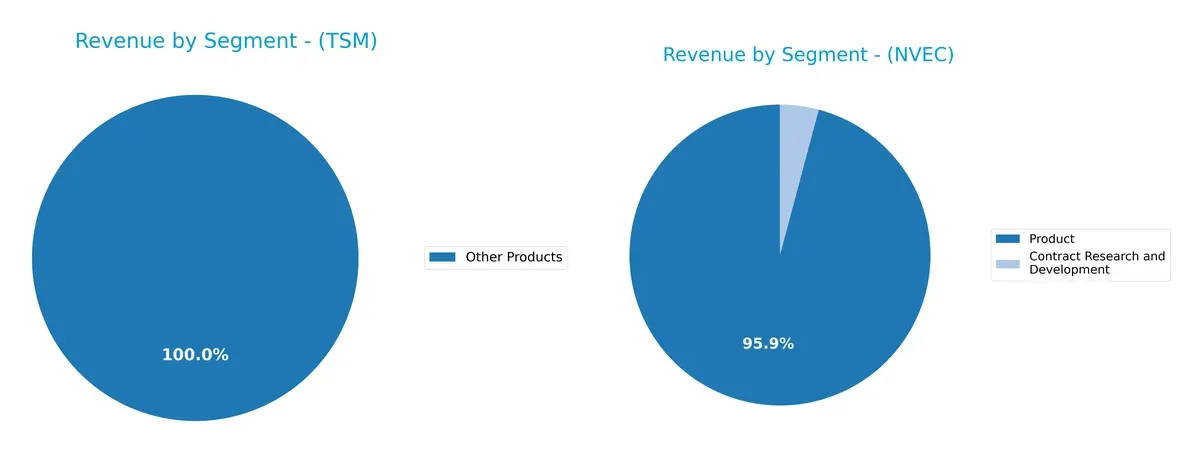
Taiwan Semiconductor relies heavily on its Wafer segment, generating about 1.99T TWD in 2022, which dwarfs its Other Products at 272B TWD. This concentration anchors TSMC’s dominance in semiconductor manufacturing but raises concentration risk. In contrast, NVE Corporation displays a more balanced mix with Product revenues around $25.9M and Contract Research and Development at roughly $1.1M, signaling a diversified approach that pivots between product sales and innovation-driven services.
Strengths and Weaknesses Comparison
This table compares the strengths and weaknesses of Taiwan Semiconductor Manufacturing Company Limited (TSM) and NVE Corporation (NVEC):
TSM Strengths
- Strong profitability with 45.1% net margin and 32.12% ROE
- Solid liquidity with current ratio 2.62 and quick ratio 2.42
- Low leverage with debt to assets 12.52% and interest coverage infinite
- Significant global revenue including US, China, and Japan markets
- Established wafer market with high revenue scale
- Favorable ROIC of 24.92% above WACC
NVEC Strengths
- Highest net margin at 58.22% among peers
- Excellent fixed asset turnover at 8.91 indicating efficient use
- Very low debt to assets at 1.43% and strong interest coverage
- Global exposure across US, Europe, and Asia Pacific
- Strong profitability with 24.19% ROE and 21.14% ROIC
- Favorable quick ratio and moderate P/E valuation
TSM Weaknesses
- High valuation multiples with P/E 28.45 and P/B 9.14 flagged unfavorable
- Moderate asset turnover at 0.49 below industry leaders
- Dividend yield low at 0.95% limiting income appeal
- Limited diversification outside wafer and other products segment
- Neutral fixed asset turnover at 1.05
- Exposure to geopolitical risks in China
NVEC Weaknesses
- Extremely high current ratio at 28.4 signals inefficient asset utilization
- P/B ratio unfavorable at 4.95
- Asset turnover low at 0.4 indicating room for operational improvement
- Dividend yield moderate at 6.28%, neutral status
- Smaller scale relative to TSM limits market share and diversification
Both companies show favorable overall financial health with strong profitability and low leverage. TSM’s global scale and liquidity stand out, while NVEC excels in asset efficiency and margin. Valuation and asset utilization present challenges. These factors shape their strategic focus on operational efficiency and market expansion.
The Moat Duel: Analyzing Competitive Defensibility
A structural moat is the sole barrier protecting long-term profits from relentless competitive erosion. Let’s dissect the competitive advantages of these two semiconductor players:
Taiwan Semiconductor Manufacturing Company Limited: Scale and Technological Leadership Moat
TSMC’s moat stems from its unmatched scale and advanced wafer fabrication technology. This translates into high ROIC and margin stability. Expansion into automotive and IoT markets in 2026 could deepen this advantage.
NVE Corporation: Niche Spintronics Innovation Moat
NVE’s moat lies in proprietary spintronic technology, a specialized niche contrasting TSMC’s broad scale. Despite smaller size, NVE sustains strong ROIC growth. Opportunities exist in industrial IoT and medical device applications in 2026.
Scale Dominance vs. Technological Niche Innovation
TSMC’s wider moat benefits from scale economies and diversified advanced manufacturing, while NVE’s deeper moat stems from unique technology with high profitability but narrower market reach. TSMC is better positioned to defend and expand its market share amid semiconductor industry cycles.
Which stock offers better returns?
The past year shows stark contrasts in price movements between Taiwan Semiconductor Manufacturing Company Limited and NVE Corporation, highlighting divergent market sentiment and momentum patterns.
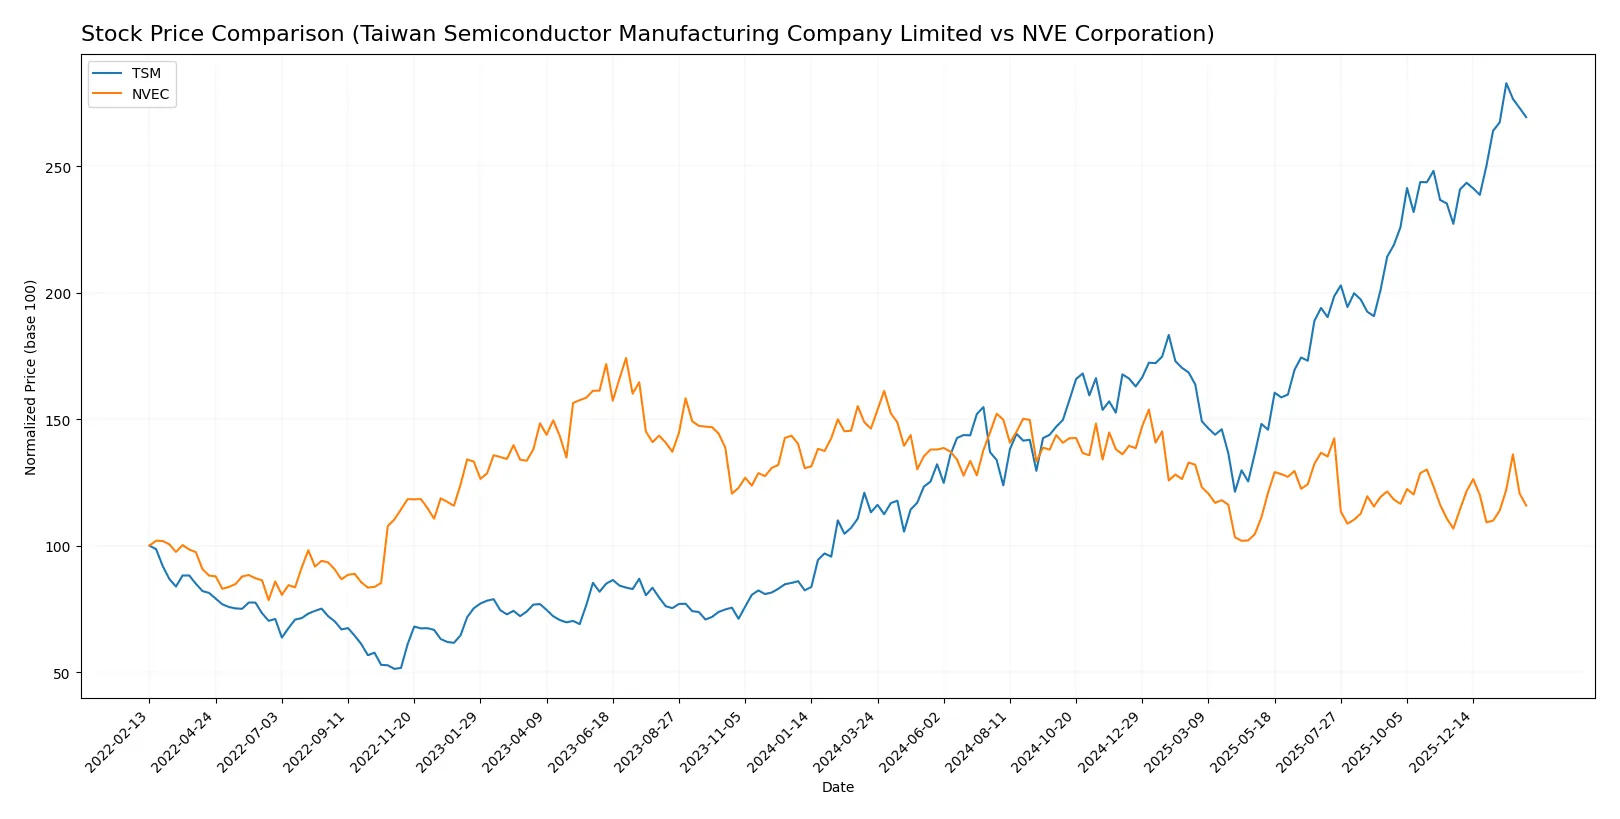
Trend Comparison
Taiwan Semiconductor Manufacturing Company Limited’s stock price surged 138.09% over the past 12 months, reflecting a strong bullish trend with accelerating gains and notable volatility (std dev 54.49). The price hit a high of 342.4 and a low of 127.7.
NVE Corporation’s stock declined 20.8% over the same period, marking a bearish trend despite acceleration. The stock showed lower volatility (std dev 7.57), with a high of 90.18 and a low of 56.99.
TSM delivered the highest market performance with a pronounced bullish trend, while NVEC’s bearish trend resulted in a significant negative return over the last year.
Target Prices
Taiwan Semiconductor Manufacturing Company Limited shows a solid target price consensus from reputable analysts.
| Company | Target Low | Target High | Consensus |
|---|---|---|---|
| Taiwan Semiconductor Manufacturing Company Limited | 330 | 450 | 397.5 |
The consensus target price of 397.5 implies a 22% upside from the current 325.69 stock price, signaling analyst confidence in TSM’s growth prospects. No verified target price data is available for NVE Corporation.

Don’t Let Luck Decide Your Entry Point
Optimize your entry points with our advanced ProRealTime indicators. You’ll get efficient buy signals with precise price targets for maximum performance. Start outperforming now!
How do institutions grade them?
The following presents the latest institutional grades for Taiwan Semiconductor Manufacturing Company Limited and NVE Corporation:
Taiwan Semiconductor Manufacturing Company Limited Grades
The table below summarizes recent grades assigned by reputable financial institutions:
| Grading Company | Action | New Grade | Date |
|---|---|---|---|
| TD Cowen | Maintain | Hold | 2026-01-16 |
| Barclays | Maintain | Overweight | 2026-01-16 |
| Needham | Maintain | Buy | 2026-01-15 |
| Bernstein | Maintain | Outperform | 2025-12-08 |
| Needham | Maintain | Buy | 2025-10-27 |
| Barclays | Maintain | Overweight | 2025-10-17 |
| Needham | Maintain | Buy | 2025-10-16 |
| Susquehanna | Maintain | Positive | 2025-10-10 |
| Barclays | Maintain | Overweight | 2025-10-09 |
| Barclays | Maintain | Overweight | 2025-09-16 |
Which company has the best grades?
Taiwan Semiconductor Manufacturing Company Limited holds multiple “Buy,” “Overweight,” and “Outperform” ratings, signaling strong institutional confidence. NVE Corporation lacks available grades, limiting direct comparison. Investors may view TSM’s consistent positive grades as a sign of greater analyst conviction and market interest.
Risks specific to each company
The following categories identify critical pressure points and systemic threats facing Taiwan Semiconductor Manufacturing Company Limited (TSM) and NVE Corporation (NVEC) in the 2026 market environment:
1. Market & Competition
Taiwan Semiconductor Manufacturing Company Limited (TSM)
- Faces intense global competition in advanced semiconductor manufacturing; maintains leadership through technology scale and innovation.
NVE Corporation (NVEC)
- Competes in niche spintronics market with limited scale; growth depends on market adoption and R&D success.
2. Capital Structure & Debt
Taiwan Semiconductor Manufacturing Company Limited (TSM)
- Maintains a low debt-to-equity ratio (0.18), indicating strong financial stability and prudent leverage.
NVE Corporation (NVEC)
- Extremely low debt (0.01 D/E), signaling minimal financial risk but possible underutilization of debt for growth.
3. Stock Volatility
Taiwan Semiconductor Manufacturing Company Limited (TSM)
- Beta at 1.272, implying above-market volatility typical for large-cap semiconductor stocks.
NVE Corporation (NVEC)
- Beta at 1.219, slightly less volatile but still sensitive to market swings given small cap size.
4. Regulatory & Legal
Taiwan Semiconductor Manufacturing Company Limited (TSM)
- Exposed to cross-border regulatory risks, especially U.S.-China tech tensions and export controls.
NVE Corporation (NVEC)
- Faces fewer global regulatory pressures but must comply with U.S. industry standards and IP protections.
5. Supply Chain & Operations
Taiwan Semiconductor Manufacturing Company Limited (TSM)
- Highly complex global supply chain vulnerable to geopolitical disruptions and component shortages.
NVE Corporation (NVEC)
- Smaller, more localized operations reduce supply chain complexity but limit scale advantages.
6. ESG & Climate Transition
Taiwan Semiconductor Manufacturing Company Limited (TSM)
- Increasing pressure to reduce environmental footprint and align with global climate policies.
NVE Corporation (NVEC)
- ESG efforts less scrutinized due to size but must prepare for growing investor demands.
7. Geopolitical Exposure
Taiwan Semiconductor Manufacturing Company Limited (TSM)
- Significant geopolitical risk from Taiwan-China tensions impacting operations and investor sentiment.
NVE Corporation (NVEC)
- Limited direct geopolitical exposure but reliant on global supply chains sensitive to international trade policy.
Which company shows a better risk-adjusted profile?
TSM’s principal risk lies in geopolitical tensions impacting its global supply chain and operations. NVEC’s largest risk is market concentration in a niche technology with uncertain adoption. Despite TSM’s scale and financial strength, NVEC’s minimal debt and lower geopolitical exposure give it a comparatively better risk-adjusted profile. Notably, NVEC’s extremely high current ratio signals liquidity excess, a red flag for capital efficiency. This contrast underscores NVEC’s cautious balance sheet versus TSM’s geopolitical vulnerability.
Final Verdict: Which stock to choose?
Taiwan Semiconductor Manufacturing Company Limited (TSM) wields unmatched capital efficiency, consistently delivering a return on invested capital well above its cost of capital. This economic moat fuels strong profitability and robust cash flow generation. A point of vigilance is its relatively high valuation multiples, which might temper near-term upside. TSM suits portfolios targeting steady, aggressive growth.
NVE Corporation (NVEC) boasts a strategic moat rooted in exceptional gross margins and free cash flow yield, reflecting operational excellence and pricing power. Its fortress-like balance sheet with minimal debt enhances its safety profile compared to TSM. NVEC fits well within GARP portfolios seeking quality growth with a safer risk profile.
If you prioritize sustained capital efficiency and high growth potential, TSM outshines as the compelling choice due to its powerful economic moat and accelerating bullish trend. However, if you seek income stability combined with margin resiliency and a conservative financial structure, NVEC offers better stability and a more defensive posture. Both companies create value but appeal to distinct investor avatars.
Disclaimer: Investment carries a risk of loss of initial capital. The past performance is not a reliable indicator of future results. Be sure to understand risks before making an investment decision.
Go Further
I encourage you to read the complete analyses of Taiwan Semiconductor Manufacturing Company Limited and NVE Corporation to enhance your investment decisions: