Home > Comparison > Technology > STM vs NVEC
The strategic rivalry between STMicroelectronics N.V. and NVE Corporation shapes the semiconductor sector’s innovation frontier. STMicroelectronics operates as a capital-intensive industrial powerhouse, delivering a broad product portfolio across automotive and industrial markets. In contrast, NVE Corporation focuses on niche spintronic sensor technology with a lean, specialized model. This analysis evaluates their divergent growth trajectories to identify which offers a superior risk-adjusted return for a diversified portfolio in today’s tech-driven landscape.
Table of contents
Companies Overview
STMicroelectronics N.V. and NVE Corporation stand as pivotal players in the semiconductor industry with distinct market scopes and technologies.
STMicroelectronics N.V.: Global Semiconductor Powerhouse
STMicroelectronics dominates as a broad semiconductor manufacturer serving automotive, industrial, and consumer electronics markets worldwide. Its revenue stems from diverse product groups—Automotive and Discrete, Analog, MEMS and Sensors, and Microcontrollers—highlighting a balanced portfolio. In 2026, the company’s strategic focus remains on innovation across integrated circuits and expanding connectivity solutions.
NVE Corporation: Spintronics Specialist
NVE Corporation is a niche player specializing in spintronic sensor technology for factory automation and medical devices. It generates revenue through custom sensors and couplers leveraging electron spin to improve data acquisition and transmission. In 2026, NVE’s strategy centers on advancing spintronic applications, including IoT and R&D licensing efforts.
Strategic Collision: Similarities & Divergences
STMicroelectronics pursues a diversified semiconductor platform, while NVE bets on proprietary spintronics innovation. Their primary battleground lies in sensor technologies, though ST’s scale contrasts with NVE’s specialized focus. Investors face a choice between broad market exposure and concentrated technological niche, reflecting distinct risk and growth profiles.
Income Statement Comparison
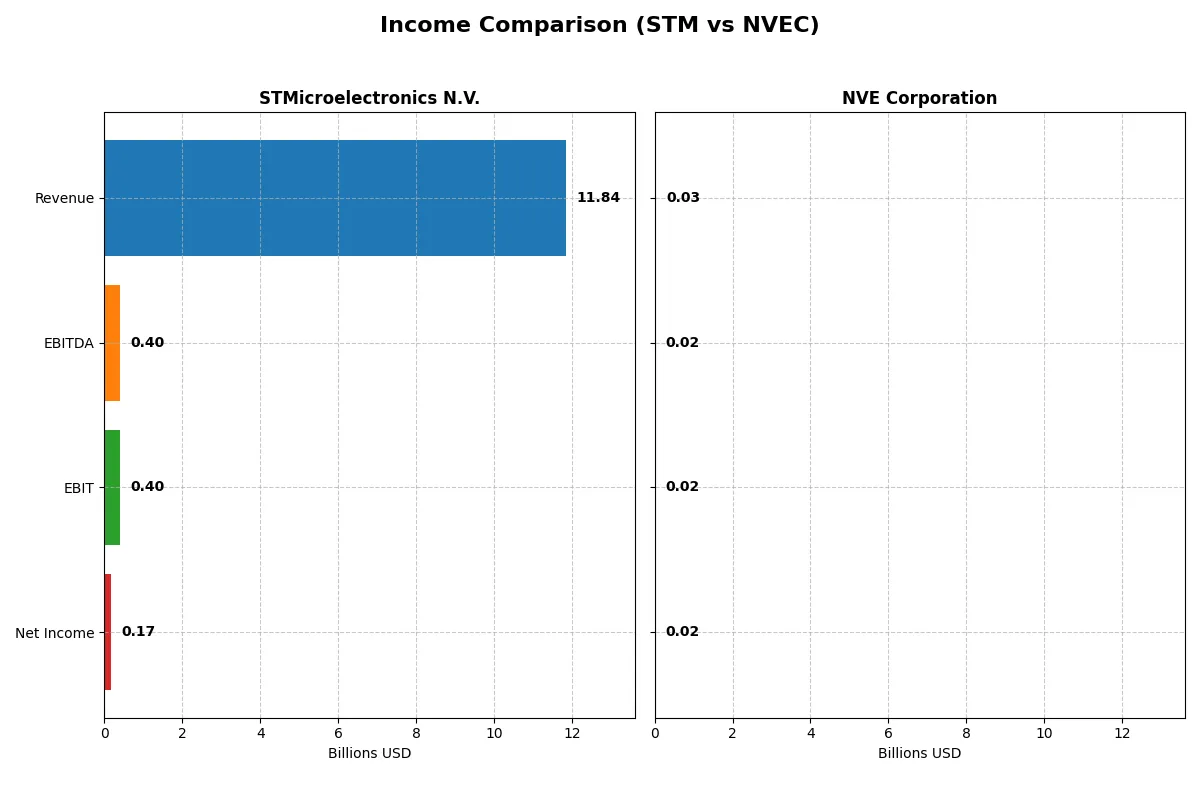
This data dissects the core profitability and scalability of both corporate engines to reveal who dominates the bottom line:
| Metric | STMicroelectronics N.V. (STM) | NVE Corporation (NVEC) |
|---|---|---|
| Revenue | 11.8B | 25.9M |
| Cost of Revenue | 7.8B | 4.2M |
| Operating Expenses | 3.7B | 5.6M |
| Gross Profit | 4.0B | 21.6M |
| EBITDA | 401M | 16.3M |
| EBIT | 401M | 16.0M |
| Interest Expense | 0 | 0 |
| Net Income | 167M | 15.1M |
| EPS | 0.19 | 3.12 |
| Fiscal Year | 2025 | 2025 |
Income Statement Analysis: The Bottom-Line Duel
This income statement comparison reveals which company runs a more efficient and profitable business engine amid recent market challenges.
STMicroelectronics N.V. Analysis
STMicroelectronics reports a declining revenue trend, falling 10.8% in 2025 to $11.8B from $13.3B in 2024. Gross margin contracts to 33.9%, reflecting cost pressures, while net margin shrinks to 1.4%, signaling eroding profitability. The 2025 net income plummets to $167M, a sharp drop from $1.56B in 2024, highlighting weak operational momentum and margin compression.
NVE Corporation Analysis
NVE Corporation posts a 2025 revenue of $25.9M, down 13.2% from $29.8M in 2024, yet maintains a robust gross margin of 83.6%. Net margin remains exceptionally strong at 58.2%, supporting a net income of $15.1M. Despite slight revenue contraction, NVE’s profitability and margin resilience emphasize superior operational efficiency and capital discipline over the period.
Verdict: Margin Power vs. Revenue Scale
NVE Corporation outperforms STM in profitability and margin quality despite smaller scale. STM’s revenue and income sharply decline with weak net margins near 1.4%. NVE’s 58.2% net margin and positive net income growth over five years mark it as the more fundamentally sound operator. Investors prioritizing strong margins and earnings quality should favor NVE’s profile.
Financial Ratios Comparison
These vital ratios act as a diagnostic tool to expose the underlying fiscal health, valuation premiums, and capital efficiency of the companies compared below:
| Ratios | STMicroelectronics N.V. (STM) | NVE Corporation (NVEC) |
|---|---|---|
| ROE | 9.0% (2025) | 24.2% (2025) |
| ROIC | 6.3% (2025) | 21.1% (2025) |
| P/E | 14.4 (2024) | 20.5 (2025) |
| P/B | 1.29 (2024) | 4.95 (2025) |
| Current Ratio | 3.11 (2024) | 28.4 (2025) |
| Quick Ratio | 2.37 (2024) | 22.0 (2025) |
| D/E | 0.18 (2024) | 0.015 (2025) |
| Debt-to-Assets | 12.8% (2024) | 1.4% (2025) |
| Interest Coverage | 19.7 (2024) | N/A |
| Asset Turnover | 0.54 (2024) | 0.40 (2025) |
| Fixed Asset Turnover | 1.22 (2024) | 8.91 (2025) |
| Payout ratio | 18.5% (2024) | 128.4% (2025) |
| Dividend yield | 1.28% (2024) | 6.28% (2025) |
| Fiscal Year | 2025 | 2025 |
Efficiency & Valuation Duel: The Vital Signs
Ratios act as a company’s DNA, revealing hidden risks and operational excellence critical for investment decisions.
STMicroelectronics N.V.
STMicroelectronics shows weak profitability with a return on equity (ROE) of only 0.93% and a net margin of 1.41%. The valuation appears favorable due to a low price-to-earnings ratio (P/E). However, the firm’s high current ratio signals potential inefficiencies in asset utilization. It pays no dividends, instead reinvesting heavily in R&D at 17.3% of revenue to fuel growth.
NVE Corporation
NVE boasts strong profitability, with ROE at 24.19% and an outstanding net margin of 58.22%, reflecting operational efficiency. Its P/E ratio of 20.46 is neutral, but a high price-to-book ratio of 4.95 indicates some valuation stretch. NVE returns value through a 6.28% dividend yield while maintaining low debt, balancing growth and income for shareholders.
Premium Profitability vs. Conservative Valuation
NVE leads with superior profitability and shareholder income, despite a stretched book valuation. STMicroelectronics offers a more conservative valuation but struggles operationally. Investors seeking income and efficiency may prefer NVE, while those favoring reinvestment and potential growth might lean toward STMicroelectronics.
Which one offers the Superior Shareholder Reward?
I observe stark contrasts in distribution strategies between STMicroelectronics (STM) and NVE Corporation (NVEC). STM pays a modest dividend yield near 1.28% with a conservative payout ratio (~18%), focusing on steady dividends but weak free cash flow (FCF) coverage, as 2025’s FCF turned negative (-0.24/share). STM’s buybacks are limited, signaling cautious capital return. NVEC delivers a robust 6.28% dividend yield with payout ratios above 100%, supported by strong FCF (2.7/share in 2025) and aggressive buybacks enhancing total returns. NVEC’s model relies on high operating margins and FCF to sustain generous distributions, evidenced by a cash ratio exceeding 6. NVEC’s yield and buyback intensity offer superior shareholder rewards, but investors must monitor dividend sustainability given elevated payout ratios. Overall, NVEC presents a more attractive total return profile in 2026, blending strong cash flow with aggressive capital return, while STM favors conservative income with limited buybacks.
Comparative Score Analysis: The Strategic Profile
The radar chart reveals the fundamental DNA and trade-offs of STMicroelectronics N.V. and NVE Corporation, highlighting their distinct financial strengths and valuation profiles:
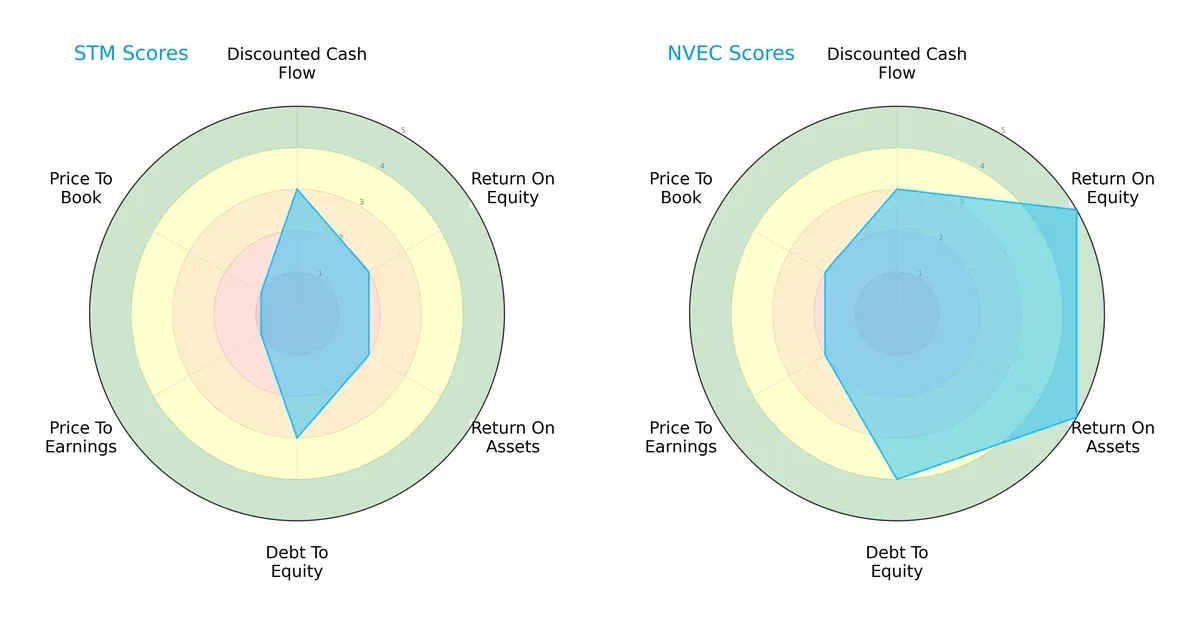
NVE leads with a more balanced profile, boasting top-tier ROE (5) and ROA (5) scores, and a favorable debt-to-equity score (4). STM shows moderate operational efficiency with ROE and ROA at 2 but suffers from very unfavorable valuation scores (PE and PB at 1). STM leans heavily on moderate cash flow and balance sheet stability, while NVE excels in profitability and prudent leverage.
—
Bankruptcy Risk: Solvency Showdown
NVE’s Altman Z-Score far exceeds STM’s, indicating superior financial resilience and a significantly lower bankruptcy risk in this cycle:
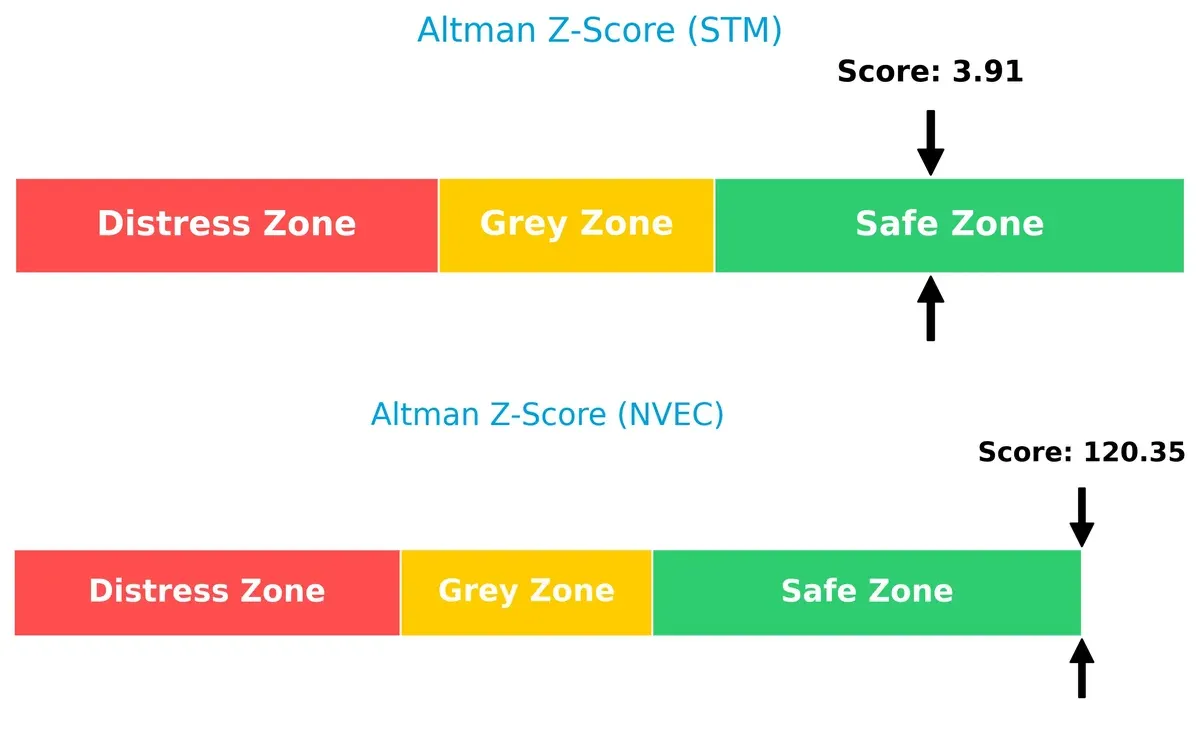
NVE’s score of 120 places it in a secure zone, signaling strong solvency and operational stability. STM’s score near 3.9 still resides safely above distress, but it lacks the buffer that NVE enjoys against economic downturns.
—
Financial Health: Quality of Operations
STM outperforms NVE on the Piotroski F-Score, reflecting stronger internal financial controls and operational quality:
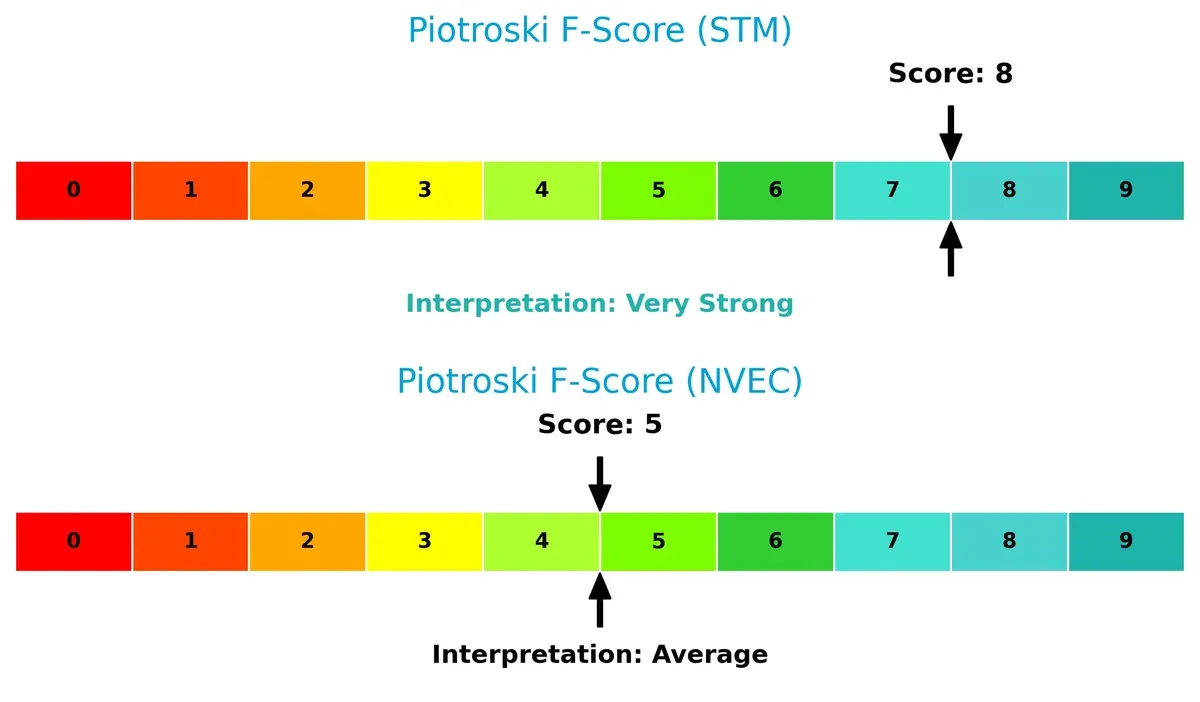
STM’s score of 8 signals very strong financial health, showing robust profitability and efficient asset management. NVE’s 5 indicates average quality, suggesting some internal metrics may require improvement to match STM’s operational rigor. This gap hints at potential red flags in NVE’s financial consistency.
How are the two companies positioned?
This section dissects STM and NVEC’s operational DNA by comparing their revenue distribution and internal strengths and weaknesses. The goal is to confront their economic moats and reveal which model offers the most durable competitive advantage today.
Revenue Segmentation: The Strategic Mix
The following visual comparison dissects how STMicroelectronics N.V. and NVE Corporation diversify their income streams and where their primary sector bets lie:
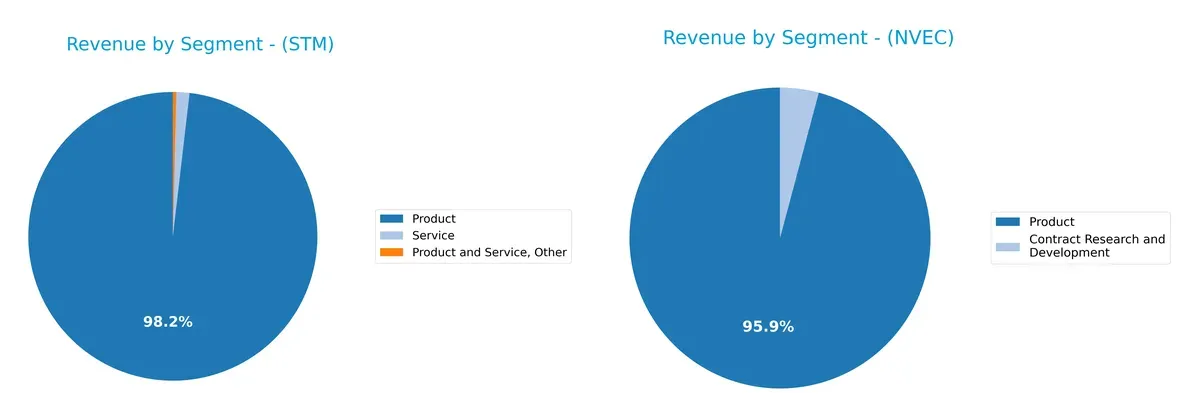
STMicroelectronics anchors its revenue heavily in the Product segment with $13.2B in 2024, dwarfing Service and Other revenues. This concentration signals strong product ecosystem dominance but raises concentration risk. NVE Corporation’s $25.9M Product revenue dwarfs its $1.1M Contract Research segment, showing less diversification but a clear product focus. STMicro’s scale and mix imply infrastructure strength; NVE’s narrower base reflects a leaner, specialized business model.
Strengths and Weaknesses Comparison
This table compares the Strengths and Weaknesses of STMicroelectronics N.V. and NVE Corporation:
STM Strengths
- Diverse product segments with $13.2B product revenue and $52M other services
- Strong global presence across Asia Pacific, Americas, and EMEA
- Low debt-to-equity ratio at 0.12 indicates prudent capital structure
- Favorable quick ratio of 2.43 reflects solid short-term liquidity
NVEC Strengths
- Exceptional profitability with 58.22% net margin and 24.19% ROE
- High ROIC at 21.14% well above WACC of 9.56% signals efficient capital allocation
- Strong fixed asset turnover at 8.91 demonstrates asset use efficiency
- Global presence including US, Europe, and Asia Pacific with focused product revenue
STM Weaknesses
- Low profitability metrics: 1.41% net margin, 0.93% ROE, and 0.67% ROIC below WACC
- Current ratio of 3.36 flagged unfavorable, potentially indicating working capital inefficiencies
- Asset turnover at 0.48 is weak, reflecting lower operational efficiency
- Zero dividend yield may limit income appeal
NVEC Weaknesses
- Extremely high current ratio at 28.4 indicates possible excess liquidity or inefficient asset use
- Price-to-book ratio of 4.95 considered unfavorable, suggesting valuation premium
- Moderate P/E at 20.46 and dividend yield at 6.28% rated neutral
- Asset turnover of 0.4 is low despite strong profitability
STMicroelectronics shows broad diversification and healthy global reach but struggles with profitability and operational efficiency. NVE Corporation excels on profitability and capital efficiency but faces questions on asset utilization and valuation. These contrasts highlight different strategic focuses and financial health profiles.
The Moat Duel: Analyzing Competitive Defensibility
A structural moat is the only thing protecting long-term profits from relentless competition erosion. Let’s dissect STM and NVEC’s moats:
STMicroelectronics N.V. (STM): Scale and Diversification Moat
STM’s competitive advantage stems from broad industry reach and diversified semiconductor segments. Its financials reveal margin stability despite recent profit declines. New product innovation in automotive and MEMS sensors could deepen its moat, but declining ROIC signals caution in 2026.
NVE Corporation (NVEC): Specialized Technology Moat
NVEC’s moat arises from proprietary spintronics technology, a niche with high barriers to entry. It sustains very high ROIC and net margins, outperforming STM’s scale. Growing profitability and focused innovation in industrial IoT sensors position NVEC for expanding its moat in 2026.
Verdict: Diversification Scale vs. Niche Innovation
NVEC holds a deeper moat with a ROIC 11.6% above WACC and rising profitability. STM shows a broad but weakening moat, shedding value with declining ROIC. NVEC is better equipped to defend and grow its market share amid intensifying semiconductor competition.
Which stock offers better returns?
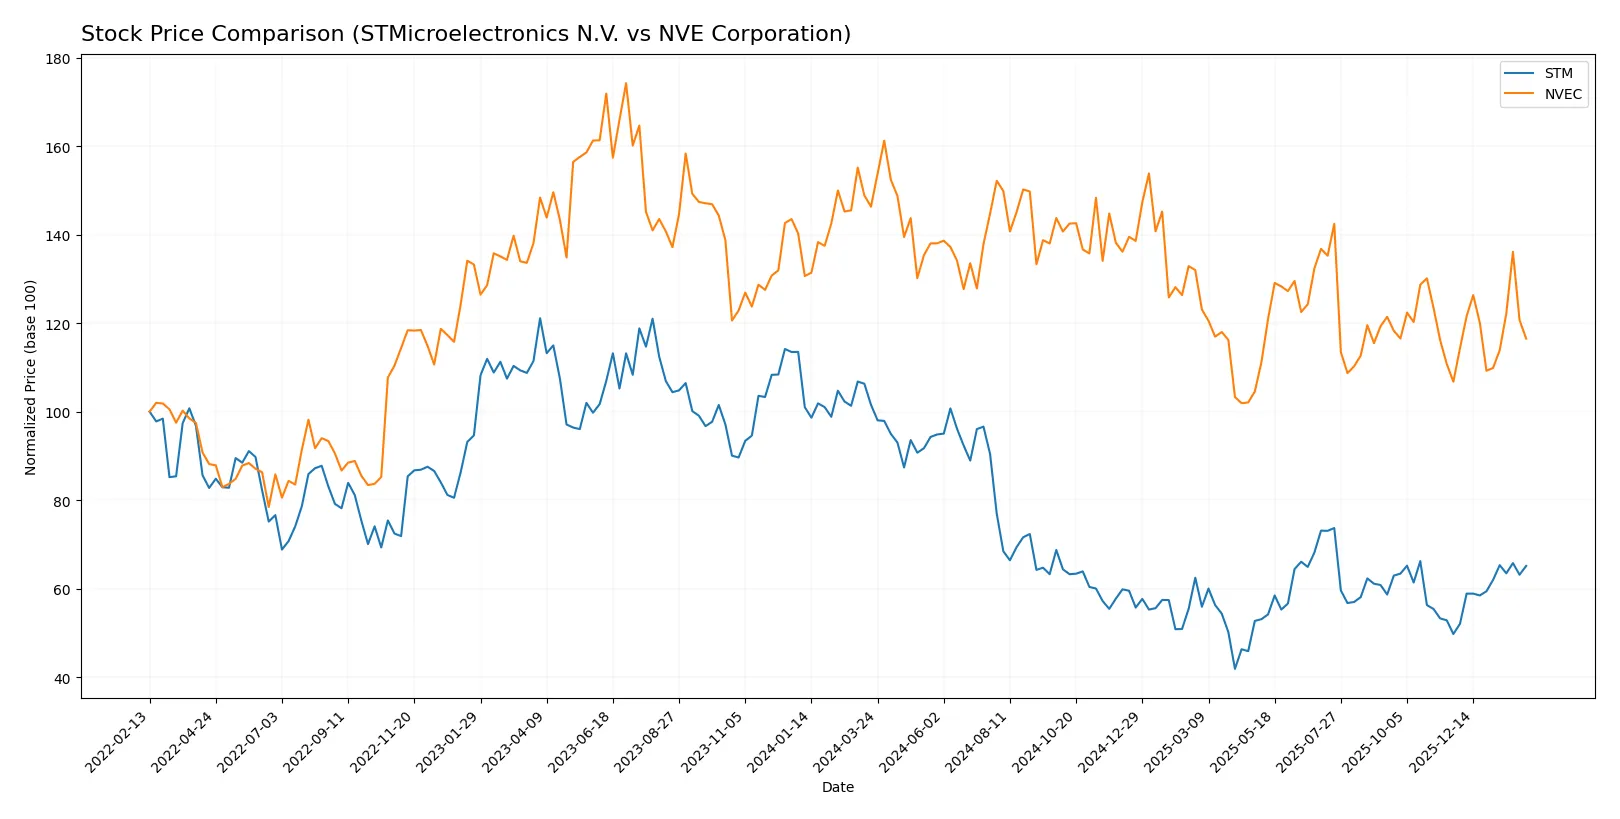
Over the past year, both STMicroelectronics N.V. and NVE Corporation experienced notable price declines, with recent partial recoveries showing differing momentum and trading dynamics.
Trend Comparison
STMicroelectronics N.V. shows a 35.86% price decline over the last 12 months, reflecting a bearish trend with accelerating downside despite a recent 30.93% rebound since November 2025. Volatility remains moderate at 6.54%.
NVE Corporation also exhibits a bearish trend, down 20.38% over the year with accelerating losses but a smaller recent recovery of 9.12% since late November 2025. Its volatility is higher at 7.56%.
Comparing both, STMicroelectronics N.V. suffered a larger overall decline but gained more strongly in the recent period. NVE Corporation posted a smaller total loss and a milder rebound. STMicroelectronics has delivered the higher recent market performance.
Target Prices
Analysts present a mixed target consensus for these semiconductor stocks.
| Company | Target Low | Target High | Consensus |
|---|---|---|---|
| STMicroelectronics N.V. | 28 | 45 | 37.67 |
STMicroelectronics’ consensus target of 37.67 implies upside from the current 28.71 price. No verified target price data is available for NVE Corporation.

Don’t Let Luck Decide Your Entry Point
Optimize your entry points with our advanced ProRealTime indicators. You’ll get efficient buy signals with precise price targets for maximum performance. Start outperforming now!
How do institutions grade them?
The institutional grades provide insight into the market sentiment for each company:
STMicroelectronics N.V. Grades
The following table summarizes recent grades from notable financial institutions for STMicroelectronics N.V.:
| Grading Company | Action | New Grade | Date |
|---|---|---|---|
| TD Cowen | maintain | Buy | 2025-10-24 |
| Susquehanna | maintain | Positive | 2025-10-22 |
| Susquehanna | maintain | Positive | 2025-07-25 |
| Baird | upgrade | Outperform | 2025-07-22 |
| Susquehanna | maintain | Positive | 2025-07-22 |
| Jefferies | upgrade | Buy | 2025-02-19 |
| Bernstein | downgrade | Market Perform | 2025-02-05 |
| Susquehanna | maintain | Positive | 2025-01-31 |
| Barclays | downgrade | Underweight | 2025-01-22 |
| JP Morgan | downgrade | Neutral | 2024-12-09 |
NVE Corporation Grades
No reliable institutional grades are available for NVE Corporation.
Which company has the best grades?
STMicroelectronics N.V. has a diverse set of institutional grades, mostly positive, reflecting some analyst confidence. NVE Corporation lacks grade data, limiting direct comparison and investor insight.
Risks specific to each company
The following categories identify critical pressure points and systemic threats facing STMicroelectronics N.V. and NVE Corporation in the challenging 2026 market environment:
1. Market & Competition
STMicroelectronics N.V.
- Large semiconductor player facing intense global competition and cyclical demand swings.
NVE Corporation
- Niche spintronics innovator with limited scale but specialized market positioning.
2. Capital Structure & Debt
STMicroelectronics N.V.
- Low debt-to-equity ratio (0.12) signals strong balance sheet and moderate leverage risk.
NVE Corporation
- Extremely low debt (0.01 D/E), minimal financial risk but limited capital for large expansions.
3. Stock Volatility
STMicroelectronics N.V.
- Higher beta (1.32) implies greater sensitivity to market swings and cyclical semiconductor volatility.
NVE Corporation
- Beta at 1.22 denotes moderate volatility but less than STM, reflecting smaller firm dynamics.
4. Regulatory & Legal
STMicroelectronics N.V.
- Global operations expose STM to complex regulatory frameworks and trade tensions.
NVE Corporation
- Primarily US-based with less regulatory complexity but vulnerable to niche tech IP litigation.
5. Supply Chain & Operations
STMicroelectronics N.V.
- Large, diversified supply chain; risks include component shortages and geopolitical disruptions.
NVE Corporation
- Small scale limits supply chain complexity but increases dependency on few suppliers.
6. ESG & Climate Transition
STMicroelectronics N.V.
- Faces pressure to meet stringent ESG standards given industrial footprint and global scope.
NVE Corporation
- ESG risks lower due to smaller scale but must innovate sustainably to maintain niche leadership.
7. Geopolitical Exposure
STMicroelectronics N.V.
- Significant exposure to Europe, Asia, Americas; vulnerable to trade disputes and sanctions.
NVE Corporation
- US-centric operations reduce geopolitical risk but global sales still pose some exposure.
Which company shows a better risk-adjusted profile?
NVE Corporation’s most impactful risk is its extreme dependency on niche technology and limited scale, risking market disruption and financial flexibility. STMicroelectronics faces significant geopolitical and competitive risks due to its global scale and sector cyclicality. However, STM’s diversified operations and robust capital structure partially mitigate these threats. I see NVE’s superior profitability metrics and clean balance sheet as strengths, but its outsized current ratio signals inefficiency. STM’s balanced financial profile and safer Altman Z-Score position it with a more stable risk-adjusted profile in 2026’s volatile semiconductor landscape.
Final Verdict: Which stock to choose?
STMicroelectronics N.V. (STM) shines with its robust liquidity and disciplined capital structure, making it a resilient cash generator. However, its declining profitability and value destruction signal a point of vigilance. STM suits investors seeking exposure to cyclical semiconductor markets with an appetite for turnaround risk.
NVE Corporation (NVEC) boasts a formidable moat driven by exceptional returns on invested capital and a sustainable competitive advantage. Its high margins and prudent balance sheet offer greater stability compared to STM. NVEC fits well for investors targeting growth at a reasonable price with a preference for durable profitability.
If you prioritize capital efficiency and steady value creation, NVE Corporation outshines STM with its growing ROIC and superior income quality. However, if you seek speculative exposure in a volatile sector, STM could appeal due to its strong liquidity and recovery potential despite current challenges. Both profiles require careful risk assessment given market cyclicality and individual company dynamics.
Disclaimer: Investment carries a risk of loss of initial capital. The past performance is not a reliable indicator of future results. Be sure to understand risks before making an investment decision.
Go Further
I encourage you to read the complete analyses of STMicroelectronics N.V. and NVE Corporation to enhance your investment decisions: