Home > Comparison > Technology > SWKS vs NVEC
The strategic rivalry between Skyworks Solutions, Inc. and NVE Corporation shapes the semiconductor industry’s innovation frontier. Skyworks operates as a diversified semiconductor powerhouse with broad market exposure, while NVE specializes in niche spintronic sensors and couplers targeting factory automation and medical devices. This head-to-head contrasts scale-driven market leadership against focused technological innovation. This analysis will determine which corporate path offers superior risk-adjusted returns for a well-diversified technology portfolio.
Table of contents
Companies Overview
Skyworks Solutions and NVE Corporation are pivotal players in the semiconductor industry with distinct market scopes.
Skyworks Solutions, Inc.: Broad-Based Semiconductor Powerhouse
Skyworks Solutions commands a diverse semiconductor portfolio that fuels connectivity in aerospace, automotive, and consumer electronics. It generates revenue by designing and manufacturing proprietary chips like amplifiers and front-end modules. In 2026, its strategic focus remains on expanding global footprint and enhancing integrated chip solutions for wireless and IoT applications.
NVE Corporation: Niche Spintronics Innovator
NVE Corporation specializes in spintronic technology, producing sensors and couplers for factory automation and medical devices. It derives income through sales of magnetic sensors and licensing spintronic memory innovations. The company’s 2026 strategy centers on advancing industrial IoT applications and expanding R&D collaborations to cement its niche leadership.
Strategic Collision: Similarities & Divergences
Skyworks pursues a broad-market approach with a comprehensive semiconductor ecosystem, while NVE operates within a specialized spintronics niche. Their primary battleground is innovation in connectivity—Skyworks in wireless infrastructure, NVE in sensor precision for automation. These contrasting profiles highlight Skyworks’ scale-driven growth versus NVE’s focused technological moat.
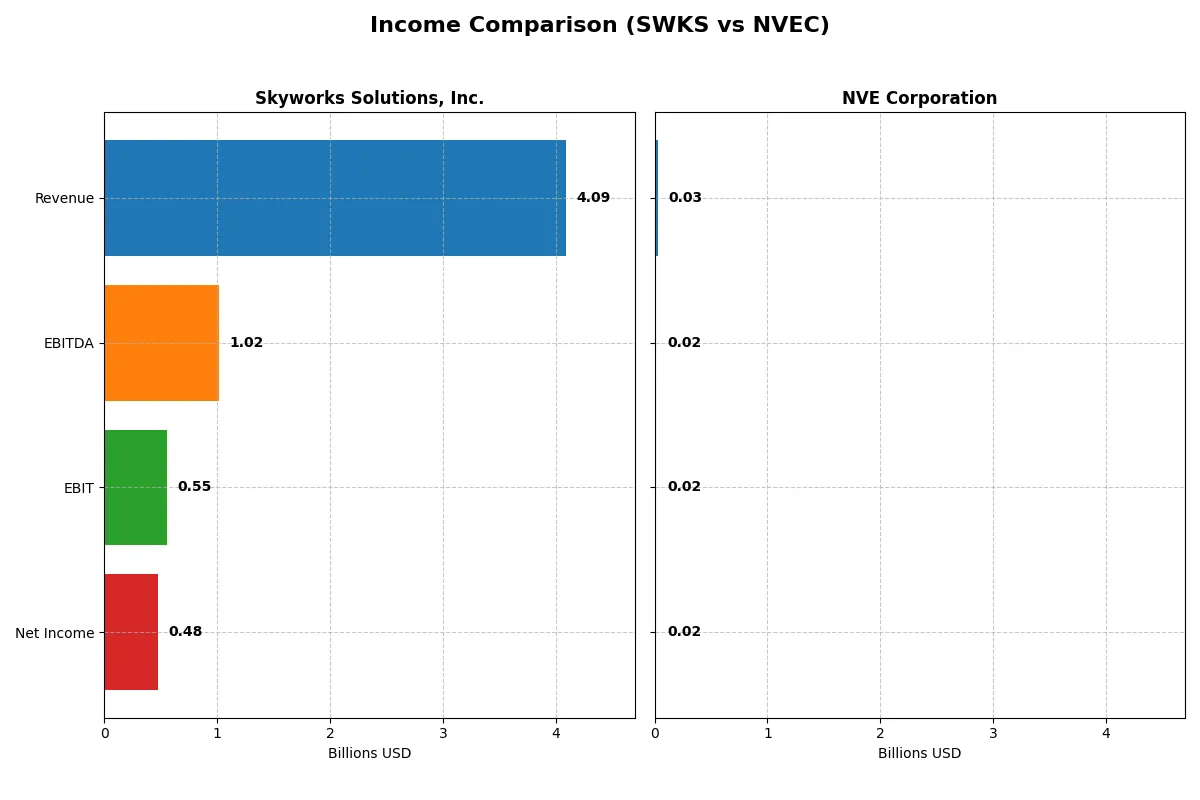
Income Statement Comparison
The following data dissects the core profitability and scalability of both corporate engines to reveal who dominates the bottom line:
| Metric | Skyworks Solutions, Inc. (SWKS) | NVE Corporation (NVEC) |
|---|---|---|
| Revenue | 4.09B | 26M |
| Cost of Revenue | 2.40B | 4.24M |
| Operating Expenses | 1.18B | 5.64M |
| Gross Profit | 1.68B | 21.64M |
| EBITDA | 1.02B | 16.32M |
| EBIT | 554M | 16.0M |
| Interest Expense | 27M | 0 |
| Net Income | 477M | 15.06M |
| EPS | 3.09 | 3.12 |
| Fiscal Year | 2025 | 2025 |
Income Statement Analysis: The Bottom-Line Duel
This income statement comparison reveals the true efficiency and profitability of each company’s operational engine over recent years.
Skyworks Solutions, Inc. Analysis
Skyworks shows a declining revenue trend from $5.49B in 2022 to $4.09B in 2025. Net income fell sharply from $1.50B in 2021 to $477M in 2025. Despite healthy gross margins near 41%, net margin compressed to 11.7%. The latest year’s decline signals weakening operational momentum and margin pressure.
NVE Corporation Analysis
NVE posts smaller scale with $26M revenue in 2025 but grows overall from $21M in 2021. Net income improved steadily to $15M in 2025. Margins impress with an 83.6% gross margin and 58.2% net margin, reflecting strong cost control. The firm maintains solid profitability despite a recent 13% revenue dip.
Margin Strength vs. Scale Decline
NVE’s income statement highlights superior margin efficiency and consistent net income growth, contrasting with Skyworks’ shrinking revenue and profit. NVE’s compact but profitable model outperforms the larger peer suffering margin erosion. For investors favoring resilient profitability, NVE’s profile appears more attractive amid sector challenges.
Financial Ratios Comparison
These vital ratios act as a diagnostic tool to expose underlying fiscal health, valuation premiums, and capital efficiency for a clear comparative view:
| Ratios | Skyworks Solutions, Inc. (SWKS) | NVE Corporation (NVEC) |
|---|---|---|
| ROE | 8.29% | 24.19% |
| ROIC | 6.35% | 21.14% |
| P/E | 24.95 | 20.46 |
| P/B | 2.07 | 4.95 |
| Current Ratio | 2.33 | 28.40 |
| Quick Ratio | 1.76 | 22.03 |
| D/E | 0.21 | 0.01 |
| Debt-to-Assets | 15.20% | 1.43% |
| Interest Coverage | 18.45 | 0 |
| Asset Turnover | 0.52 | 0.40 |
| Fixed Asset Turnover | 2.95 | 8.91 |
| Payout Ratio | 90.67% | 128.38% |
| Dividend Yield | 3.63% | 6.28% |
| Fiscal Year | 2025 | 2025 |
Efficiency & Valuation Duel: The Vital Signs
Financial ratios act as a company’s DNA, revealing hidden risks, operational strengths, and valuation nuances investors must decode.
Skyworks Solutions, Inc.
Skyworks shows moderate profitability with an 8.3% ROE and a solid 11.7% net margin, but its 25 P/E suggests a fairly valued stock. The firm maintains a sound balance sheet with a 2.33 current ratio and a 3.63% dividend yield, rewarding shareholders steadily while reinvesting nearly 19% of revenue into R&D.
NVE Corporation
NVE delivers robust returns: a 24.2% ROE and an impressive 58.2% net margin highlight operational efficiency. Its 20.5 P/E is reasonable but paired with a high 4.95 P/B ratio, indicating a stretched valuation. NVE retains capital with minimal debt and a massive current ratio of 28.4, prioritizing growth over dividends with a 6.3% yield considered neutral.
Balanced Efficiency vs. Growth Intensity
NVE offers superior profitability and growth potential, though at the cost of stretched valuation and liquidity concentration. Skyworks presents a more balanced profile, with stable returns, prudent leverage, and shareholder dividends. Risk-averse investors may prefer Skyworks’ steadiness; growth seekers may favor NVE’s operational firepower despite valuation risks.
Which one offers the Superior Shareholder Reward?
I compare Skyworks Solutions (SWKS) and NVE Corporation (NVEC) on shareholder returns by analyzing their dividend yields, payout ratios, and buyback intensity. SWKS yields around 3.6% in 2025 with a payout ratio near 91%, showing strong free cash flow coverage and moderate buybacks. NVEC offers a higher yield of 6.3% but pays out more than 100% of earnings, signaling dividend sustainability risks despite robust operating margins. NVEC’s minimal debt and aggressive dividend policy contrast with SWKS’s balanced approach, including meaningful buybacks supporting total returns. I find SWKS’s distribution model more sustainable and attractive for 2026 investors seeking long-term value and prudent capital allocation.
Comparative Score Analysis: The Strategic Profile
The radar chart reveals the fundamental DNA and trade-offs of both firms, highlighting their competitive advantages and financial discipline:
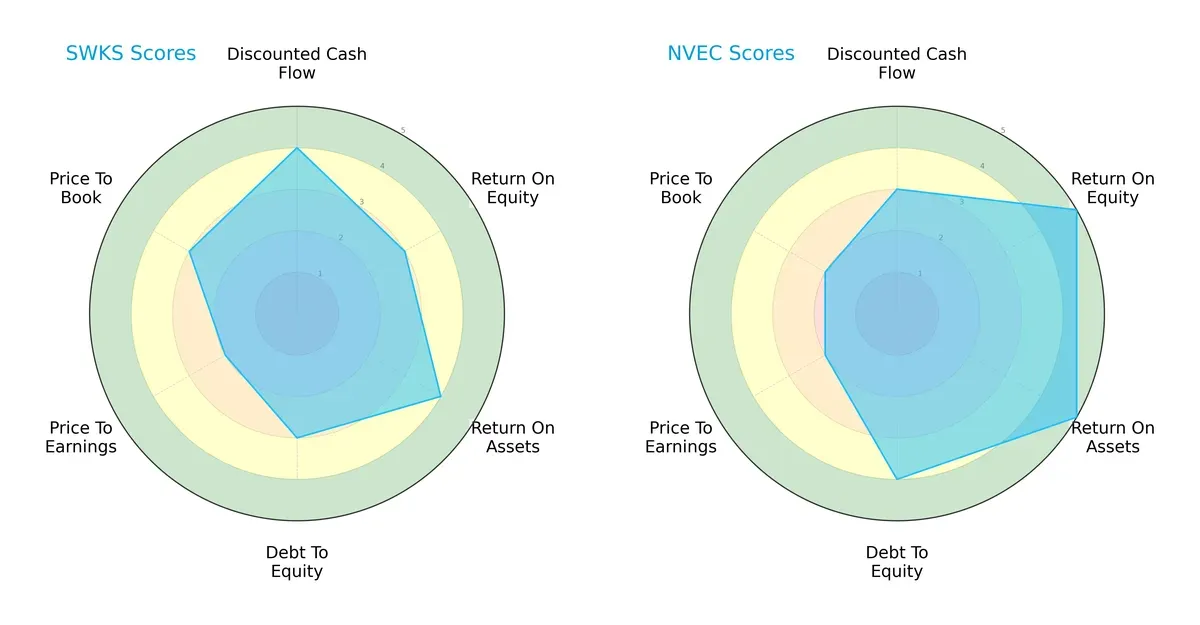
Skyworks Solutions, Inc. shows strength in discounted cash flow (4) and return on assets (4), indicating solid cash generation and asset efficiency. NVE Corporation excels in return on equity (5) and return on assets (5), reflecting superior profitability and asset utilization. NVE also maintains a stronger debt-to-equity score (4) than Skyworks (3), suggesting better financial stability. However, Skyworks edges slightly on price-to-book valuation (3 vs. 2). Overall, NVE presents a more balanced and robust profile, while Skyworks relies on its cash flow advantage.
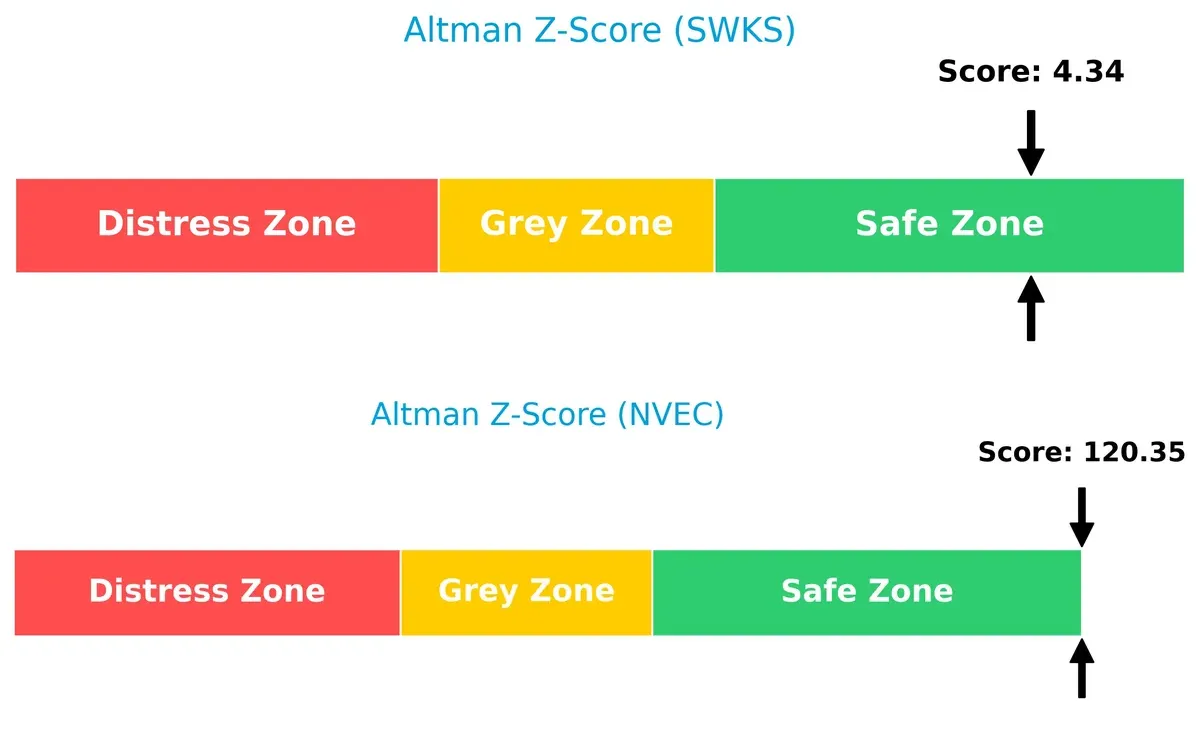
Bankruptcy Risk: Solvency Showdown
NVE Corporation’s Altman Z-Score (120.35) vastly outperforms Skyworks Solutions’ (4.34), signaling near-zero bankruptcy risk versus a safe but comparatively moderate buffer for Skyworks:
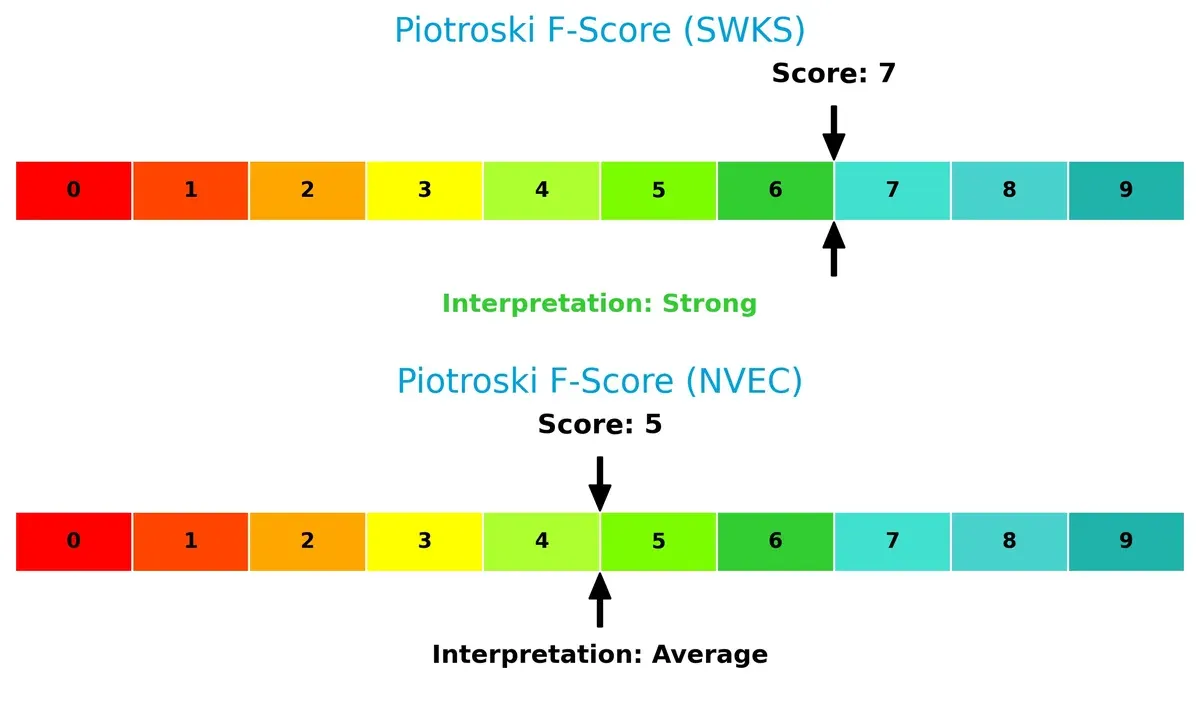
Financial Health: Quality of Operations
Skyworks Solutions leads with a Piotroski F-Score of 7, indicating strong financial health and operational quality. NVE’s score of 5 suggests average strength with potential internal risks to monitor:
How are the two companies positioned?
This section dissects the operational DNA of Skyworks Solutions and NVE Corporation by comparing their revenue distribution and internal strengths and weaknesses. The goal is to confront their economic moats to reveal which model delivers the most resilient competitive advantage today.
Revenue Segmentation: The Strategic Mix
The following visual comparison dissects how both firms diversify their income streams and where their primary sector bets lie:
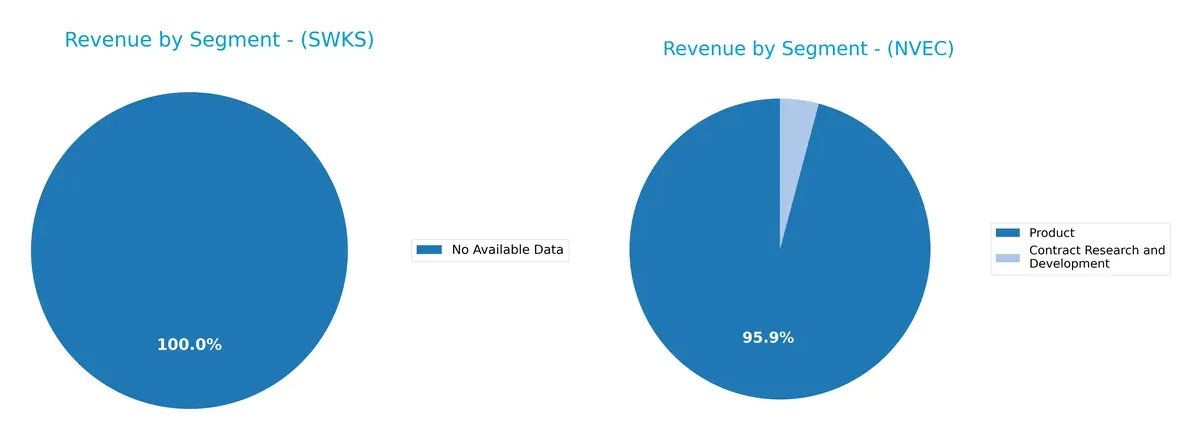
Skyworks Solutions, Inc. lacks available segmentation data, so I cannot evaluate its revenue diversity. In contrast, NVE Corporation anchors its revenue heavily in Product sales, ranging around $25B annually, while Contract Research and Development contributes below $3M. This concentration signals a strong operational focus with limited diversification, implying potential concentration risk but also a sharp strategic commitment to product innovation and infrastructure dominance.
Strengths and Weaknesses Comparison
This table compares the strengths and weaknesses of Skyworks Solutions, Inc. (SWKS) and NVE Corporation (NVEC):
SWKS Strengths
- Favorable net margin at 11.67%
- Strong current and quick ratios indicate liquidity
- Low debt-to-equity and debt-to-assets ratios
- Consistent dividend yield at 3.63%
- Large global presence with significant US and Asia revenues
NVEC Strengths
- Exceptionally high net margin at 58.22%
- Strong ROE and ROIC well above WACC
- Very low debt levels and infinite interest coverage
- High fixed asset turnover at 8.91
- Solid quick ratio and favorable global diversification
SWKS Weaknesses
- ROE below WACC at 8.29% signals inefficient equity use
- Neutral ROIC against WACC questions capital allocation
- Neutral valuations with moderate P/E and P/B
- Asset turnover at 0.52 is average, limiting operational efficiency
NVEC Weaknesses
- Unfavorable current ratio at 28.4 suggests excessive short-term assets
- Elevated P/B ratio at 4.95 indicates potential overvaluation
- Asset turnover low at 0.4 despite high fixed asset turnover
- Higher proportion of unfavorable ratios (21.43%)
Both companies show strong profitability and financial health but face contrasting liquidity profiles and valuation metrics. SWKS benefits from balanced global exposure and stable dividends, while NVEC excels in profitability and asset efficiency. These factors shape their strategic focus on capital allocation and market positioning.
The Moat Duel: Analyzing Competitive Defensibility
A structural moat is the only true shield protecting long-term profits from relentless competitive pressure. Let’s examine how these two semiconductor firms defend their turf:
Skyworks Solutions, Inc.: Legacy Scale Meets Margin Pressure
Skyworks relies on intangible assets and established customer relationships, visible in stable gross margins near 41%. However, declining ROIC signals value erosion, threatening its moat unless it innovates aggressively in 2026.
NVE Corporation: Spintronics Pioneer with High-Return Edge
NVE’s moat stems from proprietary spintronic technology, delivering exceptional margins above 60% and a rising ROIC. This unique tech niche offers room for growth and deepening moat in emerging IoT markets.
Verdict: Proprietary Innovation vs. Established Scale
NVE’s growing ROIC and industry-leading margins indicate a deeper moat than Skyworks, whose shrinking returns warn of vulnerability. NVE stands better poised to defend and expand its market share in 2026.
Which stock offers better returns?
The past year shows contrasting price movements: Skyworks Solutions declines sharply while NVE Corporation partially recovers after an earlier drop.
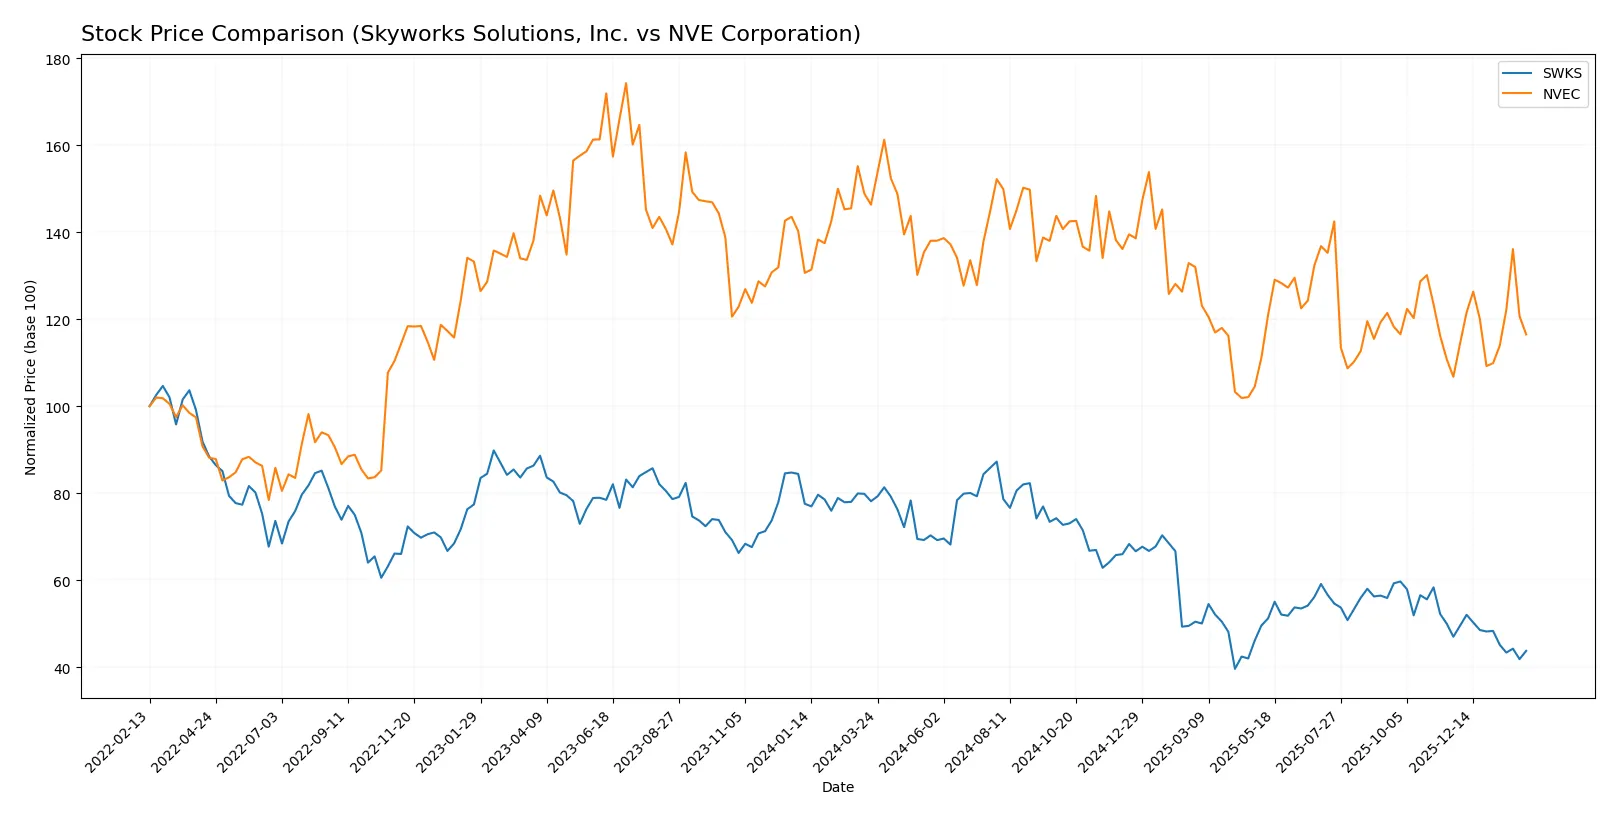
Trend Comparison
Skyworks Solutions’ stock fell 44% over the past 12 months, marking a clear bearish trend with decelerating losses and high volatility (16.5 std deviation). The recent quarter worsened by nearly 7%, confirming persistent weakness.
NVE Corporation’s shares dropped 20% yearly but accelerated their decline early on. Recently, the stock gained 9%, indicating a bullish reversal with moderate volatility (4.39 std deviation) and upward momentum.
NVE outperformed Skyworks, delivering the higher market return despite a negative annual trend, driven by a recent price recovery contrasting Skyworks’ ongoing decline.
Target Prices
Skyworks Solutions, Inc. shows a broad analyst target consensus with significant upside potential.
| Company | Target Low | Target High | Consensus |
|---|---|---|---|
| Skyworks Solutions, Inc. | 58 | 140 | 77.36 |
The consensus target of $77.36 exceeds the current price near $57.88, signaling analyst optimism despite a wide valuation range. No verified target price data is available from recognized analysts for NVE Corporation.

Don’t Let Luck Decide Your Entry Point
Optimize your entry points with our advanced ProRealTime indicators. You’ll get efficient buy signals with precise price targets for maximum performance. Start outperforming now!
How do institutions grade them?
The following summarizes recent institutional grades for Skyworks Solutions, Inc. and NVE Corporation:
Skyworks Solutions, Inc. Grades
This table shows recent grade actions from reputable equity research firms for Skyworks Solutions:
| Grading Company | Action | New Grade | Date |
|---|---|---|---|
| Benchmark | Maintain | Hold | 2026-02-04 |
| Morgan Stanley | Maintain | Equal Weight | 2026-02-02 |
| B. Riley Securities | Maintain | Neutral | 2026-01-26 |
| Mizuho | Maintain | Neutral | 2026-01-26 |
| Susquehanna | Maintain | Neutral | 2026-01-22 |
| UBS | Maintain | Neutral | 2026-01-20 |
| Mizuho | Upgrade | Neutral | 2025-11-11 |
| JP Morgan | Maintain | Neutral | 2025-11-05 |
| UBS | Maintain | Neutral | 2025-11-05 |
| UBS | Maintain | Neutral | 2025-10-29 |
Which company has the best grades?
Skyworks Solutions holds a consistent Neutral to Hold rating from multiple respected firms, indicating moderate confidence. NVE Corporation lacks institutional grade data, leaving investors without comparable external insights. This difference may affect perceived transparency and investor sentiment.
Risks specific to each company
The following categories identify the critical pressure points and systemic threats facing both firms in the 2026 market environment:
1. Market & Competition
Skyworks Solutions, Inc.
- Faces intense competition in the global semiconductor market with pressure from larger peers and rapid innovation cycles.
NVE Corporation
- Operates in a niche spintronics market but faces growth limits and emerging competitors in IoT and medical sensors.
2. Capital Structure & Debt
Skyworks Solutions, Inc.
- Maintains a conservative capital structure with low debt-to-equity (0.21) and strong interest coverage (20.44), reducing financial risk.
NVE Corporation
- Almost debt-free, with minimal leverage (0.01 D/E), offering excellent financial stability and low default risk.
3. Stock Volatility
Skyworks Solutions, Inc.
- Beta of 1.317 indicates above-market volatility, exposing investors to higher systematic risk.
NVE Corporation
- Slightly less volatile with beta 1.219, but low trading volume can amplify price swings.
4. Regulatory & Legal
Skyworks Solutions, Inc.
- Subject to export controls and geopolitical trade tensions, especially given global semiconductor supply chain exposure.
NVE Corporation
- Smaller scale limits regulatory complexity, but emerging medical device regulations could increase compliance costs.
5. Supply Chain & Operations
Skyworks Solutions, Inc.
- Complex global supply chain vulnerable to disruptions in Asia-Pacific regions and component shortages.
NVE Corporation
- More localized operations reduce supply chain complexity but limit scalability.
6. ESG & Climate Transition
Skyworks Solutions, Inc.
- Increasing pressure to reduce carbon footprint and improve sustainability in manufacturing processes.
NVE Corporation
- Faces challenges integrating ESG into a niche technology but less exposed to large-scale industrial emissions.
7. Geopolitical Exposure
Skyworks Solutions, Inc.
- High geopolitical risk due to sales and operations in multiple regions including China and South Korea.
NVE Corporation
- Limited international footprint reduces direct geopolitical exposure but may miss growth in key markets.
Which company shows a better risk-adjusted profile?
NVE Corporation’s minimal debt and strong profitability stand out, but its niche market and limited scale pose risks. Skyworks Solution’s broader market presence and robust financials offer diversification but face higher geopolitical and market volatility risks. Overall, NVE shows a stronger risk-adjusted profile due to financial resilience and focused operations, despite lower scale and liquidity. Its exceptional net margin (58.22%) and ROE (24.19%) reflect superior capital efficiency, while Skyworks’ higher beta and global supply chain complexity increase vulnerability in 2026’s uncertain environment.
Final Verdict: Which stock to choose?
Skyworks Solutions’ superpower lies in its robust balance sheet and reliable dividend yield, making it a dependable cash generator. However, its declining profitability and value destruction signal a point of vigilance. This stock suits portfolios seeking steady income with a moderate risk appetite.
NVE Corporation boasts a strategic moat through its exceptional return on invested capital and growing profitability, underpinned by strong operational efficiency. Despite a stretched current ratio, it offers better stability than Skyworks and fits well in a GARP (Growth at a Reasonable Price) portfolio.
If you prioritize capital efficiency and sustainable competitive advantage, NVE outshines Skyworks with superior value creation and growth. However, if your focus is on income stability within a more conservative risk framework, Skyworks could be the analytical scenario worth considering.
Disclaimer: Investment carries a risk of loss of initial capital. The past performance is not a reliable indicator of future results. Be sure to understand risks before making an investment decision.
Go Further
I encourage you to read the complete analyses of Skyworks Solutions, Inc. and NVE Corporation to enhance your investment decisions: