Home > Comparison > Technology > SKYT vs NVEC
The strategic rivalry between SkyWater Technology, Inc. and NVE Corporation shapes the semiconductor industry’s evolution. SkyWater operates as a capital-intensive semiconductor foundry offering broad manufacturing services. In contrast, NVE focuses on specialized, high-margin spintronic sensor technology with a lean operational model. This analysis pits broad-scale manufacturing against niche innovation to identify which approach delivers superior risk-adjusted returns for a diversified portfolio in today’s dynamic technology sector.
Table of contents
Companies Overview
SkyWater Technology and NVE Corporation each hold distinct roles in the semiconductor market, driving innovation in niche technologies.
SkyWater Technology, Inc.: Custom Semiconductor Manufacturer
SkyWater Technology stands out as a provider of semiconductor development and manufacturing services. Its core revenue stems from engineering and process development support alongside manufacturing analog, mixed-signal, and rad-hard integrated circuits. In 2026, the company focuses strategically on co-creating innovative technologies for aerospace, automotive, and IoT sectors, leveraging its broad service capabilities.
NVE Corporation: Spintronics Innovator
NVE Corporation specializes in spintronic technology, developing sensors and couplers that detect magnetic and metallic materials. It generates revenue by selling standard and custom sensors mainly for factory automation and medical devices. The company’s 2026 strategy emphasizes expanding its industrial IoT market presence while advancing spintronic memory technology through R&D and licensing.
Strategic Collision: Similarities & Divergences
Both companies operate in semiconductors but pursue fundamentally different paths: SkyWater emphasizes custom manufacturing and broad market applications, while NVE focuses on specialized spintronic devices. Their primary battleground is innovation-driven growth in niche markets—defense and automotive for SkyWater versus factory automation and medical sensors for NVE. This divergence shapes their investment profiles, with SkyWater scaling operations broadly and NVE leveraging deep technological moats in spintronics.
Income Statement Comparison
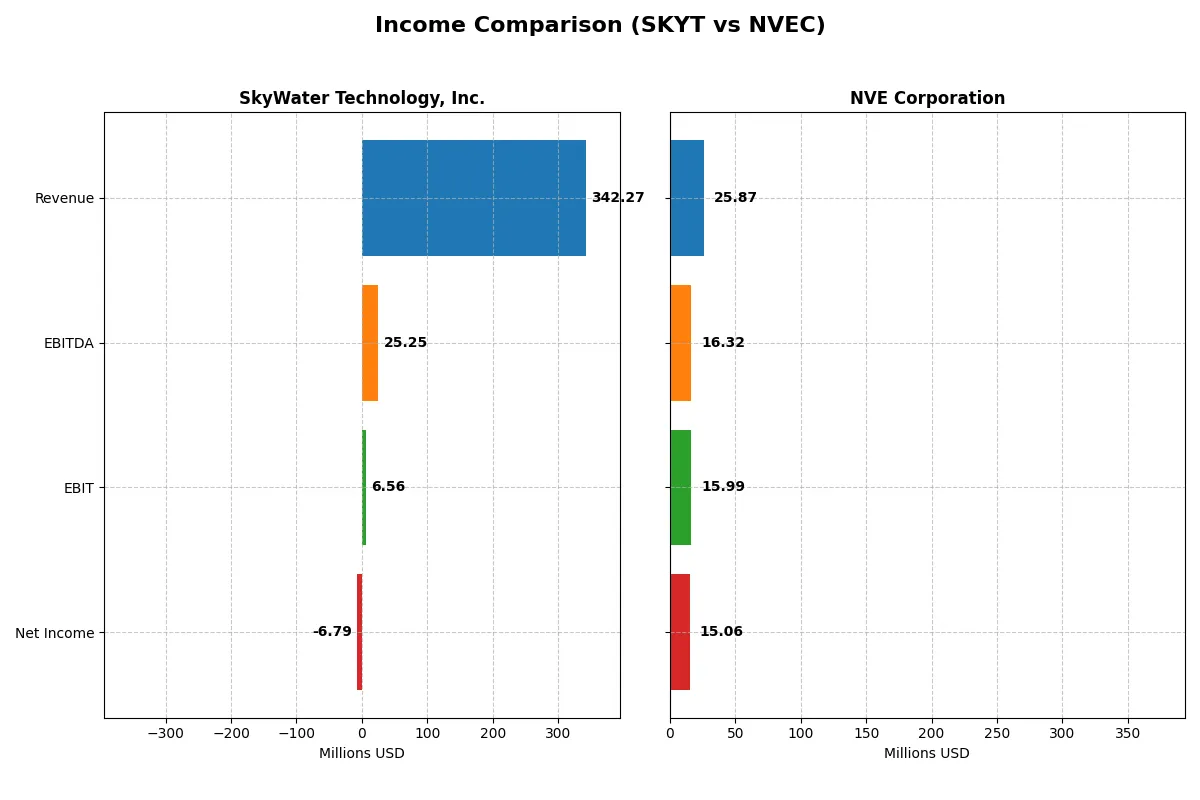
This data dissects the core profitability and scalability of both corporate engines to reveal who dominates the bottom line:
| Metric | SkyWater Technology, Inc. (SKYT) | NVE Corporation (NVEC) |
|---|---|---|
| Revenue | 342M | 26M |
| Cost of Revenue | 273M | 4.2M |
| Operating Expenses | 63M | 5.6M |
| Gross Profit | 70M | 22M |
| EBITDA | 25M | 16M |
| EBIT | 6.6M | 16M |
| Interest Expense | 8.8M | 0 |
| Net Income | -6.8M | 15M |
| EPS | -0.14 | 3.12 |
| Fiscal Year | 2024 | 2025 |
Income Statement Analysis: The Bottom-Line Duel
The upcoming income statement comparison reveals how efficiently each company converts sales into profit over recent years.
SkyWater Technology, Inc. Analysis
SkyWater Technology’s revenue surged from 140M in 2020 to 342M in 2024, a 144% growth. Despite this, it reported a net loss of 6.8M in 2024 but improved net margin from -31% in 2020 to -2% in 2024. Gross margin stands at a modest 20%, while EBIT margin hovers near breakeven at 1.9%, reflecting a nascent recovery phase.
NVE Corporation Analysis
NVE Corporation commands superior profitability with a 2025 revenue of 26M and a stellar 58% net margin. Gross margin exceeds 83%, and EBIT margin is an impressive 62%. Despite a slight revenue decline of 13% in the last year, net income remained robust at 15M, underscoring strong operational efficiency and capital-light business dynamics.
Margin Supremacy vs. Growth Recovery
NVE clearly leads in profitability with dominant margins and consistent net income, while SkyWater shows rapid revenue growth but persistent losses. Investors seeking stability may favor NVE’s strong margin profile. Those targeting turnaround potential might watch SkyWater’s improving efficiencies and revenue momentum.
Financial Ratios Comparison
These vital ratios act as a diagnostic tool to expose the underlying fiscal health, valuation premiums, and capital efficiency of the companies compared below:
| Ratios | SkyWater Technology, Inc. (SKYT) | NVE Corporation (NVEC) |
|---|---|---|
| ROE | -11.79% (2024) | 24.19% (2025) |
| ROIC | 3.40% (2024) | 21.14% (2025) |
| P/E | -100.3 (2024) | 20.46 (2025) |
| P/B | 11.82 (2024) | 4.95 (2025) |
| Current Ratio | 0.86 (2024) | 28.40 (2025) |
| Quick Ratio | 0.76 (2024) | 22.03 (2025) |
| D/E | 1.33 (2024) | 0.015 (2025) |
| Debt-to-Assets | 24.46% (2024) | 1.43% (2025) |
| Interest Coverage | 0.74 (2024) | 0 (2025) |
| Asset Turnover | 1.09 (2024) | 0.40 (2025) |
| Fixed Asset Turnover | 2.07 (2024) | 8.91 (2025) |
| Payout ratio | 0% (2024) | 128% (2025) |
| Dividend yield | 0% (2024) | 6.28% (2025) |
| Fiscal Year | 2024 | 2025 |
Efficiency & Valuation Duel: The Vital Signs
Financial ratios serve as a company’s DNA, uncovering hidden risks and operational strength beyond surface-level data.
SkyWater Technology, Inc.
SkyWater shows weak profitability with a negative ROE of -11.8% and a net margin of -1.98%. Its valuation appears stretched despite a favorable negative P/E, reflecting losses. The company lacks dividends, reinvesting heavily in R&D (around 4.4% of revenue), but its low current ratio (0.86) flags liquidity concerns.
NVE Corporation
NVE delivers robust profitability with a 24.2% ROE and a strong net margin of 58.2%. Its P/E of 20.5 signals a fair valuation, though a high price-to-book ratio (4.95) suggests some premium. NVE pays a 6.3% dividend yield, rewarding shareholders directly while maintaining solid liquidity with a quick ratio above 22.
Profitability and Valuation: Stability vs. Growth Ambitions
NVE offers a superior balance of profitability, liquidity, and shareholder returns, while SkyWater struggles with losses and liquidity risks. Investors seeking stable income and operational efficiency may prefer NVE’s profile, whereas SkyWater fits a speculative growth appetite with higher risk exposure.
Which one offers the Superior Shareholder Reward?
I compare SkyWater Technology, Inc. (SKYT) and NVE Corporation (NVEC) on dividend yield, payout ratio, and buybacks. SKYT pays no dividend and lacks buybacks, reflecting persistent losses and weak cash flow. NVEC yields 4.5–7.3%, with payout ratios above 100%, indicating aggressive dividend policies. NVEC’s robust free cash flow (3B+ per share) supports dividends and buybacks sustainably. SKYT’s absence of distributions aligns with reinvestment needs but limits near-term shareholder rewards. NVEC’s high dividend yield and strong buyback programs offer superior total returns and sustainable value in 2026. I favor NVEC for disciplined capital allocation and consistent shareholder rewards.
Comparative Score Analysis: The Strategic Profile
The radar chart reveals the fundamental DNA and trade-offs of SkyWater Technology, Inc. and NVE Corporation, highlighting their strategic strengths and vulnerabilities:
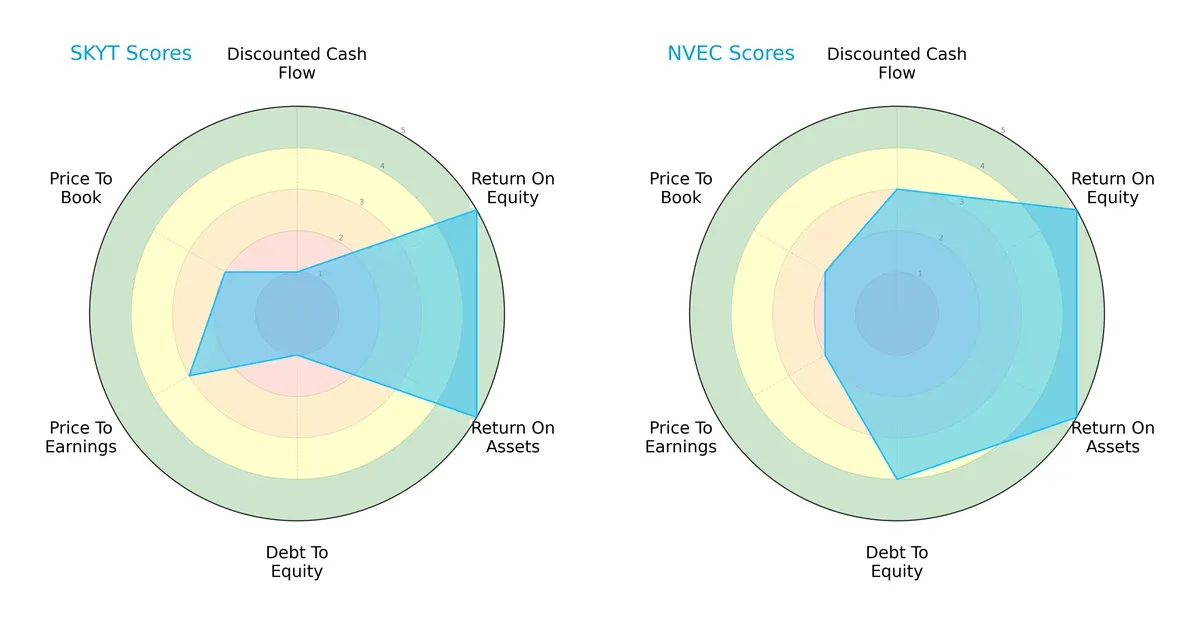
SkyWater exhibits strong profitability metrics with top scores in ROE and ROA but struggles with balance sheet risk, indicated by a very unfavorable debt-to-equity score and weak DCF. NVE Corporation presents a more balanced profile, combining solid profitability with a favorable debt position and moderate cash flow valuation. SkyWater’s edge lies in operational efficiency, while NVE delivers steadier financial stability.
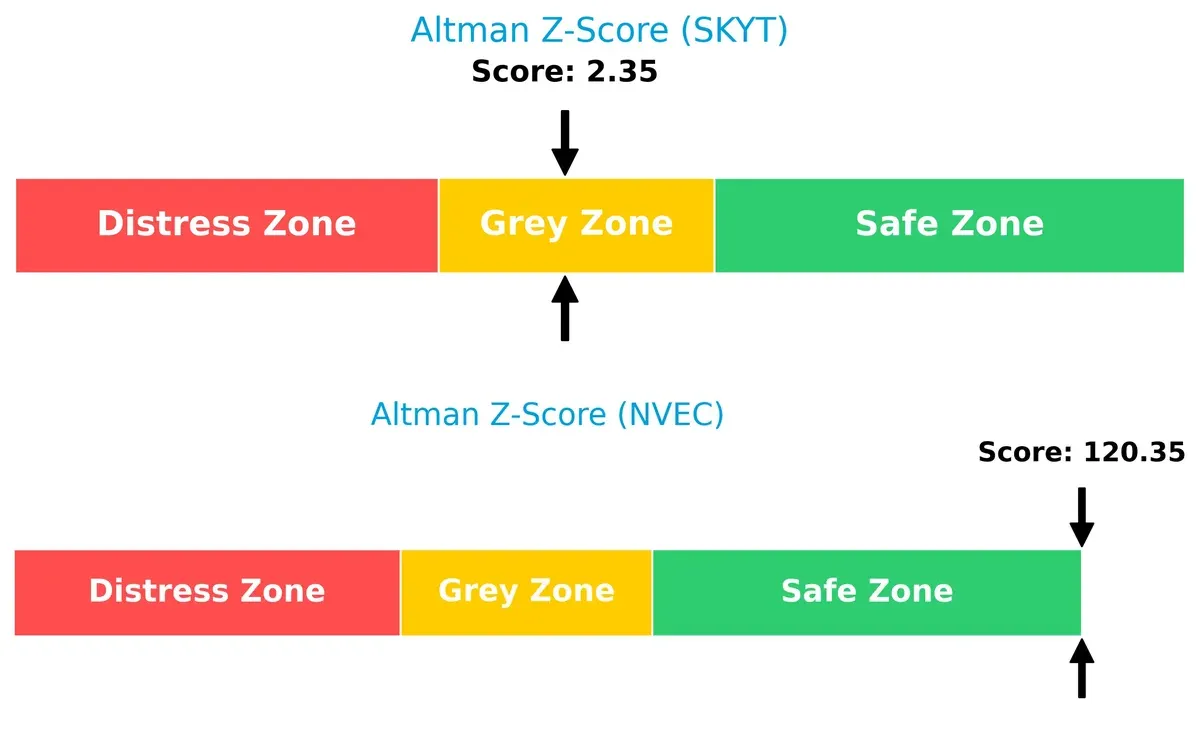
Bankruptcy Risk: Solvency Showdown
NVE’s Altman Z-Score of 120 firmly places it in the safe zone, signaling robust long-term survival prospects. SkyWater’s score of 2.35 sits in the grey zone, suggesting moderate bankruptcy risk requiring cautious monitoring:
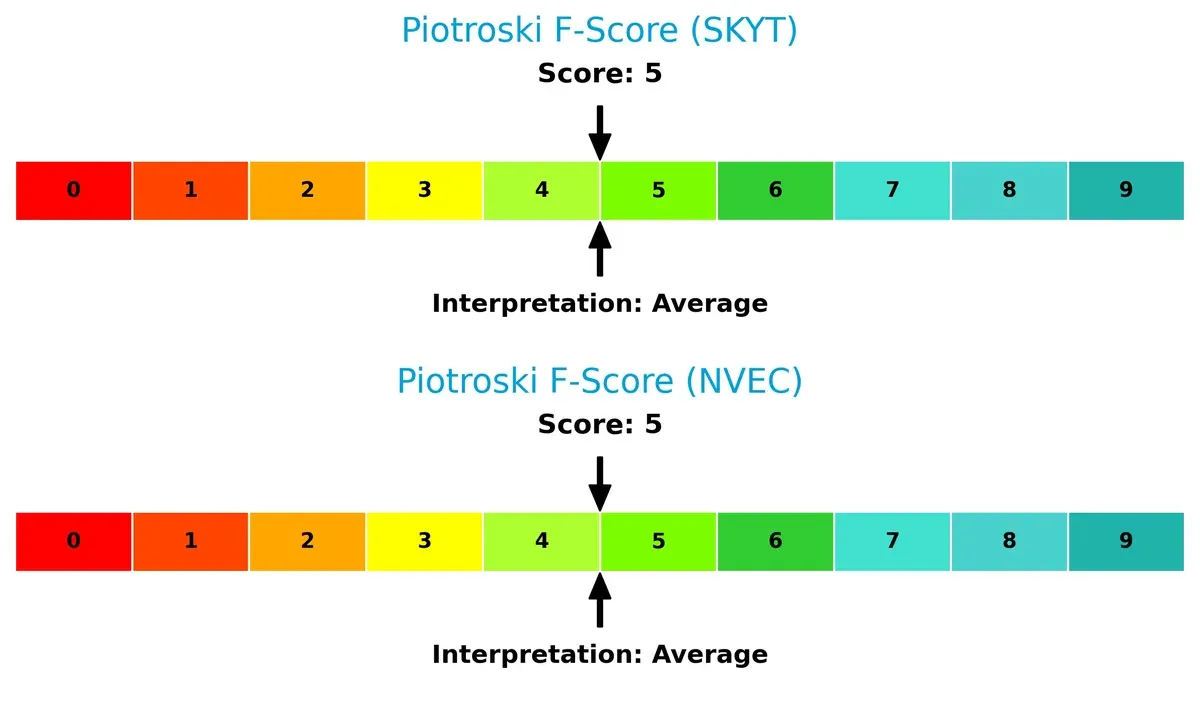
Financial Health: Quality of Operations
Both companies share an average Piotroski F-Score of 5, indicating moderate financial health. Neither firm shows immediate red flags, but neither stands out as exceptionally strong in operational quality:
How are the two companies positioned?
This section dissects the operational DNA of SKYT and NVEC by comparing their revenue distribution by segment and analyzing internal strengths and weaknesses. The goal is to confront their economic moats to identify which model offers the most resilient and sustainable competitive advantage today.
Revenue Segmentation: The Strategic Mix
This visual comparison dissects how SkyWater Technology, Inc. and NVE Corporation diversify their income streams and reveals where each firm places its primary sector bets:
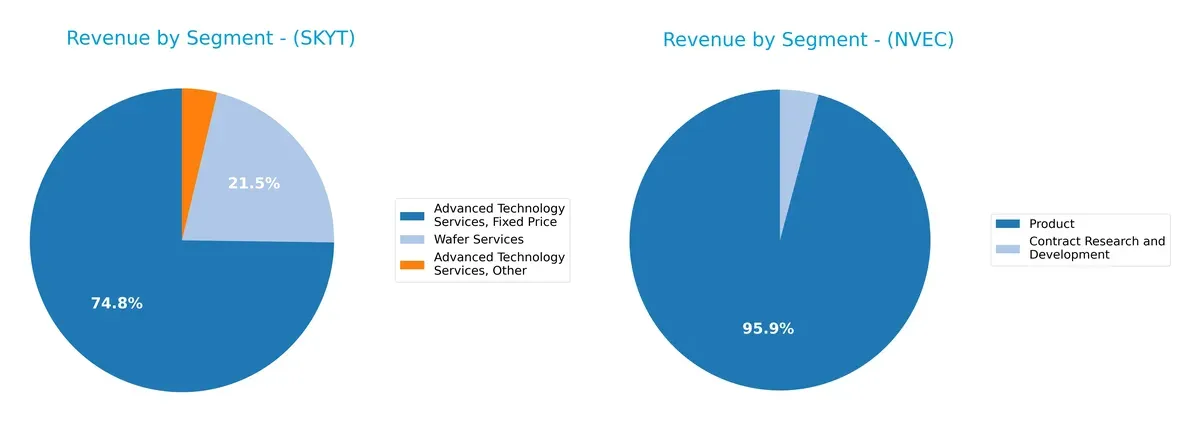
SkyWater Technology anchors most revenue in Advanced Technology Services, with $93M fixed price and $27M wafer services in 2024. Its multiple sub-segments hint at moderate diversification within tech services. Conversely, NVE Corporation pivots almost entirely on its Product segment, generating $26B in 2022 and minimal contract research revenue. SkyWater’s mix reduces concentration risk, while NVE’s reliance on one segment increases vulnerability but signals strong product dominance.
Strengths and Weaknesses Comparison
This table compares the Strengths and Weaknesses of SkyWater Technology, Inc. and NVE Corporation:
SKYT Strengths
- Diverse revenue from Advanced Technology and Wafer Services
- Strong asset turnover at 1.09 supports efficient use of assets
- Favorable low debt-to-assets ratio at 24.46%
NVEC Strengths
- High net margin of 58.22% reflects strong profitability
- ROE of 24.19% and ROIC of 21.14% indicate excellent capital efficiency
- Very low debt-to-equity at 0.01 and strong interest coverage
- Wide geographic presence including Asia Pacific and Europe
SKYT Weaknesses
- Negative net margin (-1.98%) and ROE (-11.79%) show profitability challenges
- Current and quick ratios below 1 signal liquidity risks
- High WACC at 19.95% indicates expensive capital
- Elevated debt-to-equity at 1.33 and weak interest coverage at 0.74
NVEC Weaknesses
- Current ratio extremely high at 28.4, may indicate inefficient working capital
- Asset turnover low at 0.4, suggesting less efficient asset use
- Price-to-book ratio unfavorable compared to sector norms
SkyWater struggles with profitability and liquidity despite asset efficiency. NVE boasts strong profitability and capital structure but shows inefficiencies in working capital and asset utilization. These contrasts shape each company’s strategic focus on financial stability versus operational efficiency.
The Moat Duel: Analyzing Competitive Defensibility
A structural moat is the only real shield that protects long-term profits from relentless competitive pressure and market disruption:
SkyWater Technology, Inc.: Emerging Engineering and Manufacturing Moat
SkyWater leans on proprietary semiconductor process development and manufacturing services. Its modest ROIC below WACC signals value destruction, but a sharply improving ROIC trend suggests growing operational efficiency. Expansion into aerospace and defense markets could deepen its moat if scale and innovation persist in 2026.
NVE Corporation: Spintronics Innovation with Sustainable Value Creation
NVE’s moat stems from its spintronic technology, a unique intangible asset difficult to replicate. It consistently earns ROIC well above WACC, proving efficient capital use and strong profitability. Despite recent revenue softness, its niche in industrial IoT and medical sensors offers room to extend its competitive lead.
Proprietary Technology vs. Engineering Scale: NVE’s Spintronics Moat Dominates
NVE possesses a wider and deeper moat than SkyWater, demonstrated by its strong ROIC premium and margin dominance. SkyWater’s improving metrics are encouraging but still fall short of sustainable value creation. NVE is better positioned to defend and expand its market share through technological uniqueness and capital efficiency.
Which stock offers better returns?
Over the past year, SkyWater Technology surged sharply, while NVE Corporation experienced a notable decline, reflecting divergent trading dynamics and market sentiment between the two stocks.
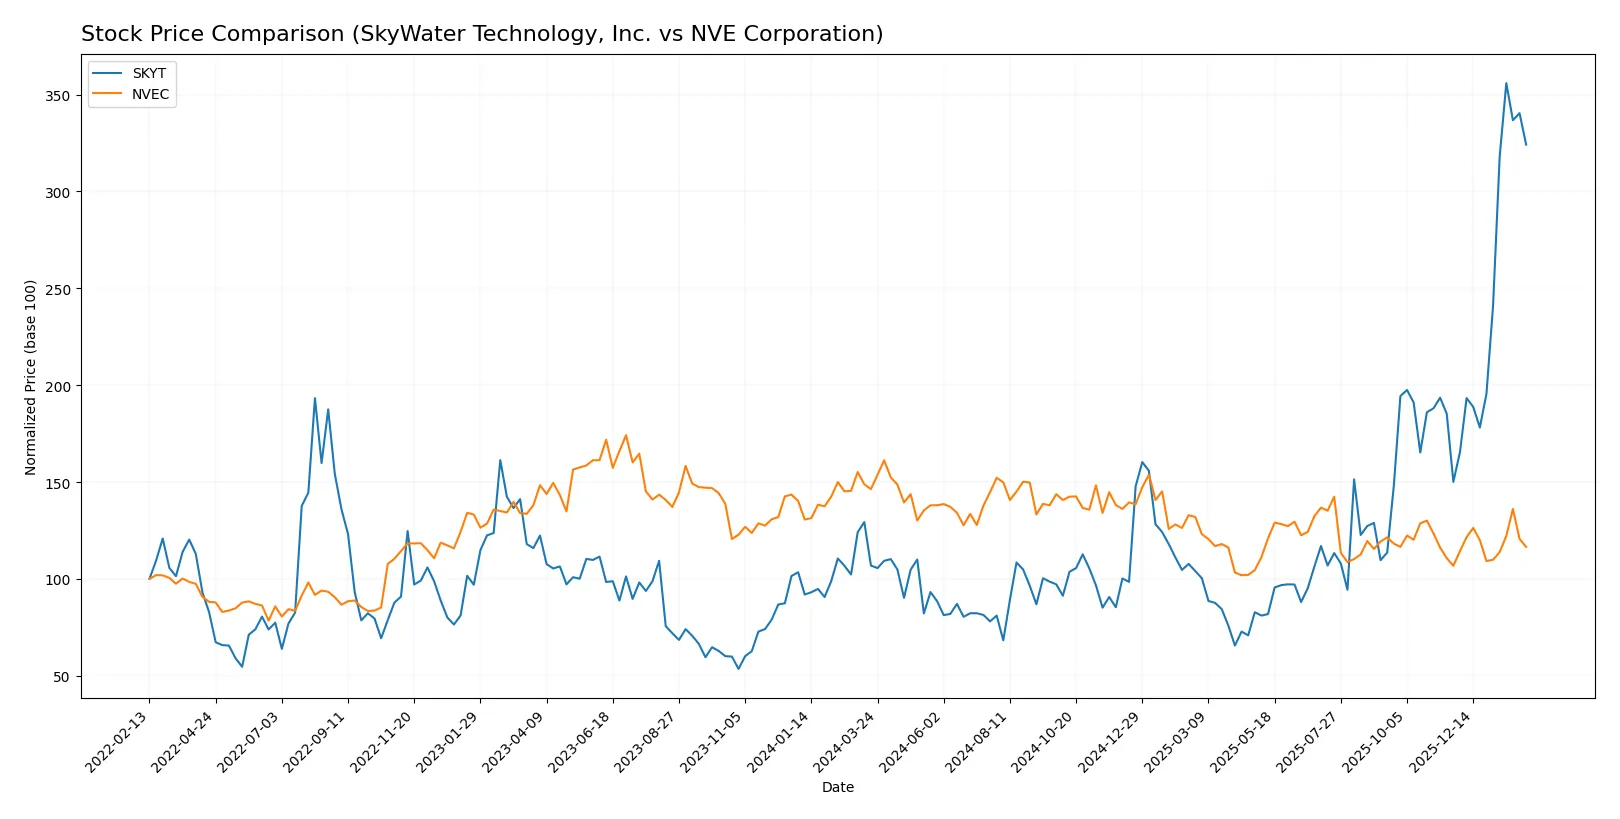
Trend Comparison
SkyWater Technology’s stock rose 203.32% over the past year, showing a strong bullish trend with accelerating momentum and a standard deviation of 5.61. It hit a high of 33.1 and a low of 6.1.
NVE Corporation’s stock fell 20.38% in the same period, marking a bearish trend despite acceleration. The stock’s volatility is slightly higher, with a 7.56 standard deviation, peaking at 90.18 and bottoming at 56.99.
SkyWater Technology outperformed NVE Corporation significantly, delivering the highest market returns and the strongest upward trend in the last 12 months.
Target Prices
Analysts set a clear target consensus for SkyWater Technology, Inc., reflecting confident expectations.
| Company | Target Low | Target High | Consensus |
|---|---|---|---|
| SkyWater Technology, Inc. | 35 | 35 | 35 |
SkyWater’s target price of $35 exceeds its current $30.15 stock price, suggesting upside potential. No verified target price data is available for NVE Corporation.

Don’t Let Luck Decide Your Entry Point
Optimize your entry points with our advanced ProRealTime indicators. You’ll get efficient buy signals with precise price targets for maximum performance. Start outperforming now!
How do institutions grade them?
Here is a summary of the latest institutional grades for SkyWater Technology, Inc. and NVE Corporation:
SkyWater Technology, Inc. Grades
The following table shows recent rating changes from established grading firms for SkyWater Technology, Inc.:
| Grading Company | Action | New Grade | Date |
|---|---|---|---|
| TD Cowen | Downgrade | Hold | 2026-01-27 |
| Piper Sandler | Downgrade | Neutral | 2026-01-27 |
| Needham | Downgrade | Hold | 2026-01-27 |
| TD Cowen | Maintain | Buy | 2025-11-06 |
| Needham | Maintain | Buy | 2025-11-06 |
| Piper Sandler | Maintain | Overweight | 2025-11-06 |
| Needham | Maintain | Buy | 2025-08-07 |
| Needham | Maintain | Buy | 2025-05-08 |
| Needham | Maintain | Buy | 2025-02-27 |
| Needham | Maintain | Buy | 2024-11-11 |
NVE Corporation Grades
No reliable institutional grades are available for NVE Corporation.
Which company has the best grades?
SkyWater Technology, Inc. has received multiple recent downgrades from reputable firms, shifting from Buy and Overweight ratings to Hold and Neutral. NVE Corporation lacks any institutional grade data, making direct comparison impossible. Investors may interpret SkyWater’s downgrades as caution signals regarding near-term prospects.
Risks specific to each company
The following categories identify critical pressure points and systemic threats facing SkyWater Technology, Inc. and NVE Corporation in the 2026 market environment:
1. Market & Competition
SkyWater Technology, Inc.
- Faces intense competition in semiconductor manufacturing with pressure on margins and innovation cycles.
NVE Corporation
- Operates in a niche spintronics market, less crowded but dependent on specialized tech adoption.
2. Capital Structure & Debt
SkyWater Technology, Inc.
- High debt-to-equity ratio (1.33) and weak interest coverage (0.74) indicate leverage risk and refinancing challenges.
NVE Corporation
- Very low debt (D/E 0.01) and strong interest coverage reduce financial risk substantially.
3. Stock Volatility
SkyWater Technology, Inc.
- Beta of 3.51 signals extreme stock price volatility, increasing investment risk.
NVE Corporation
- Beta of 1.22 shows moderate volatility, closer to market average, offering steadier price movements.
4. Regulatory & Legal
SkyWater Technology, Inc.
- Subject to semiconductor industry regulations and export controls impacting defense and aerospace sectors.
NVE Corporation
- Faces regulatory scrutiny on nanotech and medical device approvals but with less exposure to export restrictions.
5. Supply Chain & Operations
SkyWater Technology, Inc.
- Complex manufacturing processes with global supply chain risks could disrupt production and increase costs.
NVE Corporation
- Smaller scale operations reduce supply chain complexity but may face scaling challenges.
6. ESG & Climate Transition
SkyWater Technology, Inc.
- Heavy energy use in manufacturing raises climate transition risks and potential regulatory costs.
NVE Corporation
- Focus on energy-efficient spintronic devices aligns well with long-term ESG trends.
7. Geopolitical Exposure
SkyWater Technology, Inc.
- Exposure to geopolitical tensions affecting semiconductor supply chains, especially US-China trade conflicts.
NVE Corporation
- Limited international footprint reduces direct geopolitical risks but limits market expansion.
Which company shows a better risk-adjusted profile?
SkyWater’s most impactful risk is its weak capital structure combined with extreme stock volatility, heightening financial and market risks. NVE’s key risk lies in its niche market dependency, which could constrain growth if technology adoption stalls. Overall, NVE exhibits a stronger risk-adjusted profile, backed by superior financial stability and lower leverage. Its Altman Z-Score in the safe zone and moderate volatility contrast sharply with SkyWater’s grey zone distress signals and high beta, justifying cautious optimism for NVE investors.
Final Verdict: Which stock to choose?
SkyWater Technology’s superpower lies in its accelerating growth trajectory and improving profitability metrics. However, its strained liquidity and negative returns on equity serve as a point of vigilance. It could fit well in an aggressive growth portfolio that tolerates operational risks for potential upside.
NVE Corporation boasts a robust strategic moat with a strong return on invested capital consistently exceeding its cost of capital. Its exceptional financial stability and cash flow generation offer a safer profile compared to SkyWater. This makes it more suitable for a GARP (Growth at a Reasonable Price) portfolio focused on steady value creation.
If you prioritize high-growth momentum and can withstand balance sheet vulnerabilities, SkyWater might be the compelling choice due to its improving profitability and market enthusiasm. However, if you seek better stability and a proven economic moat, NVE offers superior capital efficiency and financial resilience, commanding a premium for lower risk.
Disclaimer: Investment carries a risk of loss of initial capital. The past performance is not a reliable indicator of future results. Be sure to understand risks before making an investment decision.
Go Further
I encourage you to read the complete analyses of SkyWater Technology, Inc. and NVE Corporation to enhance your investment decisions: