Home > Comparison > Technology > SLAB vs NVEC
The strategic rivalry between Silicon Laboratories Inc. and NVE Corporation shapes innovation in the semiconductor sector. Silicon Labs operates as a fabless semiconductor powerhouse with broad mixed-signal solutions for IoT applications. In contrast, NVE Corporation focuses on niche spintronic sensor technologies with a lean operational model. This analysis will assess which company’s distinct approach provides superior risk-adjusted returns for a diversified technology portfolio.
Table of contents
Companies Overview
Silicon Laboratories Inc. and NVE Corporation both hold critical roles in the semiconductor industry, shaping advanced technology markets.
Silicon Laboratories Inc.: Analog-Intensive Mixed-Signal Leader
Silicon Laboratories Inc. stands as a fabless semiconductor innovator specializing in analog-intensive mixed-signal solutions. Its revenue engine relies heavily on wireless microcontrollers and sensor products tailored for the expanding Internet of Things (IoT) market. In 2026, the company emphasizes broadening its presence in smart home, industrial automation, and medical instrumentation sectors, leveraging its diverse product portfolio.
NVE Corporation: Spintronics Pioneer
NVE Corporation positions itself as a specialist in spintronic nanotechnology, designing sensors and couplers that exploit electron spin for data acquisition and transmission. Its core revenue derives from factory automation sensors and custom medical devices. The 2026 strategy centers on expanding industrial IoT applications and advancing spintronic memory technology through research and licensing efforts.
Strategic Collision: Similarities & Divergences
Both companies compete in semiconductor innovation but diverge sharply in technology focus: Silicon Labs pursues a broad IoT ecosystem with analog mixed-signal products, while NVE bets on niche spintronics applications. Their primary battleground lies in industrial automation and IoT sensor markets. Silicon Labs offers scale and product diversity; NVE presents a specialized, research-driven profile with a smaller footprint and focused niche expertise.
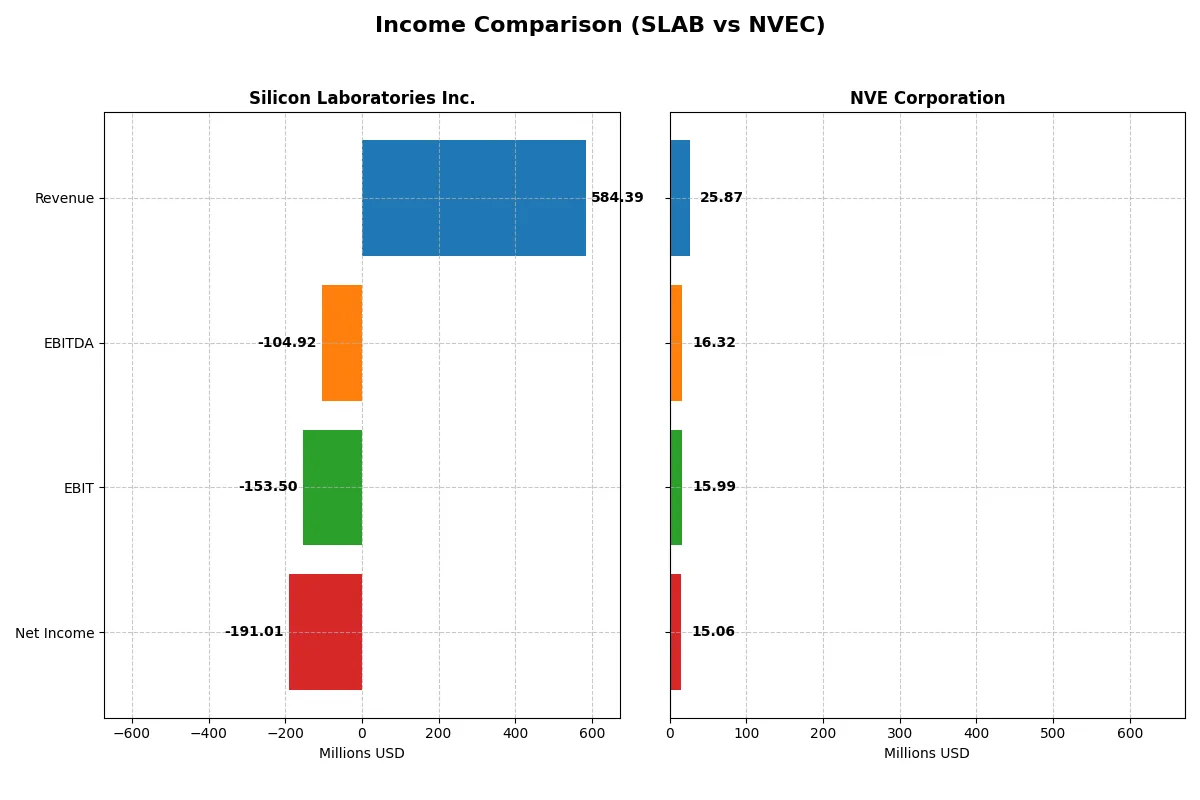
Income Statement Comparison
This data dissects the core profitability and scalability of both corporate engines to reveal who dominates the bottom line:
| Metric | Silicon Laboratories Inc. (SLAB) | NVE Corporation (NVEC) |
|---|---|---|
| Revenue | 584M | 26M |
| Cost of Revenue | 272M | 4.2M |
| Operating Expenses | 478M | 5.6M |
| Gross Profit | 312M | 22M |
| EBITDA | -105M | 16M |
| EBIT | -154M | 16M |
| Interest Expense | 1.3M | 0 |
| Net Income | -191M | 15M |
| EPS | -5.93 | 3.12 |
| Fiscal Year | 2024 | 2025 |
Income Statement Analysis: The Bottom-Line Duel
This income statement comparison reveals which company runs a more efficient and profitable corporate engine over recent years.
Silicon Laboratories Inc. Analysis
Silicon Laboratories’ revenue peaked at 1.02B in 2022 but slid to 584M by 2024, reflecting a 25% decline last year. Despite a strong gross margin above 53%, net income plunged deeply negative in 2023 and 2024, eroding net margins to -33%. The widening operating losses and unfavorable EBIT margin highlight deteriorating operational efficiency and shrinking profitability momentum.
NVE Corporation Analysis
NVE Corporation’s revenue grew from 21.4M in 2021 to 38.3M in 2023 before a slight dip to 25.9M in 2025. It maintains a robust gross margin above 83%, with net margins soaring over 58% in 2025. EBIT remains healthy above 60%, underpinning consistent profitability. Despite a minor revenue contraction last year, NVE sustains strong earnings growth and operational discipline over the long term.
Margin Strength vs. Revenue Volatility
NVE leads clearly with superior margins and steady profitability, reflecting a well-managed cost structure and strong capital allocation. Silicon Labs faces significant earnings headwinds, with shrinking revenue and mounting losses signaling operational challenges. For investors prioritizing resilient profitability, NVE’s profile offers greater confidence amid sector cyclicality.
Financial Ratios Comparison
These vital ratios act as a diagnostic tool to expose the underlying fiscal health, valuation premiums, and capital efficiency of the companies compared below:
| Ratios | Silicon Laboratories Inc. (SLAB) | NVE Corporation (NVEC) |
|---|---|---|
| ROE | -17.7% | 24.2% |
| ROIC | -14.7% | 21.1% |
| P/E | -21.5 | 20.5 |
| P/B | 3.81 | 4.95 |
| Current Ratio | 6.15 | 28.40 |
| Quick Ratio | 5.07 | 22.03 |
| D/E (Debt to Equity) | 0.014 | 0.015 |
| Debt-to-Assets | 1.27% | 1.43% |
| Interest Coverage | -126.3 | 0 |
| Asset Turnover | 0.48 | 0.40 |
| Fixed Asset Turnover | 4.42 | 8.91 |
| Payout ratio | 0 | 128% |
| Dividend yield | 0% | 6.28% |
| Fiscal Year | 2024 | 2025 |
Efficiency & Valuation Duel: The Vital Signs
Financial ratios act as a company’s DNA, exposing hidden risks and operational strengths critical to investment decisions.
Silicon Laboratories Inc.
Silicon Laboratories shows weak profitability with a negative ROE of -17.7% and a net margin of -32.7%, signaling operational struggles. Its valuation appears attractive with a favorable negative P/E, but a high P/B at 3.81 suggests some overvaluation. The company returns no dividend, instead heavily reinvesting in R&D, aiming for long-term growth despite current losses.
NVE Corporation
NVE delivers strong profitability, posting a 24.2% ROE and a robust 58.2% net margin, reflecting operational efficiency. Its P/E of 20.5 is neutral, indicating fair market pricing, though a P/B of 4.95 flags some valuation premium. NVE supports shareholders with a 6.3% dividend yield, balancing income with sustained growth investments.
Profitability and Valuation: Growth vs. Recovery
NVE offers a superior blend of profitability and shareholder returns, backed by favorable ratios and consistent dividends. Silicon Laboratories trades at a discount but faces significant profitability challenges and reinvests heavily. Investors seeking growth and income may prefer NVE, while those favoring turnaround potential might consider Silicon Laboratories.
Which one offers the Superior Shareholder Reward?
Silicon Laboratories (SLAB) pays no dividends and delivers negative free cash flow (-$0.8/share in 2024). It lacks buybacks, signaling reinvestment in R&D amid losses. NVE Corporation (NVEC) yields a healthy 4.5%-6.3% dividend with a payout ratio near 100%. NVEC also buys back shares consistently, boosting total returns. NVEC’s robust operating margins (~62%) and free cash flow ($2.7/share) fund distributions sustainably. SLAB’s heavy reinvestment carries execution risk, while NVEC’s cash returns align with shareholder value norms. I conclude NVEC offers the more attractive, sustainable total return profile for 2026 investors.
Comparative Score Analysis: The Strategic Profile
The radar chart reveals the fundamental DNA and trade-offs of Silicon Laboratories Inc. and NVE Corporation, highlighting their core financial strengths and vulnerabilities:
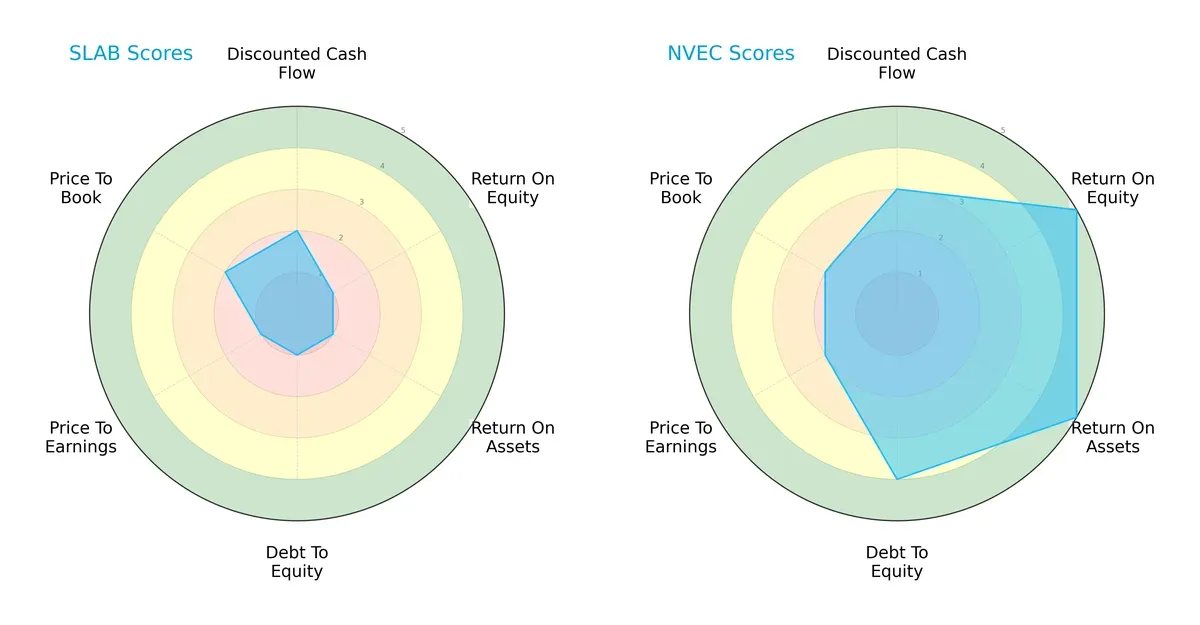
NVE Corporation displays a more balanced and robust profile, excelling in ROE (5 vs. 1) and ROA (5 vs. 1), signaling superior profitability and asset efficiency. Silicon Laboratories leans on a moderate DCF score (2 vs. 3) but suffers across leverage (debt/equity 1 vs. 4) and valuation metrics (PE 1 vs. 2, PB 2 vs. 2). This suggests NVEC’s capital allocation and financial discipline outpace SLAB’s, making NVEC the stronger, more stable investment in this sector cycle.
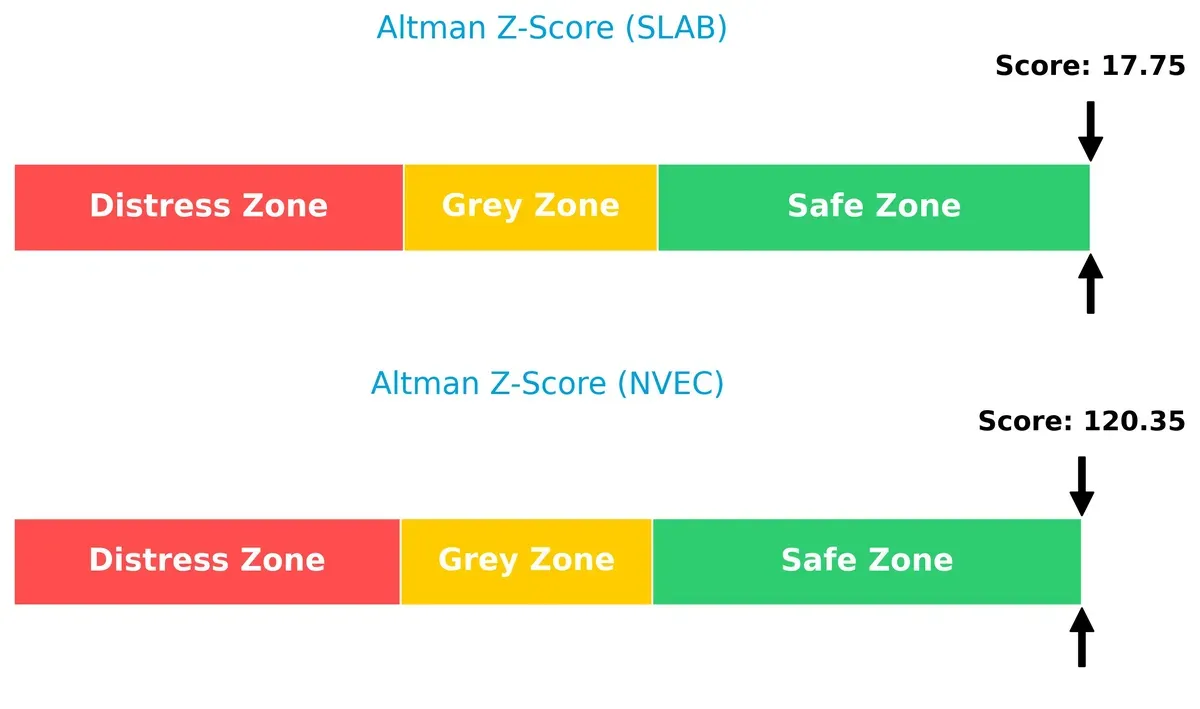
Bankruptcy Risk: Solvency Showdown
Silicon Laboratories and NVE Corporation both reside comfortably in the safe zone by Altman Z-Score standards, but NVEC’s score (120.4) dramatically surpasses SLAB’s (17.8), underscoring its superior long-term solvency and financial resilience:
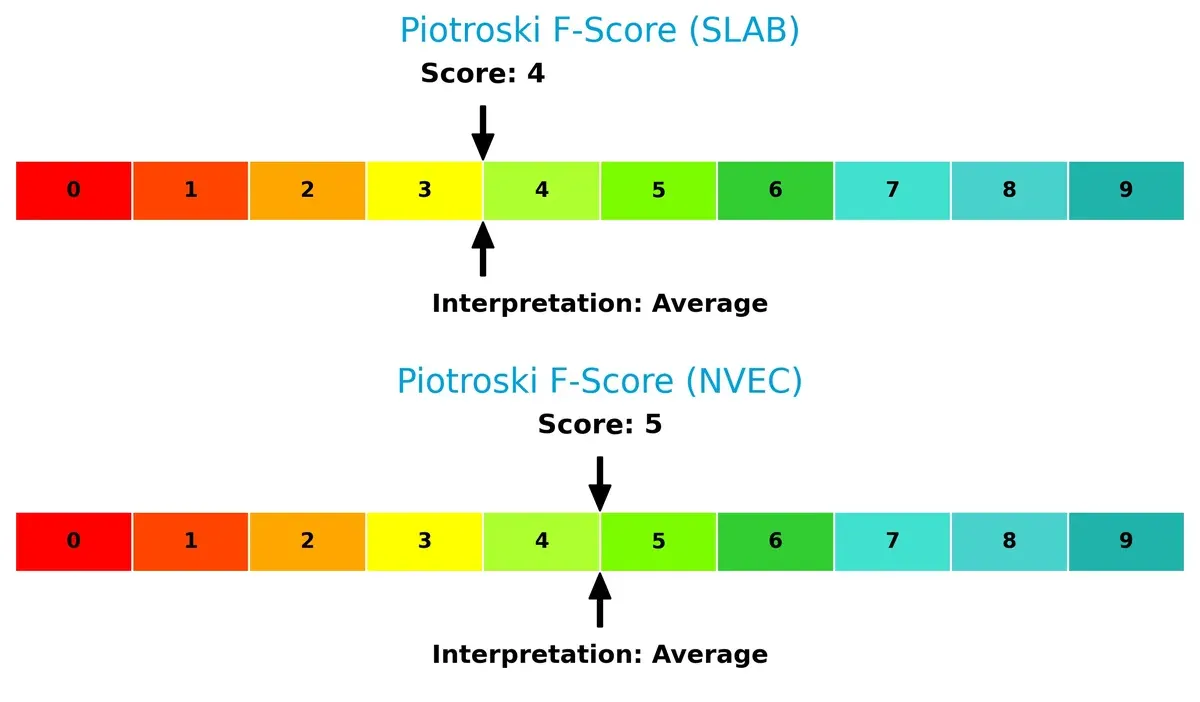
Financial Health: Quality of Operations
Both firms show average Piotroski F-Scores, with NVE Corporation slightly ahead at 5 versus Silicon Laboratories’ 4. Neither signals peak financial health, but SLAB’s lower score hints at modest internal weaknesses compared to NVEC’s marginally stronger operational quality:
How are the two companies positioned?
This section dissects the operational DNA of Silicon Laboratories and NVE by comparing their revenue distribution and internal strengths and weaknesses. The final goal is to confront their economic moats to reveal which model delivers the most resilient, sustainable advantage today.
Revenue Segmentation: The Strategic Mix
This comparison dissects how Silicon Laboratories and NVE Corporation diversify income streams and reveals where their primary sector bets lie:
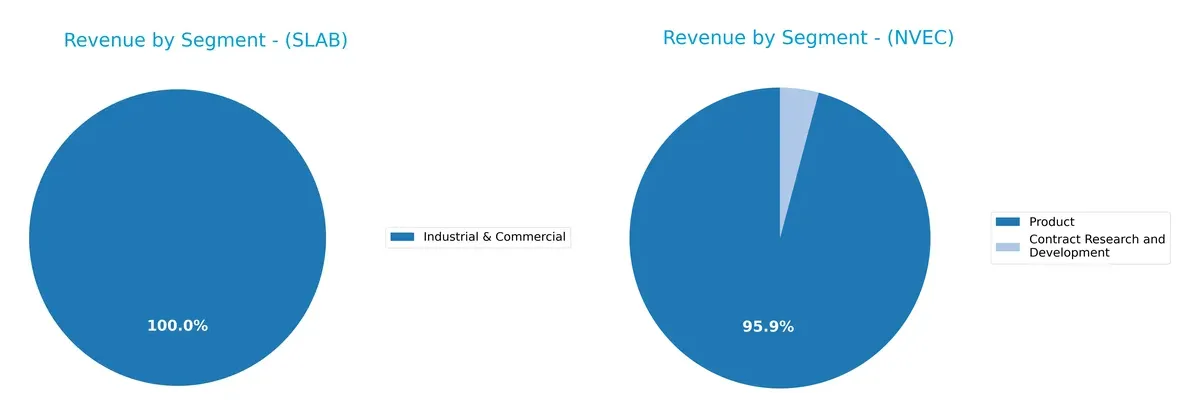
Silicon Laboratories anchors its latest revenue largely in Industrial & Commercial at $497M (2023), showing a shift from prior years’ diverse mix including Infrastructure and IoT. NVE Corporation’s revenue pivots around Product sales roughly $26M (2022), dwarfs its Contract R&D under $1.2M. Silicon Labs’ narrowing focus signals concentration risk but potential operational scaling, while NVE’s stable product dominance reflects a clear, specialized moat.
Strengths and Weaknesses Comparison
This table compares the Strengths and Weaknesses of Silicon Laboratories Inc. and NVE Corporation:
Silicon Laboratories Inc. Strengths
- Low debt-to-equity at 0.01
- Favorable quick ratio at 5.07
- High fixed asset turnover at 4.42
NVE Corporation Strengths
- Strong net margin at 58.22%
- High ROE at 24.19%
- Favorable interest coverage
- Low debt-to-equity at 0.01
- High fixed asset turnover at 8.91
Silicon Laboratories Inc. Weaknesses
- Negative net margin at -32.69%
- Negative ROE and ROIC
- Unfavorable interest coverage at -117.18
- High current ratio at 6.15
- Unfavorable PB at 3.81
NVE Corporation Weaknesses
- High current ratio at 28.4
- Unfavorable PB at 4.95
- Moderate asset turnover at 0.4
- Dividend yield neutral at 6.28%
Overall, Silicon Laboratories shows financial strain with negative profitability metrics but maintains conservative leverage and asset efficiency. NVE Corporation demonstrates robust profitability and strong capital structure but faces concerns from elevated liquidity ratios and valuation multiples. These factors will influence their strategic flexibility and risk profiles.
The Moat Duel: Analyzing Competitive Defensibility
A structural moat is the only true barrier protecting long-term profits from relentless competition erosion. Let’s dissect how two semiconductor firms defend their turf:
Silicon Laboratories Inc.: Intangible Assets Moat
Silicon Labs relies on proprietary analog and mixed-signal technology, reflected in solid gross margins (53%). However, declining ROIC and negative EBIT margins signal weakening moat strength in 2026.
NVE Corporation: Specialized Technology Moat
NVE’s spintronics-based products create a unique technology moat, driving superior ROIC well above WACC and robust net margins (58%). Growth in niche markets suggests deepening competitive advantage.
Tech Innovation vs. Sustainable Profitability
NVE holds a wider and deeper moat with expanding returns and clear value creation. Silicon Labs’ declining profitability weakens its defense, leaving NVE better positioned to protect market share.
Which stock offers better returns?
Over the past 12 months, Silicon Laboratories Inc. surged sharply, while NVE Corporation faced a notable decline before showing recent modest recovery.
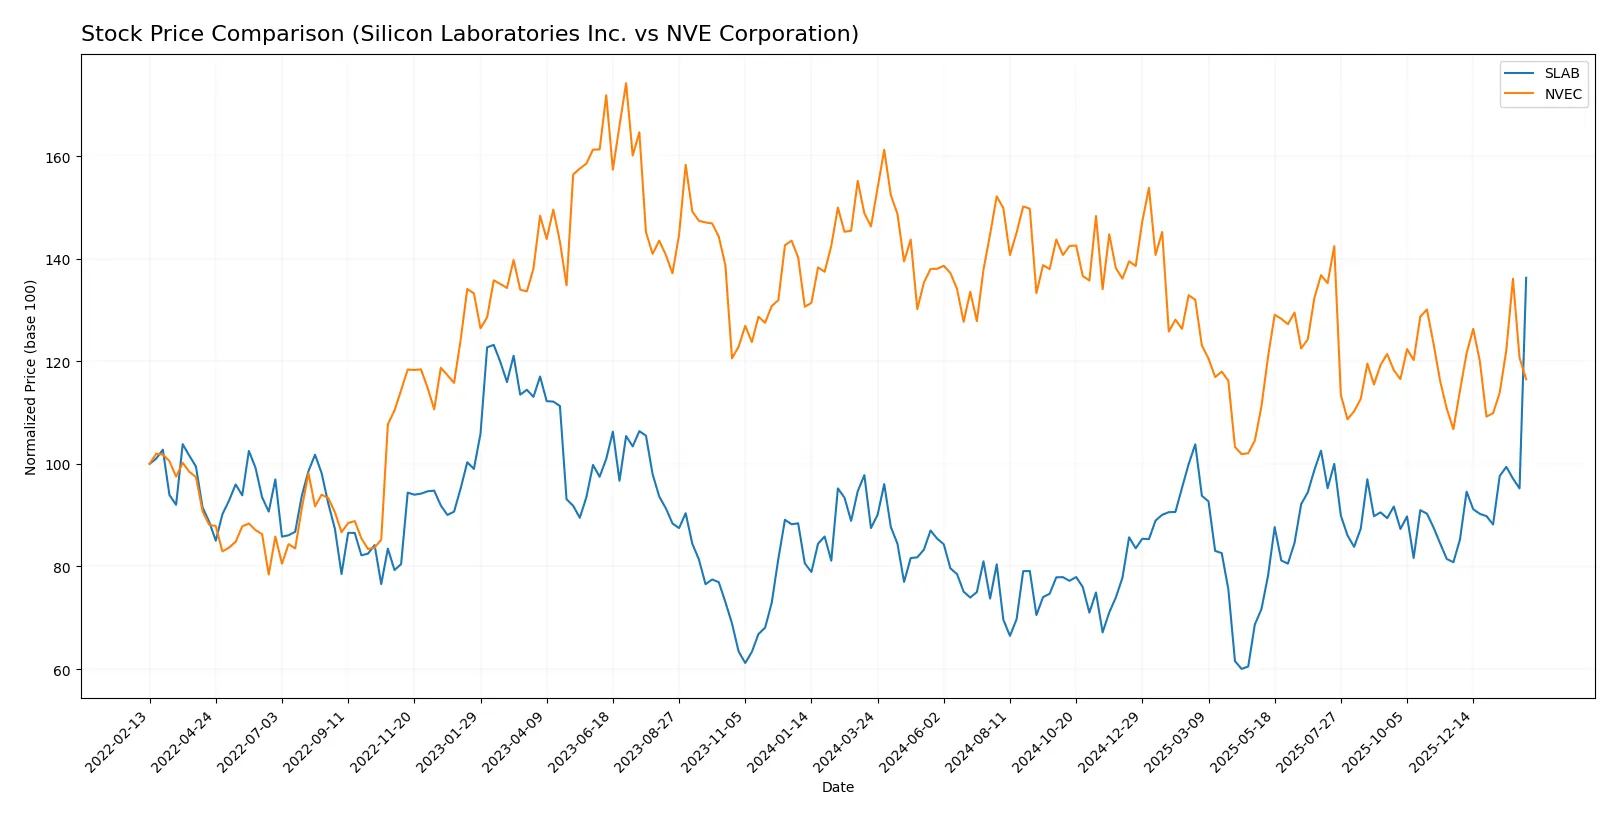
Trend Comparison
Silicon Laboratories Inc. shows a strong bullish trend with a 55.75% price increase over the past year and accelerating momentum. Volatility is high, with a 16.08 standard deviation, and prices ranged between 89.82 and 203.88.
NVE Corporation exhibits a bearish trend with a 20.38% decline over the same period, though recent months show a 9.12% rebound. The trend accelerates modestly, with lower volatility at 7.56 standard deviation.
Comparing both, Silicon Laboratories Inc. clearly outperforms NVE Corporation, delivering the highest market return and stronger upward momentum over the last year.
Target Prices
Analysts provide a clear target consensus for Silicon Laboratories Inc., guiding investor expectations.
| Company | Target Low | Target High | Consensus |
|---|---|---|---|
| Silicon Laboratories Inc. | 130 | 165 | 151.67 |
The consensus target for Silicon Laboratories at $151.67 contrasts sharply with its current $203.21 price, implying potential downside risk. No verified target price data is available for NVE Corporation, limiting guidance on its valuation.

Don’t Let Luck Decide Your Entry Point
Optimize your entry points with our advanced ProRealTime indicators. You’ll get efficient buy signals with precise price targets for maximum performance. Start outperforming now!
How do institutions grade them?
The institutional grades for Silicon Laboratories Inc. and NVE Corporation are as follows:
Silicon Laboratories Inc. Grades
The table below summarizes recent grades from major financial institutions for Silicon Laboratories Inc.:
| Grading Company | Action | New Grade | Date |
|---|---|---|---|
| Morgan Stanley | Maintain | Equal Weight | 2025-08-06 |
| Susquehanna | Maintain | Neutral | 2025-08-06 |
| Barclays | Maintain | Equal Weight | 2025-08-05 |
| Susquehanna | Maintain | Neutral | 2025-07-22 |
| Stifel | Maintain | Buy | 2025-07-18 |
| Keybanc | Maintain | Overweight | 2025-07-08 |
| Benchmark | Maintain | Buy | 2025-05-27 |
| Benchmark | Maintain | Buy | 2025-05-14 |
| Needham | Maintain | Buy | 2025-05-14 |
| Susquehanna | Maintain | Neutral | 2025-05-14 |
NVE Corporation Grades
No reliable institutional grades are available for NVE Corporation.
Which company has the best grades?
Silicon Laboratories Inc. has received a mix of Buy, Overweight, Neutral, and Equal Weight grades, reflecting moderate institutional confidence. NVE Corporation lacks institutional grades, which may limit investor insights into its outlook.
Risks specific to each company
The following categories identify critical pressure points and systemic threats facing Silicon Laboratories Inc. and NVE Corporation in the 2026 market environment:
1. Market & Competition
Silicon Laboratories Inc.
- Faces intense competition in analog and mixed-signal semiconductors amid rapid IoT expansion.
NVE Corporation
- Operates in a niche spintronics market, limiting direct competitors but dependent on industrial automation demand.
2. Capital Structure & Debt
Silicon Laboratories Inc.
- Extremely low debt with a debt-to-assets ratio of 1.27%, signaling strong financial stability.
NVE Corporation
- Also maintains low leverage with a 1.43% debt-to-assets ratio, supporting conservative financial risk.
3. Stock Volatility
Silicon Laboratories Inc.
- Exhibits high beta (1.54), indicating significant sensitivity to market swings.
NVE Corporation
- Lower beta (1.22) suggests more moderate volatility relative to the tech sector.
4. Regulatory & Legal
Silicon Laboratories Inc.
- Exposure to US-China trade tensions may affect supply chains and sales in key markets.
NVE Corporation
- Faces fewer regulatory pressures due to smaller scale but must comply with evolving IoT and industrial standards.
5. Supply Chain & Operations
Silicon Laboratories Inc.
- Relies on global foundries vulnerable to chip shortages and geopolitical disruptions.
NVE Corporation
- Smaller scale allows more agile operations, but supply risks exist for specialized spintronic components.
6. ESG & Climate Transition
Silicon Laboratories Inc.
- Increasing pressure to improve ESG metrics amid rising investor demands in semiconductors.
NVE Corporation
- ESG efforts limited by scale but must address environmental impacts of nanotechnology manufacturing.
7. Geopolitical Exposure
Silicon Laboratories Inc.
- High exposure to US-China tensions, impacting supply and market access.
NVE Corporation
- Less direct geopolitical risk but sensitive to global industrial trade dynamics.
Which company shows a better risk-adjusted profile?
NVE Corporation presents a stronger risk-adjusted profile than Silicon Laboratories Inc. Silicon Labs’ key risk is its unfavorable profitability and operational efficiency metrics, despite robust liquidity and low debt. NVE’s main risk lies in its niche market dependency, but it boasts superior profitability, return metrics, and financial health. The stark contrast in net margin—negative 33% for Silicon Labs versus positive 58% for NVE—justifies concern over Silicon Labs’ ability to generate sustainable profits in a volatile sector.
Final Verdict: Which stock to choose?
Silicon Laboratories Inc. (SLAB) impresses with its deep investment in R&D, positioning it as a potential innovation leader. However, its persistent value destruction and declining profitability require close monitoring. SLAB might appeal to aggressive growth portfolios willing to tolerate volatility for a breakthrough.
NVE Corporation (NVEC) offers a robust strategic moat through sustained high returns on invested capital and strong income quality. Its conservative balance sheet and consistent value creation provide a safety cushion absent in SLAB. NVEC suits investors favoring growth at a reasonable price with a preference for stability.
If you prioritize innovation-driven upside and can handle financial headwinds, SLAB presents a compelling scenario despite its challenges. However, if you seek durable profitability and superior capital efficiency, NVEC outshines as the better choice for stable, value-oriented growth. Each fits distinct investor profiles shaped by risk tolerance and return expectations.
Disclaimer: Investment carries a risk of loss of initial capital. The past performance is not a reliable indicator of future results. Be sure to understand risks before making an investment decision.
Go Further
I encourage you to read the complete analyses of Silicon Laboratories Inc. and NVE Corporation to enhance your investment decisions: