Home > Comparison > Technology > Q vs NVEC
The strategic rivalry between Qnity Electronics, Inc. and NVE Corporation shapes the semiconductor industry’s evolution. Qnity operates as a capital-intensive provider of electronic solutions and materials for chip manufacturing. In contrast, NVE focuses on spintronic sensor innovation within nanotechnology, targeting industrial IoT and medical applications. This analysis pits Qnity’s scale against NVE’s specialized tech, aiming to identify which trajectory delivers superior risk-adjusted returns for a diversified portfolio.
Table of contents
Companies Overview
Qnity Electronics and NVE Corporation stand as key players in the semiconductor sector with distinct market positions and technologies.
Qnity Electronics, Inc.: Advanced Semiconductor Materials Provider
Qnity Electronics dominates semiconductor materials by supplying electronic solutions crucial for chip manufacturing. Its revenue hinges on advanced materials that enable next-gen chip production. In 2026, Qnity focuses strategically on scaling high-purity material output to capitalize on growing semiconductor demand worldwide.
NVE Corporation: Spintronics Innovator
NVE Corporation specializes in spintronic devices, leveraging electron spin for data acquisition and transmission. It generates revenue through custom sensors and couplers for factory automation and medical devices. The company’s 2026 strategic emphasis lies on expanding its footprint in the industrial Internet of Things market with cutting-edge spintronic technology.
Strategic Collision: Similarities & Divergences
Qnity pursues a materials-centric approach while NVE bets on proprietary spintronics hardware. Their primary battleground is semiconductor innovation, yet Qnity targets chip fabricators, and NVE focuses on niche sensor applications. This divergence crafts distinct investment profiles: Qnity appeals as a scalable materials supplier, NVE as a specialized tech innovator with high beta risk.
Income Statement Comparison
This data dissects the core profitability and scalability of both corporate engines to reveal who dominates the bottom line:
| Metric | Qnity Electronics, Inc. (Q) | NVE Corporation (NVEC) |
|---|---|---|
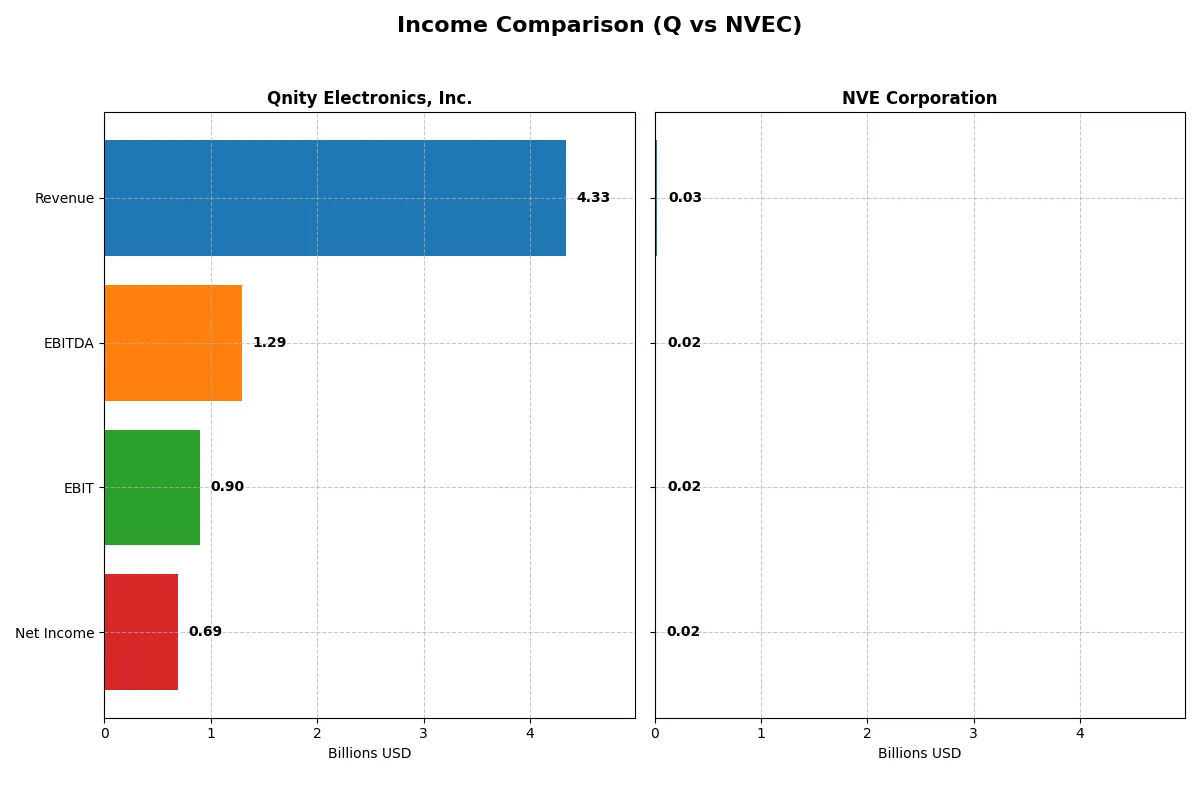
| Revenue | 4.34B | 25.87M |
| Cost of Revenue | 2.34B | 4.24M |
| Operating Expenses | 1.16B | 5.64M |
| Gross Profit | 2.00B | 21.64M |
| EBITDA | 1.29B | 16.32M |
| EBIT | 898M | 15.99M |
| Interest Expense | 280M | 0 |
| Net Income | 693M | 15.06M |
| EPS | 3.31 | 3.12 |
| Fiscal Year | 2024 | 2025 |
Income Statement Analysis: The Bottom-Line Duel
This income statement comparison reveals which company converts sales into profits most efficiently, spotlighting operational strength and margin discipline.
Qnity Electronics, Inc. Analysis
Qnity’s revenue dipped from 4.76B in 2022 to 4.33B in 2024, showing an 8.8% decline overall. Net income followed suit, falling 10.5% to 693M in 2024. Despite revenue pressure, Qnity sustains a healthy gross margin of 46.1% and a solid net margin near 16%. Recent growth in EBIT and net margin signals improving operational momentum.
NVE Corporation Analysis
NVE’s revenue grew 21.1% over the 2021-2025 period but declined 13.2% in the last year to 25.9M. Net income rose 28.8% overall, reaching 15.1M in 2025, despite a 12% dip in the most recent year. Exceptionally high margins—83.6% gross and 58.2% net—highlight outstanding cost control and profitability. The company’s margin expansion offsets recent revenue softness.
Margin Dominance vs. Scale Resilience
NVE commands superior margins, delivering far higher profitability ratios than Qnity, but with much smaller absolute scale. Qnity’s larger revenue base faces growth challenges, though its recent margin improvements suggest operational recovery. For investors, NVE’s high-margin profile offers compelling efficiency, while Qnity’s scale and improving momentum present a different risk-reward balance.
Financial Ratios Comparison
These vital ratios act as a diagnostic tool to expose the underlying fiscal health, valuation premiums, and capital efficiency of the companies compared below:
| Ratios | Qnity Electronics, Inc. (Q) | NVE Corporation (NVEC) |
|---|---|---|
| ROE | 6.51% | 24.19% |
| ROIC | 5.92% | 21.14% |
| P/E | 28.8 | 20.46 |
| P/B | 1.88 | 4.95 |
| Current Ratio | 1.77 | 28.40 |
| Quick Ratio | 1.06 | 22.03 |
| D/E (Debt-to-Equity) | 0.018 | 0.015 |
| Debt-to-Assets | 1.56% | 1.43% |
| Interest Coverage | 3.03 | N/A |
| Asset Turnover | 0.35 | 0.40 |
| Fixed Asset Turnover | 2.59 | 8.91 |
| Payout Ratio | 0% | 128% |
| Dividend Yield | 0% | 6.28% |
| Fiscal Year | 2024 | 2025 |
Efficiency & Valuation Duel: The Vital Signs
Financial ratios serve as a company’s DNA, uncovering hidden risks and operational strengths beyond surface-level figures.
Qnity Electronics, Inc.
Qnity posts a modest 6.5% ROE and a solid 16% net margin, signaling moderate profitability. Its P/E of 28.8 marks the stock as somewhat expensive relative to earnings. With no dividends, Qnity reinvests heavily in R&D, aiming for growth. The firm’s balance sheet shows favorable liquidity and minimal debt, enhancing operational stability.
NVE Corporation
NVE delivers a strong 24.2% ROE and an impressive 58.2% net margin, reflecting high efficiency. The P/E of 20.5 suggests a reasonable valuation, though a PB of 4.95 appears stretched. NVE pays a 6.3% dividend yield, rewarding shareholders while maintaining robust reinvestment in R&D. Its liquidity ratios are unusually high but signal conservative financial management.
Premium Profitability vs. Valuation Discipline
NVE outperforms Qnity in profitability and shareholder returns but at a cost of a higher book value multiple and stretched liquidity. Qnity offers a more conservative valuation and balance sheet profile. Investors prioritizing growth and income may prefer NVE, while those seeking operational safety might favor Qnity.
Which one offers the Superior Shareholder Reward?
I observe that Qnity Electronics (Q) pays no dividends and maintains a zero payout ratio. It reinvests heavily in R&D and growth, supported by strong free cash flow of 4.1/share in 2024. Meanwhile, NVE Corporation (NVEC) offers a robust dividend yield near 6%, with a payout ratio slightly above 100%, signaling aggressive shareholder returns. NVEC also executes steady buybacks, enhancing total returns but at the risk of sustainability given its payout ratio above free cash flow. Q’s retention strategy is safer long-term, but NVEC’s combined dividend and buyback program delivers superior immediate shareholder reward in 2026.
Comparative Score Analysis: The Strategic Profile
The radar chart reveals the fundamental DNA and trade-offs of Qnity Electronics, Inc. and NVE Corporation, illustrating their financial strengths and valuation nuances:
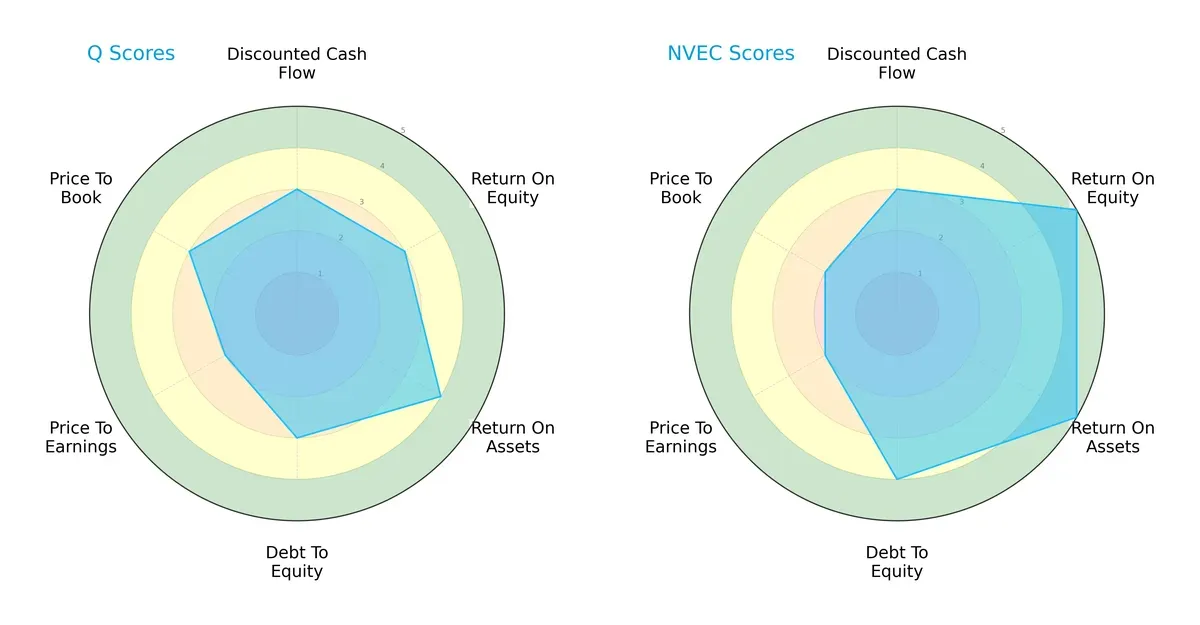
NVE leads with a more balanced and superior profile, scoring higher in ROE (5 vs. 3) and ROA (5 vs. 4), signaling efficient profit generation and asset use. Qnity shows modest strength in asset utilization but lags in equity returns and valuation metrics. Both firms share moderate DCF scores, yet NVE’s stronger debt-to-equity score (4 vs. 3) suggests better financial stability. Qnity relies more on asset efficiency, while NVE exhibits broader operational excellence.
—
Bankruptcy Risk: Solvency Showdown
NVE’s Altman Z-Score far exceeds Qnity’s, placing it deep in the safe zone, which signals robust solvency and resilience against bankruptcy risk in this late-cycle environment:

—
Financial Health: Quality of Operations
NVE’s Piotroski F-Score of 5 indicates average financial health, while Qnity’s score is not provided, limiting direct comparison. NVE shows no immediate red flags in operational quality:

How are the two companies positioned?
This section dissects the operational DNA of Q and NVEC by comparing their revenue distribution and internal dynamics. The final objective confronts their economic moats to reveal which business model offers the most resilient and sustainable competitive advantage today.
Revenue Segmentation: The Strategic Mix
This visual comparison dissects how Qnity Electronics, Inc. and NVE Corporation diversify their income streams and where their primary sector bets lie:
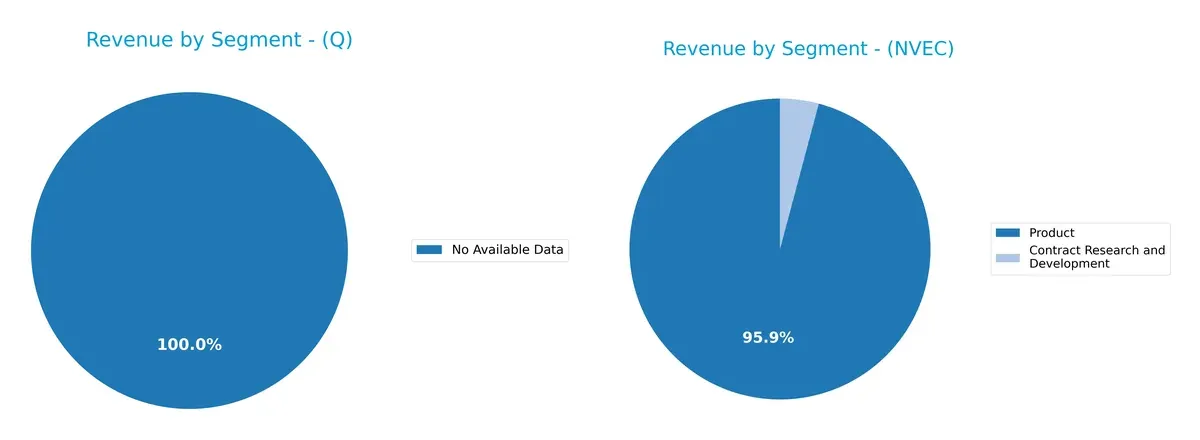
Qnity Electronics, Inc. lacks available data, preventing segmentation analysis. NVE Corporation anchors revenue in its Product segment, generating over $25B in recent years while Contract Research and Development contributes just around $1M. This concentration highlights NVE’s reliance on product sales, exposing it to market demand cycles but also reinforcing its infrastructure dominance. The minimal diversification suggests potential concentration risk but strong ecosystem lock-in in its core market.
Strengths and Weaknesses Comparison
This table compares the Strengths and Weaknesses of Qnity Electronics, Inc. and NVE Corporation:
Q Strengths
- Favorable net margin at 16%
- Low debt-to-assets at 1.56%
- Strong current and quick ratios
- WACC below ROIC indicates value creation
NVEC Strengths
- High net margin at 58%
- Strong ROE at 24% and ROIC at 21%
- Favorable interest coverage and low leverage
- High fixed asset turnover indicates operational efficiency
Q Weaknesses
- Unfavorable ROE at 6.5%
- PE ratio high at 28.8 suggests valuation risk
- Asset turnover low at 0.35
- No dividend yield limits income appeal
NVEC Weaknesses
- Extremely high current ratio of 28.4 may indicate inefficient asset use
- PB ratio at 4.95 signals expensive valuation
- Asset turnover still low at 0.4
- Dividend yield moderate at 6.3% marked neutral
Q shows solid financial health with conservative leverage and liquidity but struggles with profitability and asset efficiency. NVEC delivers superior profitability and efficiency but faces possible concerns from its bloated current ratio and high valuation multiples. Both companies’ financial profiles suggest differing strategic focuses: Q prioritizes stability while NVEC drives growth and returns.
The Moat Duel: Analyzing Competitive Defensibility
A structural moat is the only barrier protecting long-term profits from relentless competition and margin erosion. Consider these two semiconductor players:
Qnity Electronics, Inc.: Stability Without Clear Moat
Qnity relies on moderate cost advantages, reflected in stable 20.7% EBIT margins but an ROIC barely above WACC. Its moat remains neutral, with no clear value creation or growth in competitive strength as of 2026.
NVE Corporation: Innovation-Driven Moat with Spintronics
NVE dominates with a technology moat anchored in proprietary spintronic products. It commands 61.8% EBIT margins and a rapidly growing ROIC well above WACC, signaling strong value creation and a widening moat.
Innovation Edge vs. Cost Stability: Who Defends Market Share Better?
NVE’s technology moat is deeper and expanding, driven by cutting-edge spintronics and superior capital efficiency. Qnity’s cost advantage offers stability but lacks sustainable value creation. NVE is better positioned to defend and grow its market share.
Which stock offers better returns?
Stock prices for Qnity Electronics, Inc. and NVE Corporation show contrasting dynamics over the past year, highlighting divergent investor sentiment and market performance.
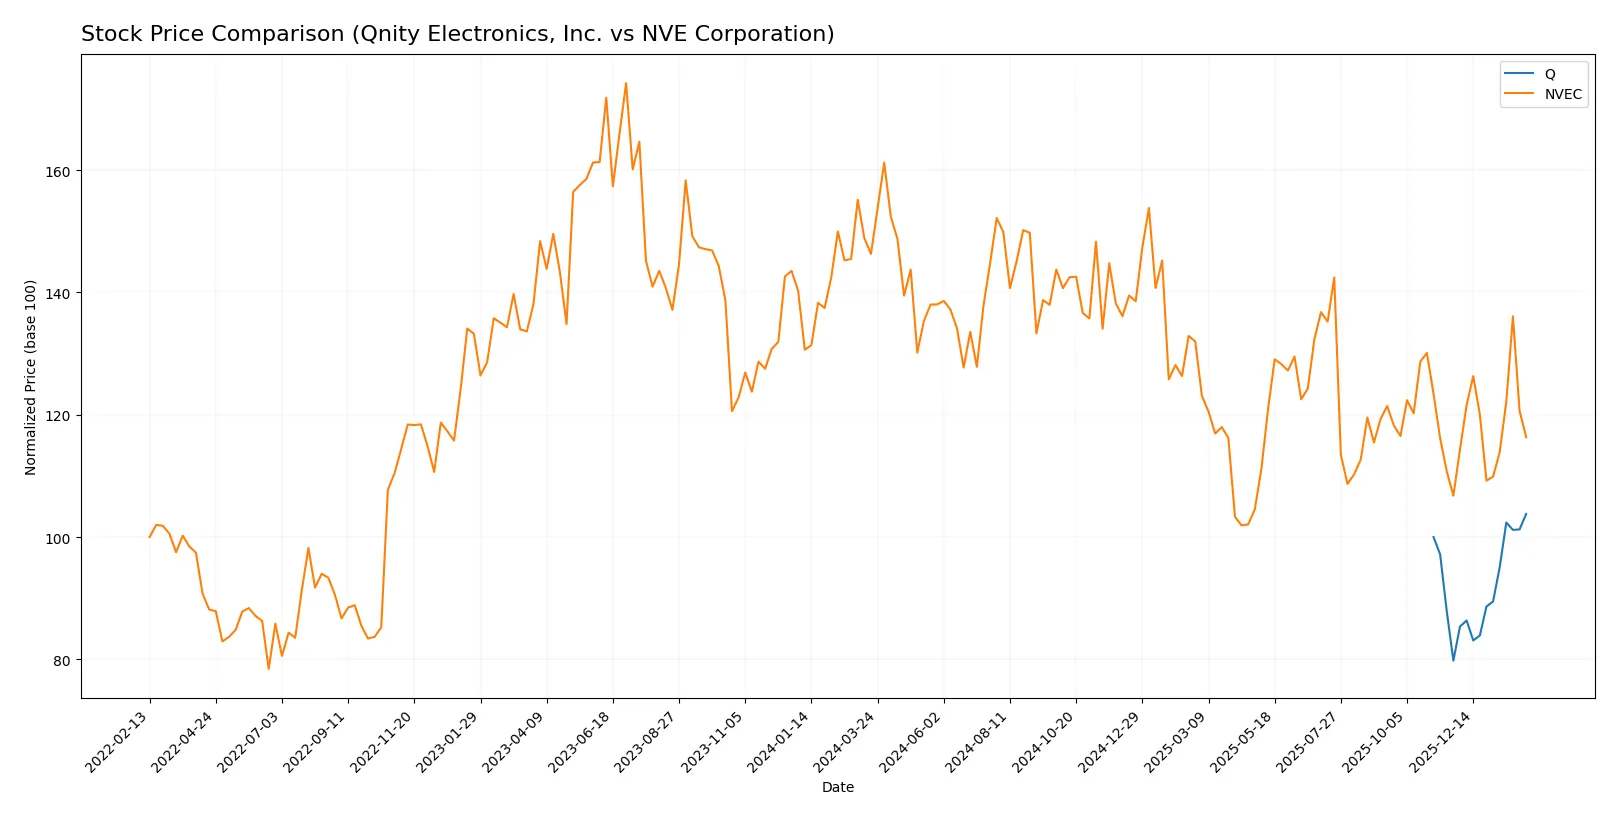
Trend Comparison
Qnity Electronics, Inc. displays a bullish trend with a 3.77% price increase over the past 12 months, marked by accelerating momentum and a high of 98.58, reflecting robust upward movement.
NVE Corporation exhibits a bearish trend, declining 20.49% over the same period despite recent acceleration; its lowest price reached 56.99, signaling sustained downward pressure.
Qnity Electronics, Inc. outperforms NVE Corporation, delivering the highest market returns and more pronounced positive momentum over the analyzed year.
Target Prices
Analysts set a clear target consensus for Qnity Electronics, Inc., reflecting moderate upside potential.
| Company | Target Low | Target High | Consensus |
|---|---|---|---|
| Qnity Electronics, Inc. | 92 | 118 | 106.78 |
Qnity Electronics’ consensus target price of $106.78 suggests a roughly 9% upside from the current $98.03 stock price. No verified target price data is available for NVE Corporation.

Don’t Let Luck Decide Your Entry Point
Optimize your entry points with our advanced ProRealTime indicators. You’ll get efficient buy signals with precise price targets for maximum performance. Start outperforming now!
How do institutions grade them?
The following shows how institutional grading firms currently rate the two companies:
Qnity Electronics, Inc. Grades
Here are the latest institutional grades for Qnity Electronics, Inc.:
| Grading Company | Action | New Grade | Date |
|---|---|---|---|
| RBC Capital | Maintain | Outperform | 2025-11-25 |
| Mizuho | Maintain | Outperform | 2025-11-20 |
Which company has the best grades?
Qnity Electronics holds consistent “Outperform” ratings from reputable firms. NVE Corporation lacks institutional grades, leaving more uncertainty for investors. Qnity’s grades suggest stronger analyst confidence and potential market interest.
Risks specific to each company
The following categories identify the critical pressure points and systemic threats facing both firms in the 2026 market environment:
1. Market & Competition
Qnity Electronics, Inc.
- Newly public since late 2025, Q faces intense competition in semiconductors with modest ROIC and ROE metrics.
NVE Corporation
- NVE leads with advanced spintronics technology, strong profitability, and higher ROIC, but competes in a niche segment.
2. Capital Structure & Debt
Qnity Electronics, Inc.
- Minimal debt with a debt-to-assets ratio of 1.56%, indicating a conservative capital structure.
NVE Corporation
- Also maintains low debt levels (1.43% debt-to-assets), with robust interest coverage and strong balance sheet metrics.
3. Stock Volatility
Qnity Electronics, Inc.
- Beta is zero, unusual for the semiconductor sector, suggesting limited trading history and uncertain volatility profile.
NVE Corporation
- Beta of 1.22 implies moderate volatility, consistent with tech sector norms and market sensitivity.
4. Regulatory & Legal
Qnity Electronics, Inc.
- Exposure to semiconductor manufacturing regulations with potential risks due to recent IPO and evolving compliance obligations.
NVE Corporation
- Faces regulatory oversight on medical and industrial IoT products, with established compliance but ongoing innovation risks.
5. Supply Chain & Operations
Qnity Electronics, Inc.
- New market entrant with unproven supply chain resilience amid semiconductor material shortages.
NVE Corporation
- Small operation (41 employees) but focused manufacturing may limit scale risks; supply chain dependence on niche components remains.
6. ESG & Climate Transition
Qnity Electronics, Inc.
- Limited disclosed ESG data; semiconductor materials sector faces environmental pressures and energy-intensive processes.
NVE Corporation
- Growing emphasis on sustainable spintronic products and IoT applications, but ESG reporting is still developing.
7. Geopolitical Exposure
Qnity Electronics, Inc.
- Based in Delaware, US, with global supply chain exposure; sensitive to US-China tech tensions impacting semiconductors.
NVE Corporation
- US-based with international sales; geopolitical risks include trade restrictions affecting specialized spintronic components.
Which company shows a better risk-adjusted profile?
NVE Corporation’s advanced technology and robust profitability provide a stronger risk-adjusted profile despite higher valuation multiples and volatile stock behavior. Qnity Electronics’ new IPO status and modest financial metrics raise concerns on operational scale and market positioning. The most impactful risk for Q is its unproven market foothold post-IPO, while for NVE it is the niche dependency on spintronics amid global trade tensions. NVE’s superior ROE (24.2% vs. 6.5%) and Altman Z-Score in the safe zone underscore its financial resilience, justifying a more confident investment stance amidst semiconductor sector pressures.
Final Verdict: Which stock to choose?
Qnity Electronics, Inc. (Q) impresses with its steady operational efficiency and strong cash flow conversion. Its main point of vigilance is a modest return on equity, which suggests room for improving shareholder value. Q fits well in an aggressive growth portfolio seeking solid fundamentals with moderate risk tolerance.
NVE Corporation (NVEC) stands out for its robust moat, driven by an exceptional return on invested capital well above its cost of capital, signaling a sustainable competitive advantage. NVEC offers a safer profile than Q, appealing to investors favoring Growth at a Reasonable Price (GARP) strategies with a focus on quality and stability.
If you prioritize efficient capital allocation and consistent cash generation, Qnity Electronics might be the compelling choice due to its operational resilience. However, if you seek superior profitability and a durable moat, NVE Corporation offers better stability and long-term value creation, even if it commands a premium valuation. Both present distinct opportunities aligned with different investor risk profiles.
Disclaimer: Investment carries a risk of loss of initial capital. The past performance is not a reliable indicator of future results. Be sure to understand risks before making an investment decision.
Go Further
I encourage you to read the complete analyses of Qnity Electronics, Inc. and NVE Corporation to enhance your investment decisions: