Home > Comparison > Technology > ON vs NVEC
The strategic rivalry between ON Semiconductor Corporation and NVE Corporation shapes the semiconductor sector’s innovation landscape. ON operates as a capital-intensive giant, delivering broad analog and power solutions, while NVE focuses on niche spintronic sensor technologies with a lean operational model. This analysis contrasts their growth trajectories and capital efficiency, aiming to identify which company presents a superior risk-adjusted opportunity for diversified portfolios seeking exposure to advanced semiconductor innovation.
Table of contents
Companies Overview
ON Semiconductor and NVE Corporation shape critical niches in the semiconductor industry, each with unique technological strengths.
ON Semiconductor Corporation: Powering Intelligent Electrification
ON Semiconductor commands a leading position in power solutions for automotive electrification and sustainable energy. It generates revenue by selling analog and integrated semiconductor products that optimize power switching, signal processing, and voltage regulation. In 2026, the company emphasizes expanding its portfolio in electric vehicle components and fast-charging infrastructure to capitalize on growing electrification trends.
NVE Corporation: Pioneer in Spintronic Innovation
NVE Corporation specializes in spintronics-based sensors and couplers that serve factory automation and medical device markets. Its revenue stems from manufacturing magnetic detection and data transmission products, plus licensing advanced spintronic memory technology. In 2026, NVE focuses on advancing industrial IoT applications and custom medical sensors, leveraging its niche expertise in nanotechnology-driven data acquisition.
Strategic Collision: Similarities & Divergences
Both companies operate in semiconductors but diverge in approach: ON Semiconductor pursues broad-based analog power and sensing solutions, while NVE targets a specialized spintronic niche. Their competition centers on innovation in sensor technology for automation and electrification. ON’s scale contrasts sharply with NVE’s boutique focus, creating distinct risk-return profiles—ON offers industrial-scale growth potential, NVE presents concentrated technological leadership.
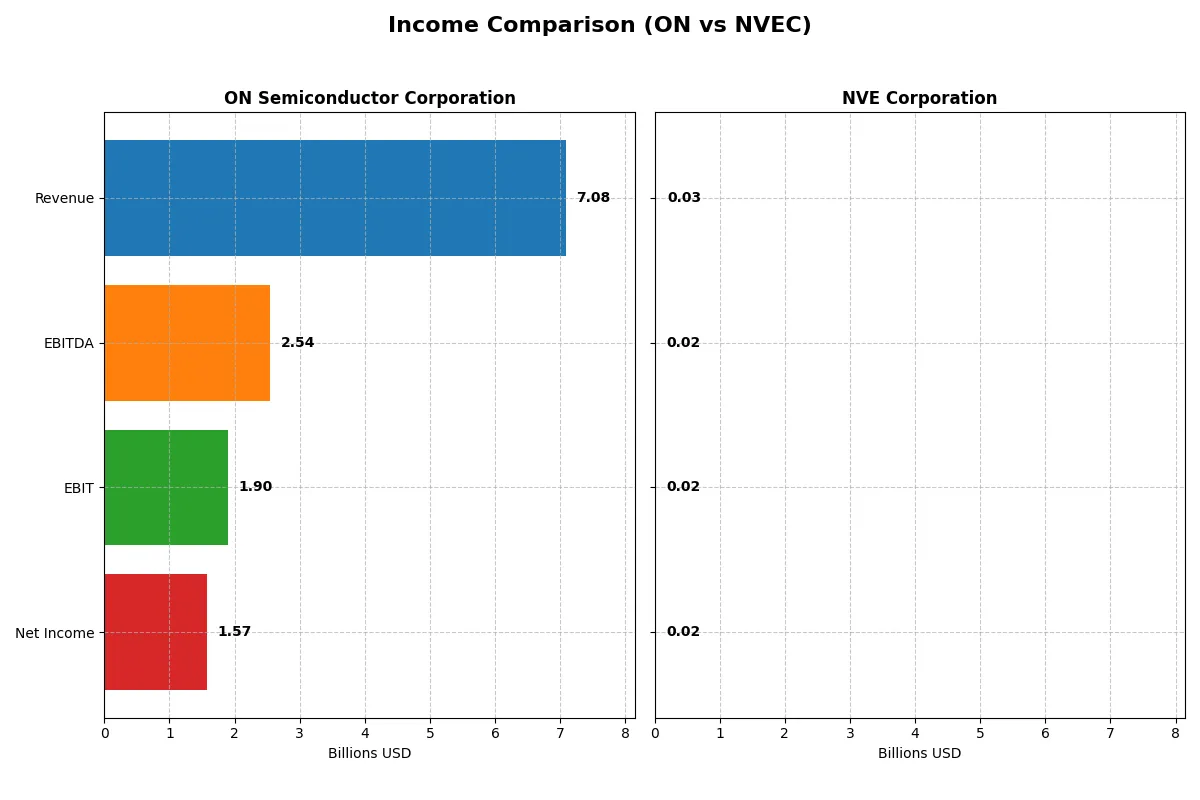
Income Statement Comparison
This data dissects the core profitability and scalability of both corporate engines to reveal who dominates the bottom line:
| Metric | ON Semiconductor Corporation (ON) | NVE Corporation (NVEC) |
|---|---|---|
| Revenue | 7.08B | 25.87M |
| Cost of Revenue | 3.87B | 4.24M |
| Operating Expenses | 1.45B | 5.64M |
| Gross Profit | 3.22B | 21.64M |
| EBITDA | 2.54B | 16.32M |
| EBIT | 1.90B | 15.99M |
| Interest Expense | 62.3M | 0 |
| Net Income | 1.57B | 15.06M |
| EPS | 3.68 | 3.12 |
| Fiscal Year | 2024 | 2025 |
Income Statement Analysis: The Bottom-Line Duel
This income statement comparison reveals which company operates its business with superior efficiency and profitability in a competitive landscape.
ON Semiconductor Corporation Analysis
ON Semiconductor’s revenue climbed 34.8% from 2020 to 2024, peaking at $8.3B in 2022 before retreating to $7.1B in 2024. Net income surged 571% over five years, hitting $1.57B in 2024 despite a 14% revenue decline last year. Margins remain robust with a 45.4% gross margin and a 22.2% net margin, signaling efficient cost control amid recent revenue pressure.
NVE Corporation Analysis
NVE’s revenue grew 21.1% over 2021–2025, reaching $25.9M in fiscal 2025 but dipped 13% from the prior year. Net income rose 28.8% overall, delivering $15.1M in 2025. Exceptional margin strength stands out: gross margin at 83.6% and net margin at 58.2%. Despite a recent revenue drop, NVE sustains high profitability and operational leverage, reflecting a niche business model.
Verdict: Scale and Momentum vs. High Margin Precision
ON Semiconductor outpaces NVE in scale and net income growth, though recent declines suggest cyclical headwinds. NVE’s striking margins demonstrate operational precision but on a much smaller revenue base. For investors, ON’s profile suits those prioritizing growth and market presence, while NVE appeals to those valuing margin dominance and niche positioning.
Financial Ratios Comparison
These vital ratios act as a diagnostic tool to expose underlying fiscal health, valuation premiums, and capital efficiency for the companies compared below:
| Ratios | ON Semiconductor Corporation (ON) | NVE Corporation (NVEC) |
|---|---|---|
| ROE | 17.9% | 24.2% |
| ROIC | 11.9% | 21.1% |
| P/E | 17.1 | 20.5 |
| P/B | 3.06 | 4.95 |
| Current Ratio | 5.06 | 28.40 |
| Quick Ratio | 3.38 | 22.03 |
| D/E (Debt-to-Equity) | 0.38 | 0.01 |
| Debt-to-Assets | 23.9% | 1.4% |
| Interest Coverage | 28.4 | 0 |
| Asset Turnover | 0.50 | 0.40 |
| Fixed Asset Turnover | 1.61 | 8.91 |
| Payout ratio | 0 | 128% |
| Dividend yield | 0% | 6.28% |
| Fiscal Year | 2024 | 2025 |
Efficiency & Valuation Duel: The Vital Signs
Ratios act as the company’s DNA, revealing hidden risks and operational excellence essential for sound investment decisions.
ON Semiconductor Corporation
ON Semiconductor delivers solid profitability with a 17.9% ROE and a 22.2% net margin, indicating efficient operations. Its P/E of 17.1 suggests a reasonably priced stock, not stretched by market expectations. Despite no dividend yield, ON reinvests heavily in R&D (8.7% of sales), fueling growth and innovation.
NVE Corporation
NVE boasts exceptional profitability with a 24.2% ROE and an impressive 58.2% net margin, reflecting strong operational leverage. The stock trades at a P/E of 20.5, indicating a premium valuation. NVE offers a 6.3% dividend yield, balancing shareholder returns with growth, supported by a high R&D spend of 14.1%.
Premium Valuation vs. Operational Safety
NVE commands higher margins and returns at a premium valuation, rewarding income-focused investors with dividends. ON provides balanced profitability at a fairer valuation, emphasizing reinvestment over payouts. Growth-oriented investors may prefer ON’s innovation focus, while dividend seekers might lean toward NVE’s yield.
Which one offers the Superior Shareholder Reward?
I see ON Semiconductor pays no dividends but generates solid free cash flow of 2.8/share with moderate buybacks enhancing shareholder value sustainably. NVE Corporation offers a 4% dividend yield with payout ratios exceeding 100%, supported by strong free cash flow near 2.7/share and aggressive buybacks. ON’s conservative, reinvestment-focused model favors long-term growth, while NVE delivers higher immediate returns but risks payout sustainability. I judge ON Semiconductor provides superior total return potential in 2026 due to balanced capital allocation and lower distribution risk.
Comparative Score Analysis: The Strategic Profile
The radar chart reveals the fundamental DNA and trade-offs of ON Semiconductor Corporation and NVE Corporation’s financial profiles:
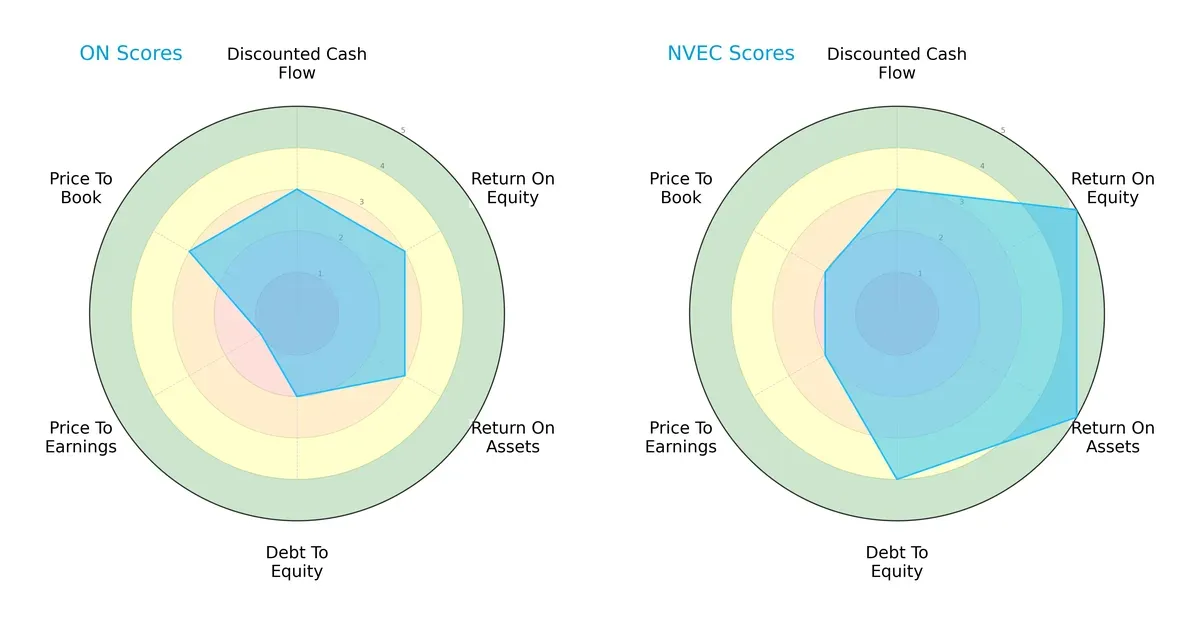
NVE Corporation demonstrates a stronger overall financial profile with higher ROE (5 vs. 3) and ROA (5 vs. 3), indicating superior profitability and asset efficiency. ON Semiconductor shows a weaker debt-to-equity position (2 vs. 4) and a very unfavorable P/E score (1 vs. 2), reflecting valuation concerns. NVE’s balanced strengths across metrics suggest a more robust investment case, while ON relies heavily on moderate cash flow but struggles with valuation.
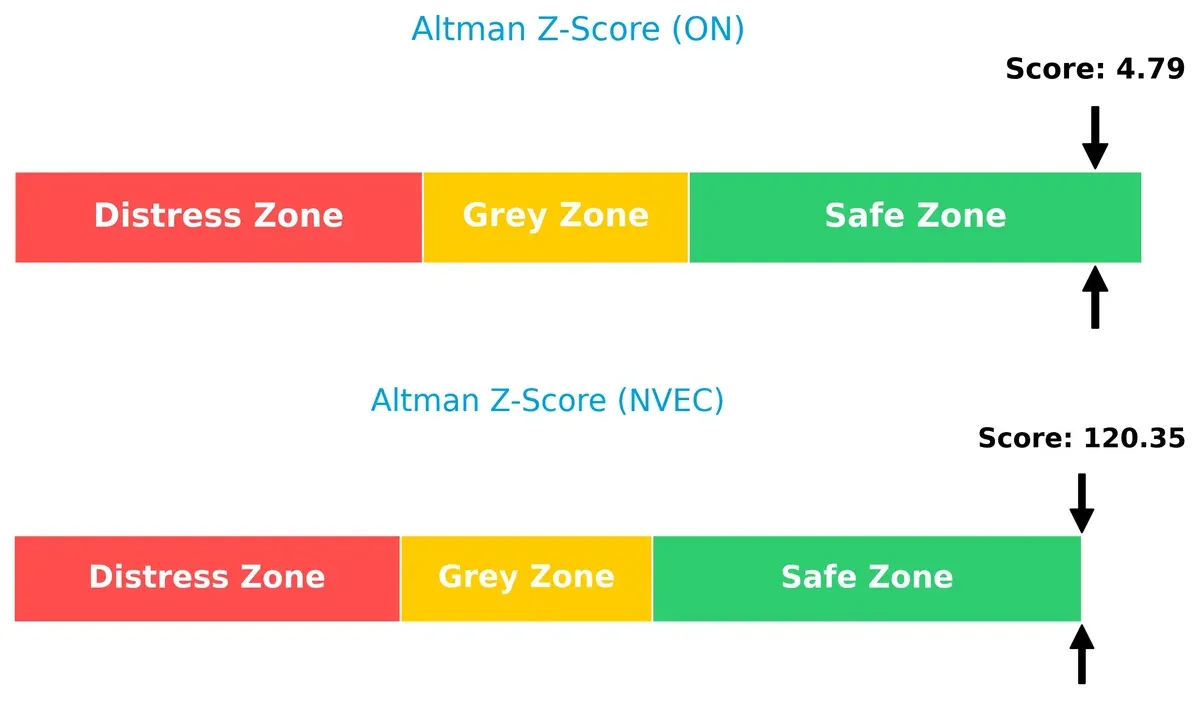
Bankruptcy Risk: Solvency Showdown
NVE’s Altman Z-Score of 120.35 vastly outpaces ON’s 4.79, both safely above the distress threshold, underscoring their strong financial resilience in this cycle:
Financial Health: Quality of Operations
ON Semiconductor scores a 6 while NVE posts a 5 on the Piotroski F-Score, both in the average range, indicating solid but not peak operational health:
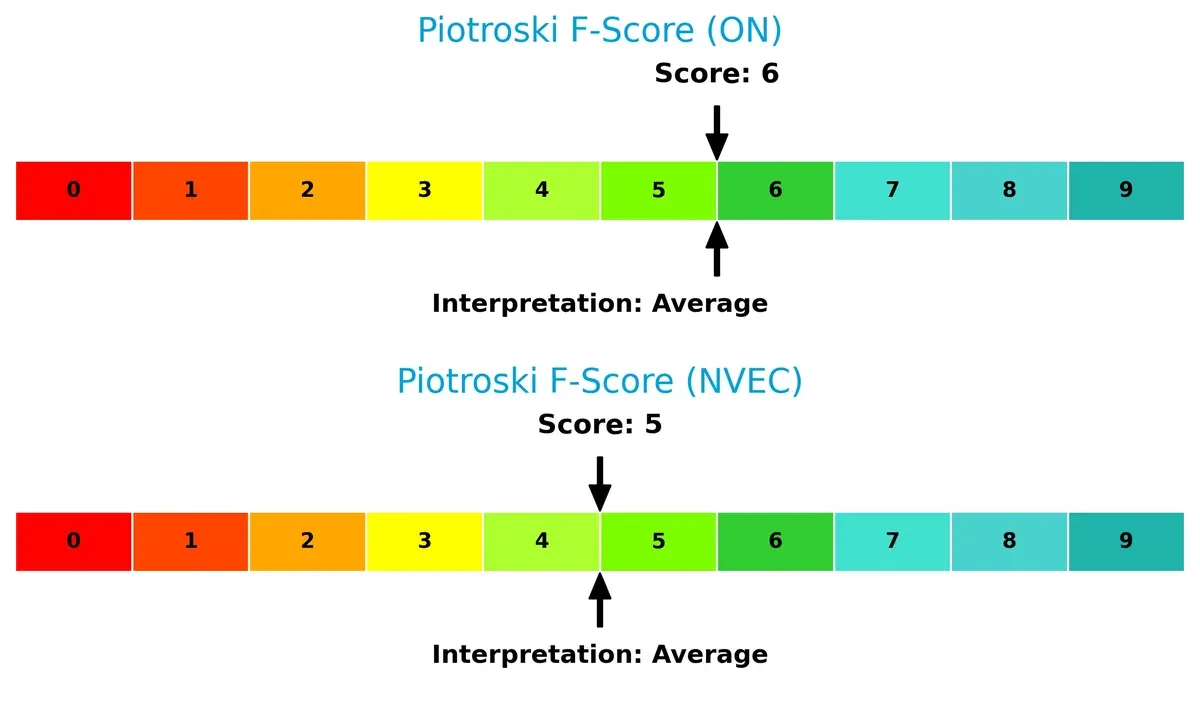
ON’s slightly higher score suggests marginally better internal financial discipline, yet neither company shows red flags warranting immediate concern. Investors should monitor ongoing operational metrics to confirm sustained quality.
How are the two companies positioned?
This section dissects ON and NVEC’s operational DNA by comparing revenue distribution and internal dynamics. The goal is to confront their economic moats to identify the most resilient competitive advantage today.
Revenue Segmentation: The Strategic Mix
This visual comparison dissects how ON Semiconductor and NVE Corporation diversify their income streams and where their primary sector bets lie:
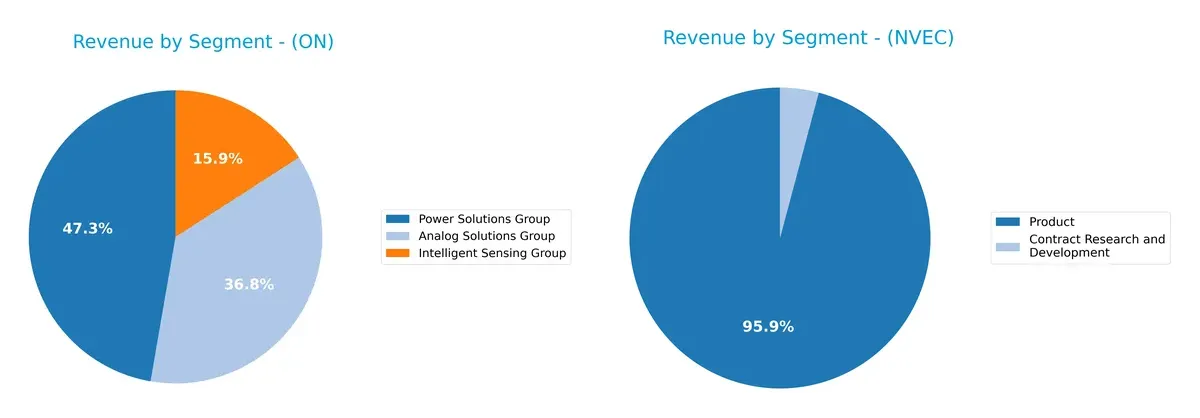
ON Semiconductor anchors its revenue in Power Solutions at $3.35B for 2024, supported by Analog Solutions ($2.61B) and Intelligent Sensing ($1.13B). This diversified mix contrasts sharply with NVE, which pivots almost entirely on its Product segment at $25.9M, with Contract Research trailing at $1.1M. ON’s multi-segment strategy cushions against volatility, while NVE’s concentration signals higher risk but potential niche dominance.
Strengths and Weaknesses Comparison
This table compares the strengths and weaknesses of ON Semiconductor Corporation and NVE Corporation:
ON Semiconductor Corporation Strengths
- Diversified revenue across three major groups
- Favorable net margin at 22.21%
- Strong ROE at 17.88%
- Solid ROIC at 11.88% above WACC
- Good quick ratio at 3.38
- Moderate debt levels with 23.9% debt to assets
- Significant global presence in Asia and Europe
NVE Corporation Strengths
- Exceptionally high net margin at 58.22%
- High ROE at 24.19% and ROIC at 21.14%
- Very low debt with 1.43% debt to assets
- Infinite interest coverage ratio
- Strong fixed asset turnover at 8.91
- Favorable quick ratio at 22.03
- Established US and European market presence
ON Semiconductor Corporation Weaknesses
- Unfavorable WACC at 10.23% exceeding ROIC
- High current ratio at 5.06 suggests excess liquidity
- Unfavorable PB ratio at 3.06
- Zero dividend yield
- Neutral asset turnover at 0.5
- Revenue concentration in few product groups
NVE Corporation Weaknesses
- High current ratio at 28.4 indicates potential inefficient asset use
- Unfavorable PB ratio at 4.95
- Lower asset turnover at 0.4
- Neutral PE ratio at 20.46
- Limited product diversification with heavy reliance on product segment
Overall, ON Semiconductor shows balanced strengths in diversification and global reach but faces challenges in capital efficiency and valuation metrics. NVE Corporation excels in profitability and asset utilization but contends with liquidity management and product concentration risks. Both companies’ strategies must address these weaknesses to sustain competitive advantages.
The Moat Duel: Analyzing Competitive Defensibility
A structural moat is the only durable barrier protecting long-term profits from relentless competition erosion. Let’s dissect the moats of ON Semiconductor and NVE Corporation:
ON Semiconductor Corporation: Emerging Power Solutions Moat
ON Semiconductor’s moat stems from its cost advantage in power management and sensing technologies. Its slightly favorable ROIC trend signals improving profitability, but ROIC remains below WACC, indicating value shedding. Expansion in automotive electrification could deepen its moat if execution accelerates in 2026.
NVE Corporation: Spintronics Innovation Moat
NVE’s moat is rooted in unique spintronic technology creating high switching costs for customers. It boasts a very favorable ROIC well above WACC, reflecting strong value creation and margin dominance. Continued R&D and IoT market penetration in 2026 may extend its competitive edge further.
Cost Efficiency vs. Breakthrough Innovation: The Moat Battle
NVE holds a deeper moat with a robust ROIC premium over WACC, signaling sustainable advantage. ON shows promise but lags in capital efficiency. NVE is better positioned to defend market share amid evolving semiconductor demands.
Which stock offers better returns?
The past year reveals significant price declines for both stocks, with recent months showing notable rebounds and shifts in buyer dominance.
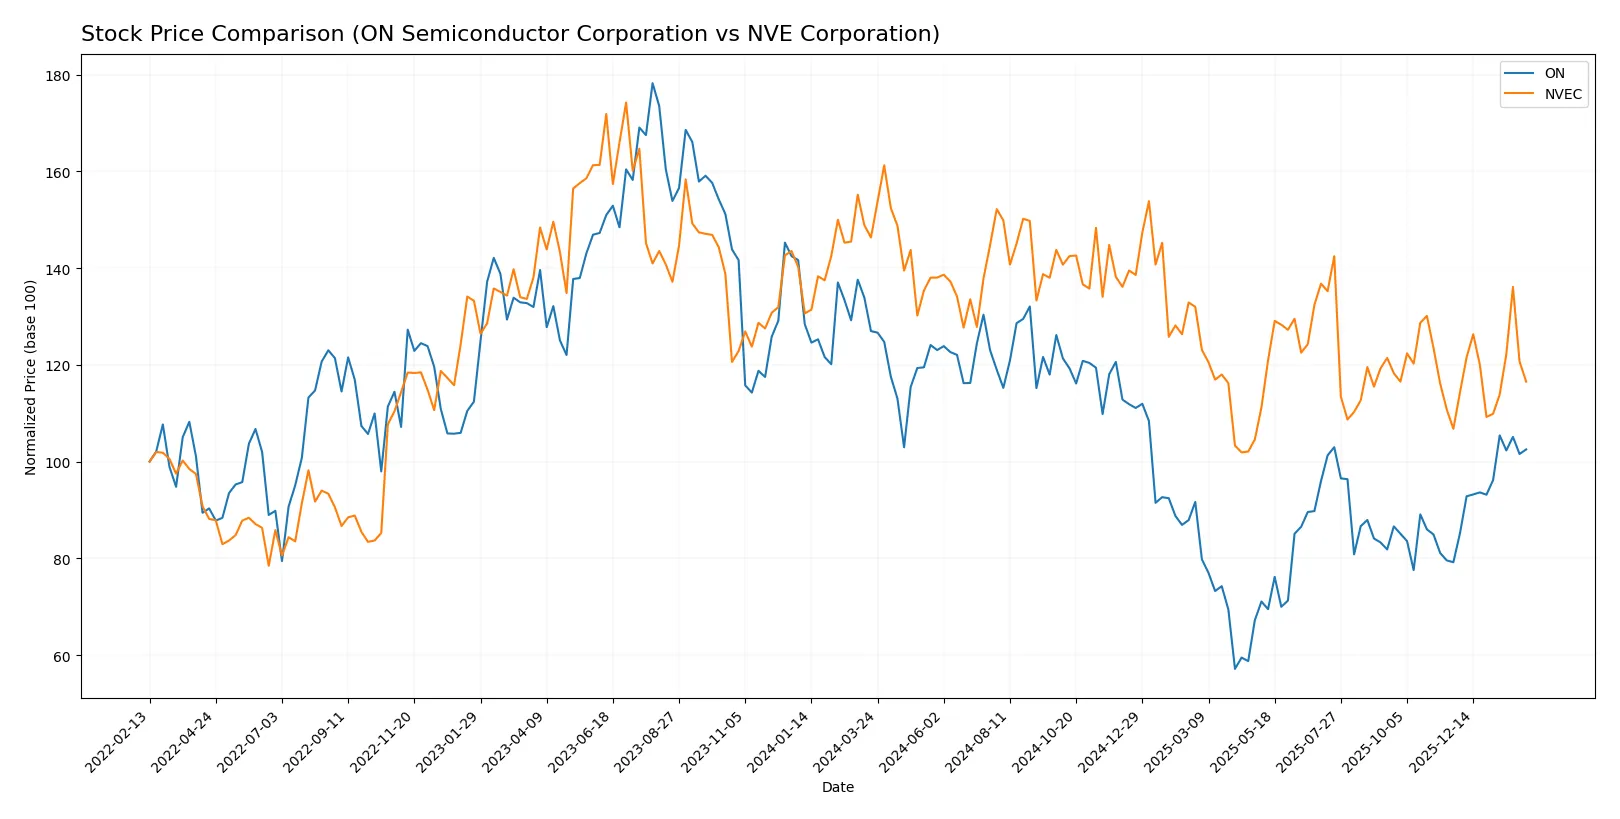
Trend Comparison
ON Semiconductor Corporation’s stock fell 19.26% over the past year, marking a bearish trend with accelerating decline. Prices ranged from 77.87 to 33.7, showing high volatility with a recent strong 29.44% rebound.
NVE Corporation’s stock declined 20.36% over the same period, also bearish with acceleration. Its price fluctuated between 90.18 and 56.99, with a recent moderate 9.15% recovery and lower volatility than ON.
ON’s recent 29.44% gain outpaces NVE’s 9.15%, indicating stronger short-term market performance despite both showing overall yearly declines.
Target Prices
Analysts set a clear target consensus for ON Semiconductor Corporation, reflecting moderate upside potential.
| Company | Target Low | Target High | Consensus |
|---|---|---|---|
| ON Semiconductor Corporation | 51 | 64 | 59.25 |
The target consensus of 59.25 suggests modest appreciation from the current price of 60.6, indicating cautious optimism. No verified target price data is available for NVE Corporation.

Don’t Let Luck Decide Your Entry Point
Optimize your entry points with our advanced ProRealTime indicators. You’ll get efficient buy signals with precise price targets for maximum performance. Start outperforming now!
How do institutions grade them?
The following summarizes institutional grades for ON Semiconductor Corporation and NVE Corporation:
ON Semiconductor Corporation Grades
This table shows recent grades from reputable grading firms for ON Semiconductor:
| Grading Company | Action | New Grade | Date |
|---|---|---|---|
| B of A Securities | Maintain | Neutral | 2026-01-21 |
| B. Riley Securities | Maintain | Neutral | 2026-01-20 |
| Stifel | Maintain | Hold | 2026-01-16 |
| Citigroup | Maintain | Neutral | 2026-01-15 |
| Wells Fargo | Maintain | Overweight | 2026-01-15 |
| Piper Sandler | Maintain | Overweight | 2026-01-07 |
| Truist Securities | Maintain | Hold | 2025-12-19 |
| Morgan Stanley | Maintain | Equal Weight | 2025-11-24 |
| Truist Securities | Maintain | Hold | 2025-11-04 |
| Morgan Stanley | Maintain | Equal Weight | 2025-11-04 |
NVE Corporation Grades
No reliable institutional grades are available for NVE Corporation.
Which company has the best grades?
ON Semiconductor holds a range of neutral to overweight grades from established firms. NVE lacks institutional grading. Investors may view ON’s coverage as providing clearer market consensus and guidance.
Risks specific to each company
The following categories identify the critical pressure points and systemic threats facing both firms in the 2026 market environment:
1. Market & Competition
ON Semiconductor Corporation
- Large player with broad semiconductor portfolio facing intense competition from diversified peers.
NVE Corporation
- Niche spintronics specialist with limited scale but less direct competition in its segment.
2. Capital Structure & Debt
ON Semiconductor Corporation
- Moderate leverage with D/E at 0.38 and good interest coverage (30.49x), signaling healthy debt management.
NVE Corporation
- Minimal debt load (D/E 0.01) and infinite interest coverage, indicating very low financial risk.
3. Stock Volatility
ON Semiconductor Corporation
- Higher beta at 1.54 implies greater sensitivity to market swings, raising volatility risk.
NVE Corporation
- Lower beta at 1.22 suggests somewhat less price volatility relative to market benchmarks.
4. Regulatory & Legal
ON Semiconductor Corporation
- Exposure to global regulatory changes affecting automotive and power sectors could increase compliance costs.
NVE Corporation
- Niche technology focus may face fewer regulatory hurdles but must monitor emerging tech standards closely.
5. Supply Chain & Operations
ON Semiconductor Corporation
- Large scale operations expose ON to complex supply chain risks, including raw material costs and logistics.
NVE Corporation
- Smaller scale and specialized production reduce supply chain complexity but increase reliance on limited suppliers.
6. ESG & Climate Transition
ON Semiconductor Corporation
- Active in power solutions and electrification, supporting climate transition but facing scrutiny on resource use.
NVE Corporation
- Technology aligns with energy efficiency trends but ESG reporting and impact remain limited due to size.
7. Geopolitical Exposure
ON Semiconductor Corporation
- Global footprint subjects ON to geopolitical tensions affecting semiconductor trade and supply chains.
NVE Corporation
- Primarily US-based, with lower direct exposure but vulnerable to export controls on advanced tech.
Which company shows a better risk-adjusted profile?
ON Semiconductor’s largest risk lies in its complex supply chain and competitive intensity in a cyclical sector. NVE’s key risk is its niche focus with limited scale, exposing it to market concentration risks. NVE’s stronger financial health, minimal debt, and lower volatility offer a better risk-adjusted profile. Recently, NVE’s exceptionally high Altman Z-score reinforces its financial stability, underscoring my preference for its resilience despite smaller size.
Final Verdict: Which stock to choose?
ON Semiconductor’s superpower lies in its improving profitability and efficient capital use, showing a growing ROIC trend despite a high WACC. Its strong liquidity is a point of vigilance, signaling potential balance sheet risk. It fits aggressive growth portfolios willing to tolerate volatility for future value creation.
NVE Corporation commands a robust strategic moat with exceptional margins and a very favorable ROIC versus WACC gap. Its rock-solid balance sheet and consistent profitability offer better stability than ON. This stock suits GARP investors seeking sustainable growth without sacrificing financial safety.
If you prioritize aggressive expansion with a focus on rising profitability, ON Semiconductor is compelling due to its improving returns and operational momentum. However, if you seek superior stability and a durable competitive advantage, NVE Corporation outshines with its margin dominance and fortress-like balance sheet. Both carry risks, so align your choice with your risk tolerance and investment horizon.
Disclaimer: Investment carries a risk of loss of initial capital. The past performance is not a reliable indicator of future results. Be sure to understand risks before making an investment decision.
Go Further
I encourage you to read the complete analyses of ON Semiconductor Corporation and NVE Corporation to enhance your investment decisions: