Home > Comparison > Technology > NXPI vs NVEC
The strategic rivalry between NXP Semiconductors N.V. and NVE Corporation shapes the evolving semiconductor landscape. NXP operates as a global technology powerhouse with diversified product lines and extensive scale. In contrast, NVE focuses on niche spintronic technology with a lean, specialized model. This comparison pivots on scale versus innovation-driven growth. This analysis aims to identify which trajectory offers superior risk-adjusted returns for a diversified portfolio in the dynamic tech sector.
Table of contents
Companies Overview
NXP Semiconductors and NVE Corporation both play crucial roles in the semiconductor industry, shaping innovation in diverse niches.
NXP Semiconductors N.V.: Global Semiconductor Powerhouse
NXP Semiconductors dominates the semiconductor sector with a broad portfolio including microcontrollers, application processors, and wireless connectivity solutions. Its revenue stems mainly from automotive, industrial IoT, and mobile markets. In 2026, the company focuses on expanding its presence in communication infrastructure while leveraging advanced sensor technologies.
NVE Corporation: Spintronics Innovator
NVE Corporation specializes in spintronic technology, producing sensors and couplers that harness electron spin for data acquisition and transmission. Its core market lies in factory automation and medical devices. In 2026, NVE advances its industrial IoT offerings and licenses magnetoresistive memory tech, targeting niche innovation rather than scale.
Strategic Collision: Similarities & Divergences
NXP pursues a broad market approach with diversified semiconductor products, while NVE bets on a specialized spintronics niche. Their primary battleground is industrial IoT, though NXP leverages scale and ecosystem integration, contrasting NVE’s research-driven, focused innovation. Investors face distinct profiles: NXP offers scale and diversification; NVE provides concentrated exposure to cutting-edge nanotech.
Income Statement Comparison
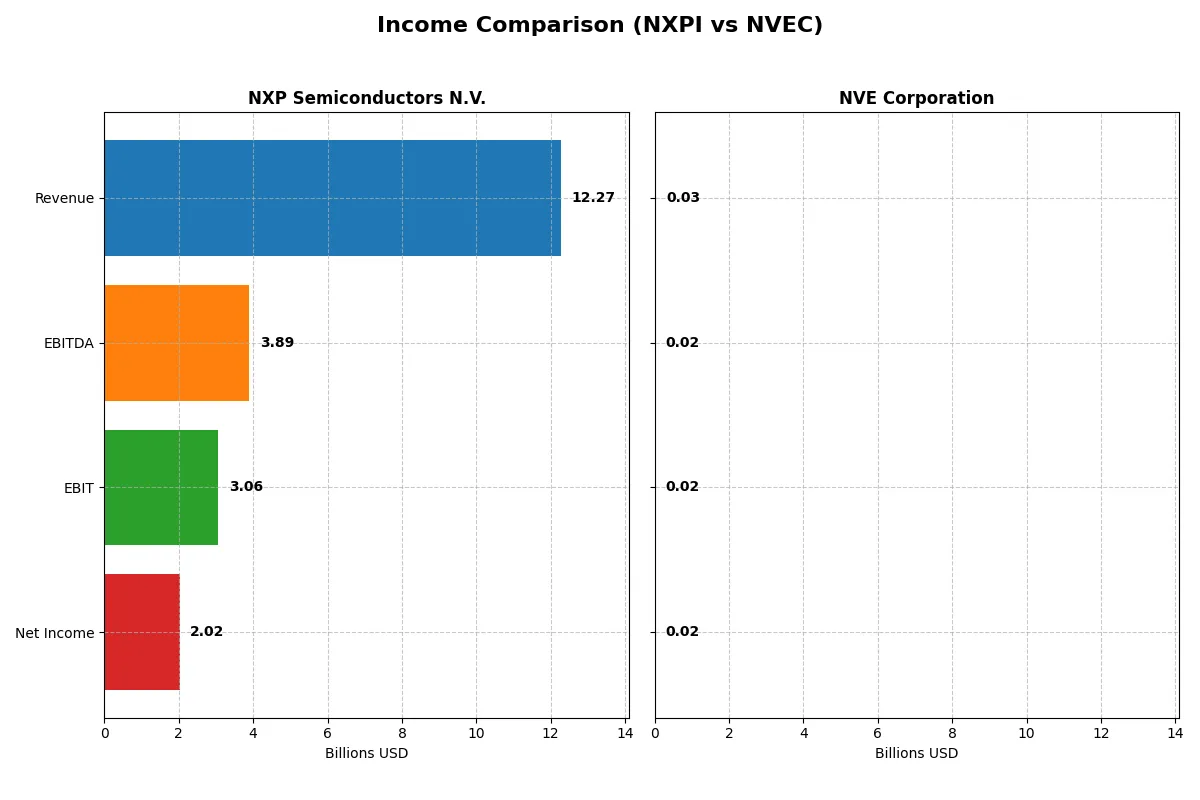
This data dissects the core profitability and scalability of both corporate engines to reveal who dominates the bottom line:
| Metric | NXP Semiconductors N.V. (NXPI) | NVE Corporation (NVEC) |
|---|---|---|
| Revenue | 12.3B | 26M |
| Cost of Revenue | 5.59B | 4.24M |
| Operating Expenses | 3.37B | 5.64M |
| Gross Profit | 6.68B | 21.6M |
| EBITDA | 3.89B | 16.3M |
| EBIT | 3.06B | 16.0M |
| Interest Expense | 384M | 0 |
| Net Income | 2.02B | 15.1M |
| EPS | 8.00 | 3.12 |
| Fiscal Year | 2025 | 2025 |
Income Statement Analysis: The Bottom-Line Duel
This income statement comparison will reveal which company drives superior operational efficiency and profit generation through its core business engine.
NXP Semiconductors N.V. Analysis
NXP Semiconductors posts stable revenue around 12.3B in 2025, down 2.7% from 2024, with net income declining 19.7% to 2.02B. Gross margin of 54.4% and net margin of 16.5% remain healthy but show pressure. Recent margin contraction and earnings drop highlight challenges in sustaining momentum despite solid overall growth since 2021.
NVE Corporation Analysis
NVE Corporation reports 26M revenue in 2025, down 13.2% year-over-year, with net income falling 12% to 15.1M. However, margins impress: gross margin at 83.6% and net margin at 58.2% demonstrate exceptional profitability and capital efficiency. Despite recent revenue headwinds, NVE’s margin expansion and 29% net income growth over five years signal strong operational leverage.
Margin Power vs. Revenue Scale
NVE excels in margin dominance with net margins over three times higher than NXP, while NXP boasts revenue scale nearly 500 times greater. NVE’s efficiency and superior margin growth contrast with NXP’s scale-driven but margin-pressured model. Investors favoring robust profitability may prefer NVE’s profile; those prioritizing market presence might lean toward NXP.
Financial Ratios Comparison
These vital ratios act as a diagnostic tool to expose the underlying fiscal health, valuation premiums, and capital efficiency of the companies compared below:
| Ratios | NXP Semiconductors N.V. (NXPI) | NVE Corporation (NVEC) |
|---|---|---|
| ROE | 20.1% | 24.2% |
| ROIC | 11.0% | 21.1% |
| P/E | 27.1 | 20.5 |
| P/B | 5.45 | 4.95 |
| Current Ratio | 2.05 | 28.40 |
| Quick Ratio | 1.38 | 22.03 |
| D/E | 1.22 | 0.015 |
| Debt-to-Assets | 46.0% | 1.4% |
| Interest Coverage | 8.62 | 0 |
| Asset Turnover | 0.46 | 0.40 |
| Fixed Asset Turnover | 4.12 | 8.91 |
| Payout Ratio | 51% | 128% |
| Dividend yield | 1.87% | 6.28% |
| Fiscal Year | 2025 | 2025 |
Efficiency & Valuation Duel: The Vital Signs
Ratios act as the company’s DNA, revealing hidden risks and operational excellence that influence investment decisions.
NXP Semiconductors N.V.
NXP displays a solid 20.1% ROE and 16.47% net margin, signaling strong profitability. However, its P/E of 27.14 suggests the stock is somewhat expensive. With a moderate 1.87% dividend yield and robust R&D investment, NXP balances shareholder returns with future growth potential.
NVE Corporation
NVE exhibits an impressive 24.19% ROE and a commanding 58.22% net margin, reflecting operational efficiency. Its P/E of 20.46 indicates a fair valuation. NVE’s high dividend yield of 6.28% complements its conservative debt levels, offering shareholders both income and safety.
Premium Valuation vs. Operational Safety
NVE leads with superior profitability and a healthier balance sheet, despite a stretched current ratio. NXP’s higher valuation reflects growth expectations but carries moderate leverage. Investors seeking income and operational strength may prefer NVE, while those prioritizing innovation might lean toward NXP.
Which one offers the Superior Shareholder Reward?
I compare NXP Semiconductors (NXPI) and NVE Corporation (NVEC) on dividends, payout ratios, and buybacks. NXPI pays a modest 1.87% dividend yield with a sustainable 51% payout ratio, supported by strong free cash flow. NVEC offers a high 6.28% yield but with payout ratios exceeding 100%, signaling risk to sustainability. NXPI’s buyback activity is more balanced, while NVEC’s capital allocation heavily favors dividends over buybacks. I see NXPI’s disciplined distribution and buyback mix as more sustainable. For 2026, NXPI offers a superior total shareholder return profile, balancing income and long-term value.
Comparative Score Analysis: The Strategic Profile
The radar chart reveals the fundamental DNA and trade-offs of NXP Semiconductors and NVE Corporation, highlighting their strategic financial strengths and weaknesses:
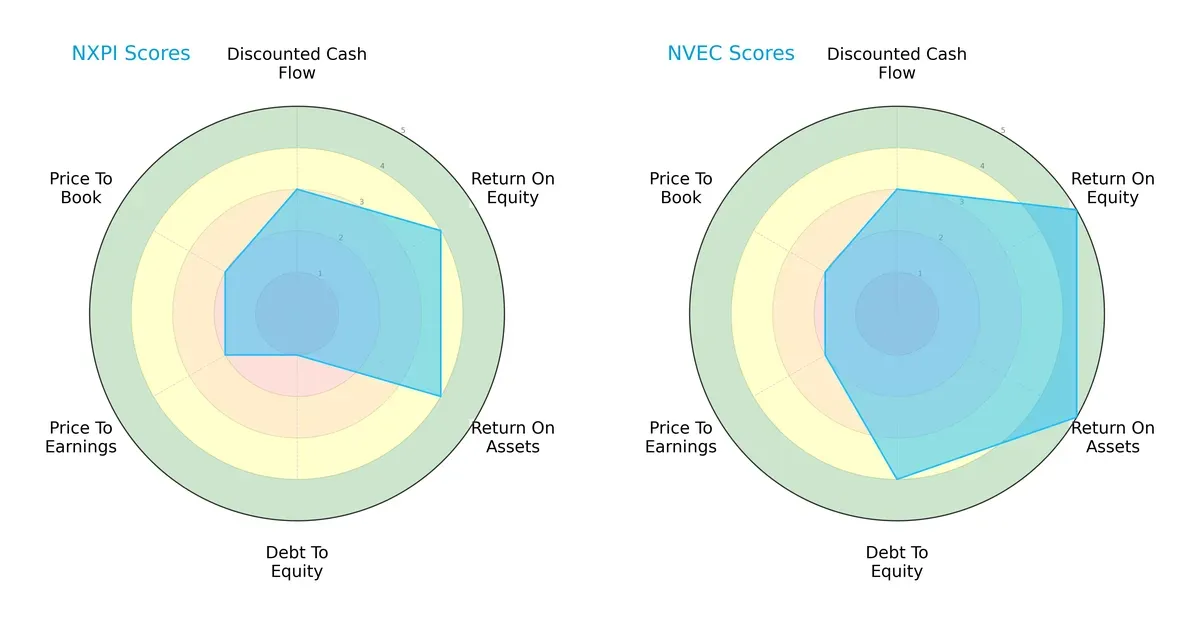
NVE Corporation boasts a more balanced profile with superior ROE (5 vs. 4) and ROA (5 vs. 4) scores, signaling efficient asset utilization and equity returns. NXP Semiconductors shows moderate DCF and valuation metrics but struggles with a very unfavorable debt-to-equity score (1 vs. 4), indicating higher financial risk. NVE leans on a broad efficiency edge, while NXP relies more on operational returns despite leverage concerns.
Bankruptcy Risk: Solvency Showdown
The Altman Z-Score gap strongly favors NVE Corporation, with 120.35 versus NXP’s 3.10, both in the safe zone but with vastly different margins of safety:
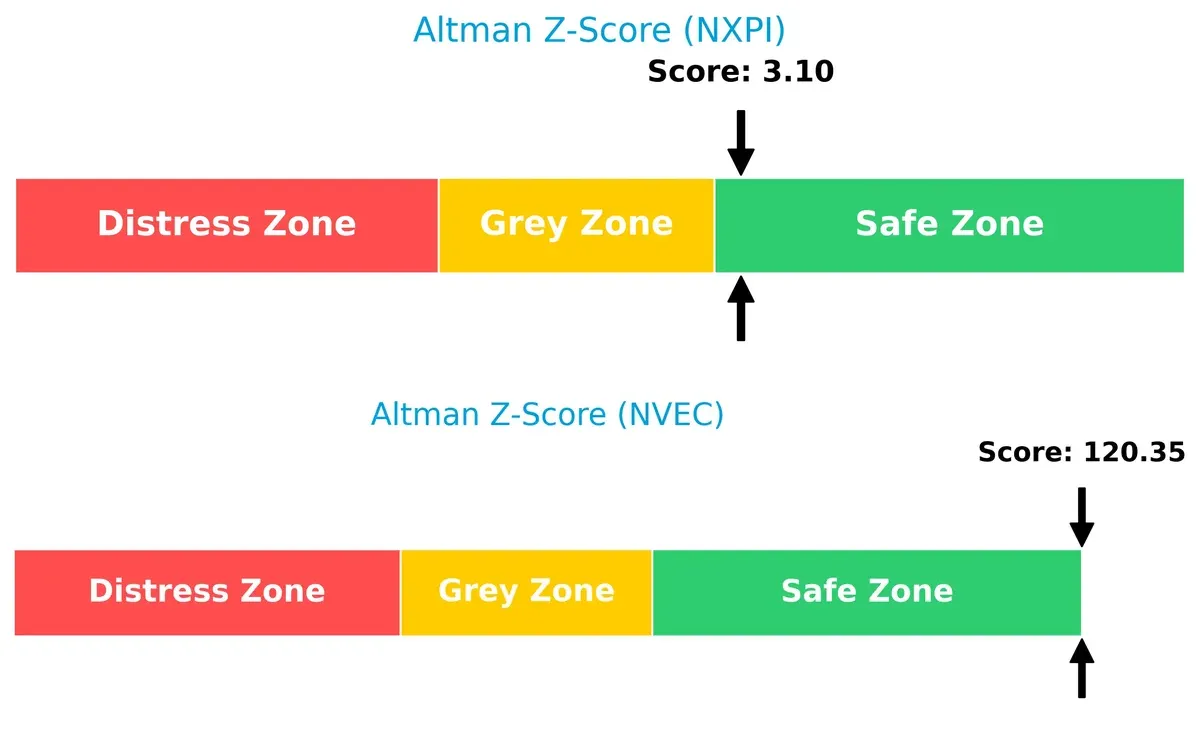
NVE’s exceptionally high Z-Score suggests robust solvency and negligible bankruptcy risk, reflecting a fortress-like balance sheet. NXP, while above the distress threshold, sits just above the safety cutoff, signaling caution in turbulent market conditions.
Financial Health: Quality of Operations
Both companies score equally on the Piotroski F-Score at 5, indicating average financial health with no glaring red flags:
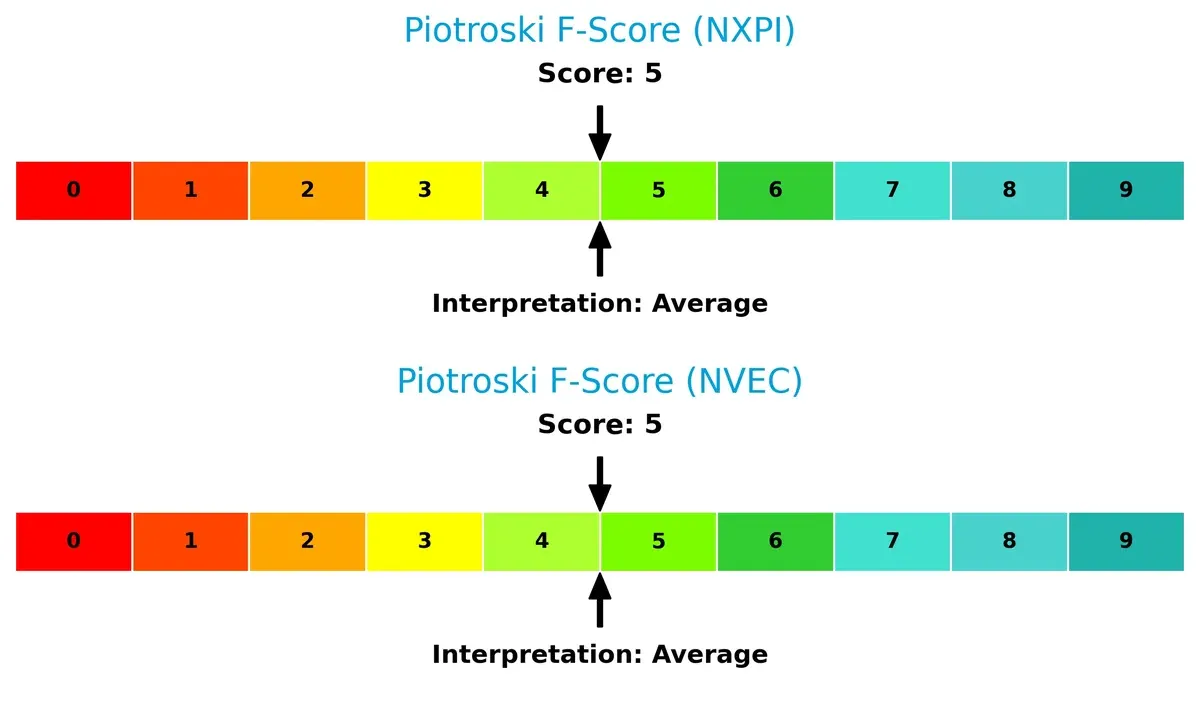
This parity suggests similar internal operational quality, though neither excels in peak financial robustness. Investors should monitor these mid-tier scores for potential improvement or deterioration, especially in a cyclical environment.
How are the two companies positioned?
This section dissects the operational DNA of NXP Semiconductors and NVE Corporation by comparing their revenue distribution and internal strengths and weaknesses. The goal is to confront their economic moats and reveal which business model offers the most resilient, sustainable competitive edge today.
Revenue Segmentation: The Strategic Mix
This visual comparison dissects how NXP Semiconductors and NVE Corporation diversify their income streams and where their primary sector bets lie:
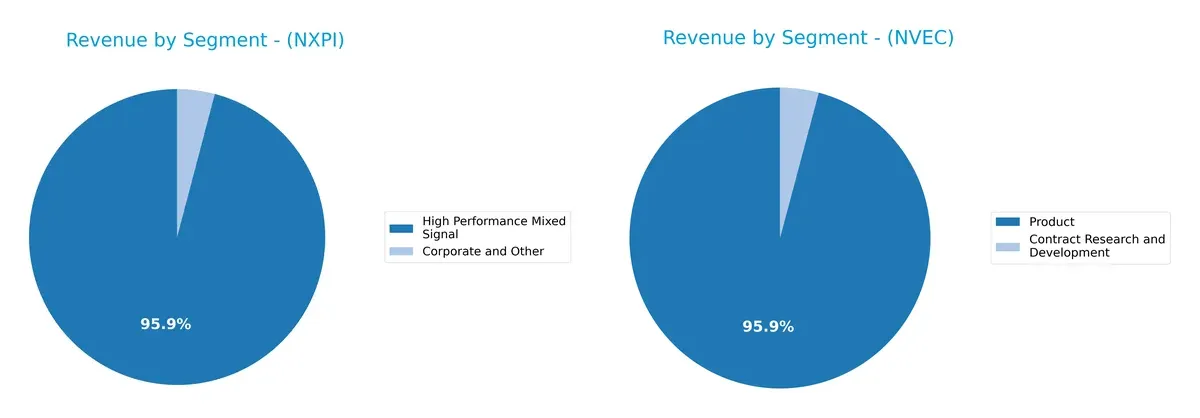
NXP Semiconductors anchors its revenue in High Performance Mixed Signal, generating $9B in 2018, dwarfing its Corporate and Other segment at $385M. Its reliance on this core segment signals infrastructure dominance but poses concentration risk. Conversely, NVE Corporation pivots around its Product segment, roughly $26M in 2022, with Contract Research and Development contributing about $1.1M. NVE’s mix shows modest diversification but remains heavily product-focused, limiting ecosystem lock-in compared to NXP.
Strengths and Weaknesses Comparison
This table compares the Strengths and Weaknesses of NXP Semiconductors N.V. and NVE Corporation:
NXP Semiconductors N.V. Strengths
- Diverse product segments with strong High Performance Mixed Signal sales
- Favorable net margin (16.47%) and ROE (20.1%)
- Solid liquidity with current ratio 2.05 and quick ratio 1.38
- Global exposure including China, US, and Europe
- Favorable fixed asset turnover (4.12) and interest coverage (7.97)
NVE Corporation Strengths
- High profitability with net margin 58.22% and ROE 24.19%
- Excellent ROIC (21.14%) well above WACC
- Very low debt levels with D/E 0.01 and debt-to-assets 1.43%
- Strong quick ratio (22.03) and infinite interest coverage
- Global presence focused on US and Europe
- Favorable fixed asset turnover (8.91)
NXP Semiconductors N.V. Weaknesses
- Unfavorable valuation multiples (PE 27.14, PB 5.45)
- Moderate leverage with D/E 1.22 and 46% debt-to-assets
- Asset turnover low at 0.46, limiting operational efficiency
- Moderate dividend yield 1.87%
- Exposure to geopolitical risks in Asia
NVE Corporation Weaknesses
- Unfavorable current ratio extremely high at 28.4, suggesting asset management issues
- PB ratio unfavorable at 4.95
- Asset turnover low at 0.4, limiting revenue generation efficiency
- Moderate dividend yield 6.28%
Both companies show strong profitability and global reach but differ in financial structure and operational efficiency. NXP balances moderate leverage and liquidity, while NVE excels in profitability with minimal debt but shows potential liquidity management risks. These contrasts impact their strategic focus on growth and capital allocation.
The Moat Duel: Analyzing Competitive Defensibility
A structural moat is the only barrier protecting long-term profits from relentless competition erosion. Here’s how two semiconductor firms compare:
NXP Semiconductors N.V.: Scale and Diversification Moat
NXP leverages broad product diversification and scale, reflected in solid 54% gross margins and 16.5% net margins. However, a declining ROIC trend signals emerging pressure on profitability in 2026.
NVE Corporation: Niche Innovation Moat
NVE’s moat stems from proprietary spintronics technology, driving exceptional 83.6% gross margins and a soaring 58% net margin. Its ROIC growth of 45% underlines a robust, expanding advantage unlike NXP’s declining returns.
Verdict: Diversification vs. Specialized Innovation
NVE’s focused technology and soaring ROIC deliver a deeper moat than NXP’s broad but shrinking profitability. NVE stands better poised to defend and expand its market share in 2026.
Which stock offers better returns?
The past year reveals divergent stock price dynamics for NXP Semiconductors N.V. and NVE Corporation, with notable price declines but recent rebounds indicating shifting momentum.
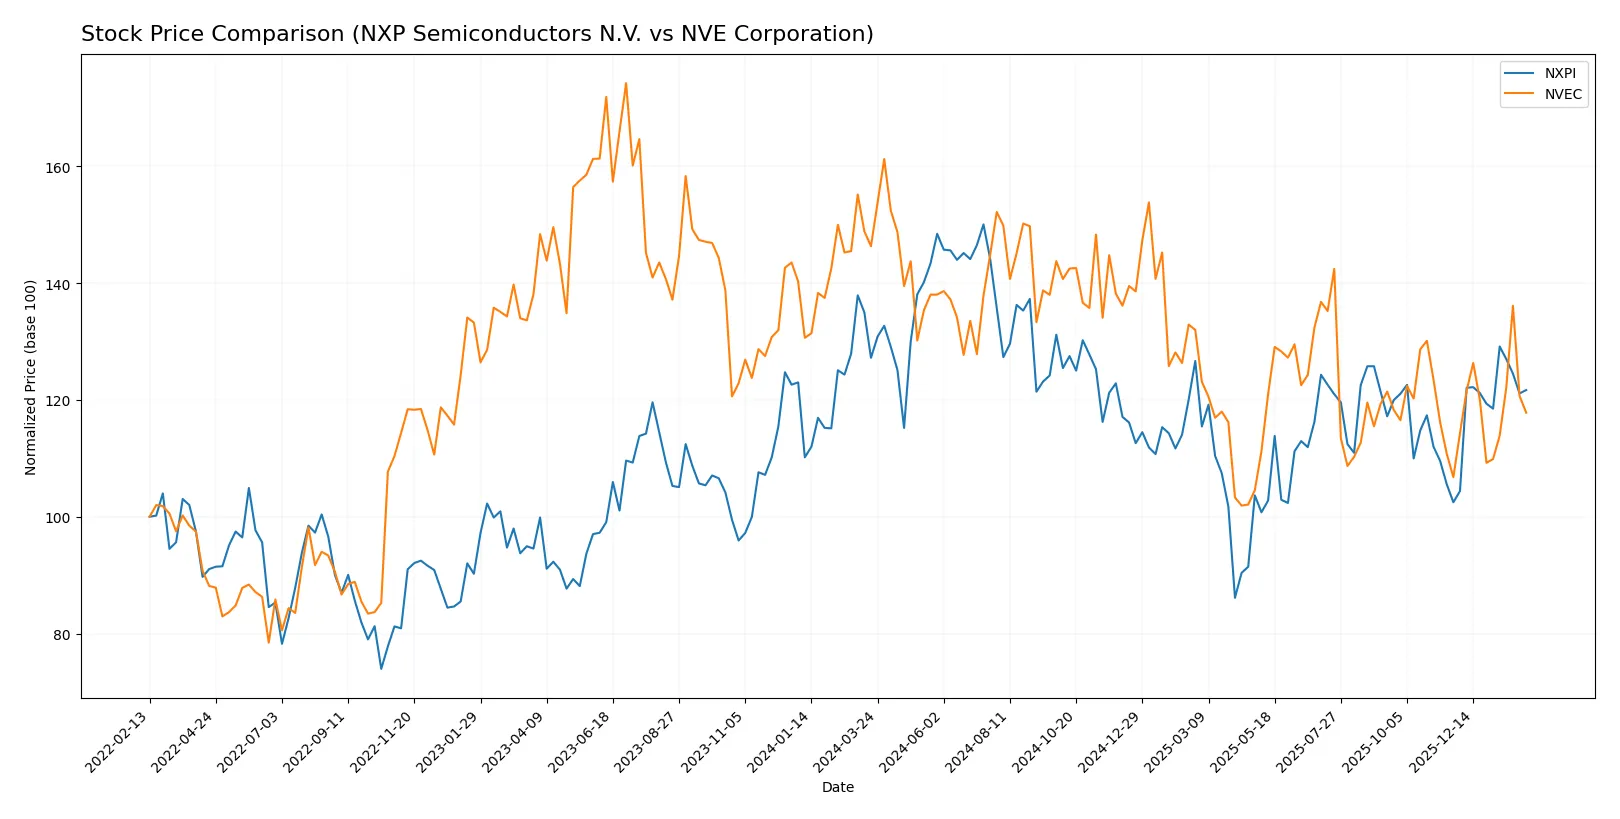
Trend Comparison
NXP Semiconductors N.V. shows a 4.34% price decline over the past 12 months, marking a bearish trend with accelerating downside and a high price volatility (std dev 24.1). Recent months show a sharp 18.75% price rebound.
NVE Corporation’s stock fell 19.48% over the same period, confirming a bearish trend with accelerating losses but lower volatility (std dev 7.56). It also experienced a 10.35% recovery recently, though less steep.
NXP Semiconductors outperformed NVE Corporation in market performance, with a smaller overall decline and a stronger recent upward momentum.
Target Prices
Analysts set a clear target consensus for NXP Semiconductors N.V., reflecting moderate upside potential.
| Company | Target Low | Target High | Consensus |
|---|---|---|---|
| NXP Semiconductors N.V. | 215 | 280 | 250 |
The consensus target of 250 implies roughly 10% upside from the current 227.64 stock price, suggesting cautious optimism. No verified target price data is available for NVE Corporation.

Don’t Let Luck Decide Your Entry Point
Optimize your entry points with our advanced ProRealTime indicators. You’ll get efficient buy signals with precise price targets for maximum performance. Start outperforming now!
How do institutions grade them?
The following tables summarize the latest institutional grades for these two companies:
NXP Semiconductors N.V. Grades
Below are recent grades from established financial institutions for NXP Semiconductors N.V.:
| Grading Company | Action | New Grade | Date |
|---|---|---|---|
| Mizuho | Maintain | Outperform | 2026-02-04 |
| Truist Securities | Maintain | Buy | 2026-02-04 |
| B of A Securities | Maintain | Buy | 2026-02-04 |
| Needham | Maintain | Buy | 2026-02-03 |
| Wells Fargo | Maintain | Overweight | 2026-01-15 |
| Citigroup | Maintain | Buy | 2026-01-15 |
| Truist Securities | Maintain | Buy | 2025-12-19 |
| JP Morgan | Maintain | Neutral | 2025-10-29 |
| Truist Securities | Maintain | Buy | 2025-10-29 |
| Susquehanna | Maintain | Neutral | 2025-07-23 |
NVE Corporation Grades
No reliable institutional grades are available for NVE Corporation.
Which company has the best grades?
NXP Semiconductors N.V. consistently earns strong buy and outperform ratings from multiple reputable firms. NVE Corporation lacks institutional grade data. Investors may view NXP’s broad endorsement as a sign of greater analyst confidence.
Risks specific to each company
The following categories identify critical pressure points and systemic threats facing both firms in the 2026 market environment:
1. Market & Competition
NXP Semiconductors N.V.
- Operates globally in a fiercely competitive semiconductor market with broad product lines.
NVE Corporation
- Niche spintronics market with less direct competition but limited scale and diversification.
2. Capital Structure & Debt
NXP Semiconductors N.V.
- Higher debt-to-equity of 1.22 indicates leverage risk; interest coverage is solid at 7.97x.
NVE Corporation
- Minimal debt with debt-to-equity near zero; balance sheet strength is a clear advantage.
3. Stock Volatility
NXP Semiconductors N.V.
- Beta of 1.458 suggests above-market volatility, reflecting sensitivity to tech cycles.
NVE Corporation
- Beta of 1.219 shows moderate volatility, less exposed to broad market swings.
4. Regulatory & Legal
NXP Semiconductors N.V.
- Faces global regulatory complexities due to international footprint and product diversity.
NVE Corporation
- Smaller scale limits regulatory burden but could face niche compliance risks in medical/industrial sectors.
5. Supply Chain & Operations
NXP Semiconductors N.V.
- Complex global supply chain increases exposure to disruptions and geopolitical trade tensions.
NVE Corporation
- More localized operations reduce supply chain risk but increase dependence on key suppliers.
6. ESG & Climate Transition
NXP Semiconductors N.V.
- Large footprint demands aggressive ESG compliance and climate risk mitigation.
NVE Corporation
- Smaller scale enables agility but less public ESG pressure; risk of lagging on sustainability initiatives.
7. Geopolitical Exposure
NXP Semiconductors N.V.
- Significant exposure to China and Europe poses geopolitical and trade risks.
NVE Corporation
- Primarily U.S.-based, limiting direct geopolitical risk but sensitive to domestic policy changes.
Which company shows a better risk-adjusted profile?
NVE Corporation’s minimal debt and stronger balance sheet reduce financial risk significantly. However, niche market exposure may limit growth. NXP Semiconductors faces higher leverage and geopolitical complexity but benefits from scale and diversification. NVE’s risk-adjusted profile appears stronger due to financial prudence and lower external volatility, despite its smaller size. The stark contrast in debt levels—NXPI’s 1.22 D/E versus NVEC’s near zero—justifies concern over NXPI’s leverage amid a volatile semiconductor cycle.
Final Verdict: Which stock to choose?
NXP Semiconductors N.V. (NXPI) impresses with its operational efficiency and solid cash flow generation. Its main point of vigilance is a declining return on invested capital, signaling potential value erosion. NXPI suits investors seeking exposure to a mature semiconductor with mixed growth signals, fitting an Aggressive Growth portfolio.
NVE Corporation (NVEC) boasts a strong strategic moat driven by superior return on invested capital and minimal debt. Its financial safety profile surpasses NXPI, with robust profitability and a very favorable moat indicating sustainable competitive advantage. NVEC aligns well with a GARP (Growth at a Reasonable Price) investor seeking stability and quality growth.
If you prioritize operational efficiency and are comfortable with some margin of risk, NXPI is a compelling choice due to its cash generation capabilities. However, if you seek superior profitability with greater financial stability and a durable moat, NVEC offers better long-term value creation and risk-adjusted potential. Both present distinct analytical scenarios depending on your risk tolerance and investment horizon.
Disclaimer: Investment carries a risk of loss of initial capital. The past performance is not a reliable indicator of future results. Be sure to understand risks before making an investment decision.
Go Further
I encourage you to read the complete analyses of NXP Semiconductors N.V. and NVE Corporation to enhance your investment decisions: