Home > Comparison > Technology > NVDA vs NVEC
The strategic rivalry between NVIDIA Corporation and NVE Corporation shapes the semiconductor sector’s innovation and growth. NVIDIA dominates as a capital-intensive technology powerhouse with diverse GPU, AI, and data center applications. In contrast, NVE operates as a niche, high-precision spintronics specialist targeting sensors for industrial IoT and medical devices. This analysis will identify which company’s trajectory offers superior risk-adjusted potential for a diversified portfolio amid evolving tech demands.
Table of contents
Companies Overview
NVIDIA and NVE Corporation stand as contrasting pillars in the semiconductor market, each with a distinct technological edge.
NVIDIA Corporation: The AI and Graphics Powerhouse
NVIDIA dominates as a leading semiconductor giant, primarily generating revenue from its Graphics and Compute segments. It sells GPUs used in gaming, AI data centers, and automotive AI platforms. In 2026, NVIDIA’s strategic focus leans heavily on expanding AI computing and cloud gaming infrastructure, positioning itself at the forefront of high-performance computing innovation.
NVE Corporation: Spintronics Innovator
NVE Corporation operates in a specialized niche, developing spintronic sensors and couplers used mainly in factory automation and medical devices. This micro-cap player generates revenue through product sales and licensing of spintronic memory technology. Its 2026 strategy centers on advancing spintronic applications for industrial IoT and medical markets, emphasizing cutting-edge nanotechnology.
Strategic Collision: Similarities & Divergences
While both companies innovate within semiconductors, NVIDIA pursues a broad AI and graphics ecosystem, contrasting with NVE’s focused spintronics approach. Their primary battleground is technology depth versus niche specialization. NVIDIA’s scale offers expansive market reach, whereas NVE appeals to specialized industrial and medical applications, creating distinct risk and growth profiles for investors.
Income Statement Comparison
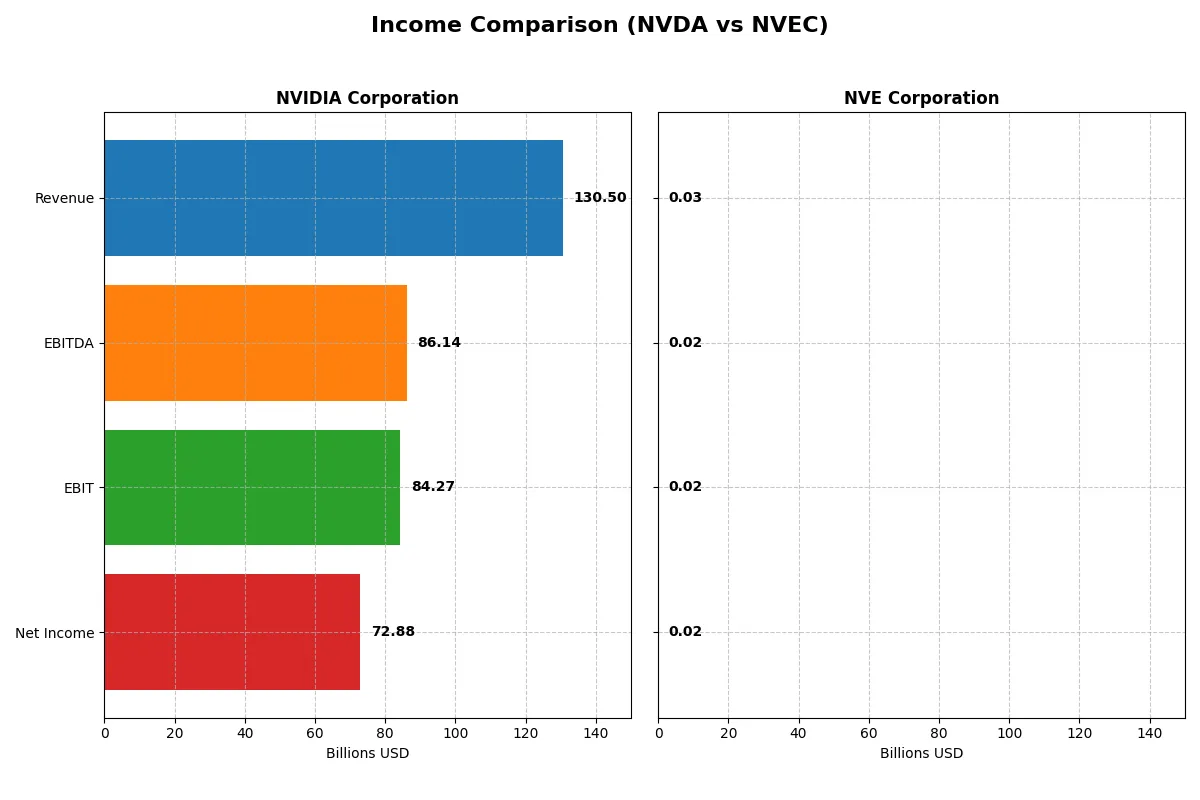
The following data dissects the core profitability and scalability of both corporate engines to reveal who dominates the bottom line:
| Metric | NVIDIA Corporation (NVDA) | NVE Corporation (NVEC) |
|---|---|---|
| Revenue | 130.5B | 26M |
| Cost of Revenue | 32.6B | 4.2M |
| Operating Expenses | 16.4B | 5.6M |
| Gross Profit | 97.9B | 22M |
| EBITDA | 86.1B | 16.3M |
| EBIT | 84.3B | 16M |
| Interest Expense | 247M | 0 |
| Net Income | 72.9B | 15.1M |
| EPS | 2.97 | 3.12 |
| Fiscal Year | 2025 | 2025 |
Income Statement Analysis: The Bottom-Line Duel
The income statement comparison reveals which company drives its business with greater revenue growth and profitability efficiency.
NVIDIA Corporation Analysis
NVIDIA’s revenue surged from $27B in 2021 to $130B in 2025, reflecting a remarkable 683% growth. Net income exploded even faster, rising over 15x to $73B. Gross margin remains robust near 75%, while net margin improved to 56%, signaling exceptional cost control. In 2025, NVIDIA’s operating income efficiency and margin expansion demonstrate dominant momentum in a high-growth cycle.
NVE Corporation Analysis
NVE’s revenue grew modestly by 21% over five years, peaking at $26M in 2025 after a recent 13% decline. Net income increased 29% to $15M with a solid net margin above 58%. Gross margin stands out at 84%, indicating strong production leverage. However, the recent dip in revenue and EBIT by over 13% signals emerging headwinds, tempering momentum despite healthy profitability ratios.
Verdict: Explosive Scale vs. Stable Profitability
NVIDIA delivers explosive scale and margin expansion, dwarfing NVE’s modest growth and stable profitability. NVIDIA’s superior revenue and net income growth rates highlight a powerful corporate engine with dominant operational leverage. For investors, NVIDIA’s profile offers high-growth potential, while NVE appeals as a steady, margin-focused player facing recent growth challenges.
Financial Ratios Comparison
These vital ratios act as a diagnostic tool to expose the underlying fiscal health, valuation premiums, and capital efficiency of these two companies:
| Ratios | NVIDIA Corporation (NVDA) | NVE Corporation (NVEC) |
|---|---|---|
| ROE | 91.9% | 24.2% |
| ROIC | 75.3% | 21.1% |
| P/E | 39.9 | 20.5 |
| P/B | 36.7 | 4.95 |
| Current Ratio | 4.44 | 28.4 |
| Quick Ratio | 3.88 | 22.0 |
| D/E | 0.13 | 0.015 |
| Debt-to-Assets | 9.2% | 1.4% |
| Interest Coverage | 330 | 0 |
| Asset Turnover | 1.17 | 0.40 |
| Fixed Asset Turnover | 16.2 | 8.91 |
| Payout Ratio | 1.1% | 128.4% |
| Dividend Yield | 0.029% | 6.28% |
| Fiscal Year | 2025 | 2025 |
Efficiency & Valuation Duel: The Vital Signs
Financial ratios serve as a company’s DNA, uncovering hidden risks and operational strengths that numbers alone cannot reveal.
NVIDIA Corporation
NVIDIA posts an exceptional 92% ROE and a robust 56% net margin, signaling strong profitability and operational excellence. Its P/E ratio at 39.9 marks the stock as expensive compared to benchmarks. Despite a modest 0.03% dividend yield, NVIDIA reinvests heavily in R&D, fueling growth and maintaining its competitive moat.
NVE Corporation
NVE delivers a solid 24% ROE and a slightly higher 58% net margin, reflecting efficient core operations. The P/E ratio of 20.46 suggests a fair valuation relative to earnings. NVE offers a meaningful 6.28% dividend yield, balancing shareholder returns with moderate reinvestment, highlighting a more income-focused capital allocation.
Premium Valuation vs. Income Stability
NVIDIA commands a premium valuation justified by superior returns and aggressive growth investment. NVE provides a steadier income profile with lower valuation multiples and a strong dividend yield. Investors seeking growth may lean toward NVIDIA, while those prioritizing income and valuation discipline might prefer NVE.
Which one offers the Superior Shareholder Reward?
I compare NVIDIA and NVE’s distribution philosophies in 2026. NVIDIA yields a minuscule 0.03%, with a 1.1% payout ratio, signaling minimal dividends covered by nearly 95% of free cash flow. NVIDIA’s moderate buyback activity complements its modest yield, reflecting a growth-focused reinvestment strategy. Conversely, NVE offers a hefty 6.3% yield, but with payout ratios above 100%, suggesting dividends rely heavily on cash reserves. NVE’s aggressive dividends overshadow its share buybacks, indicating a mature, income-oriented model. Given NVIDIA’s robust free cash flow coverage and balanced capital allocation, I favor it for sustainable total returns over NVE’s riskier, high-yield approach.
Comparative Score Analysis: The Strategic Profile
The radar chart reveals the fundamental DNA and key trade-offs between NVIDIA Corporation and NVE Corporation:
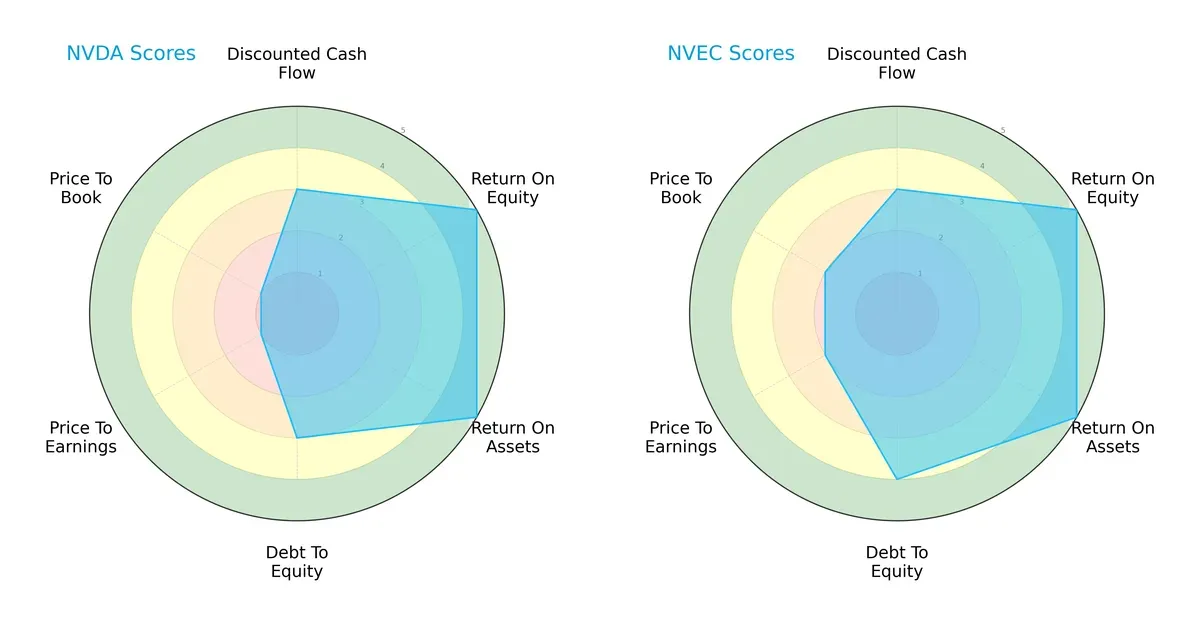
NVIDIA and NVE both excel in return on equity (ROE) and return on assets (ROA), scoring a perfect 5 each. However, NVE holds a more balanced financial profile with a stronger debt-to-equity score (4 vs. 3) and better valuation scores (P/E and P/B at 2 vs. 1). NVIDIA leans heavily on operational efficiency but suffers from unfavorable valuation metrics, suggesting market concerns about price levels relative to fundamentals.
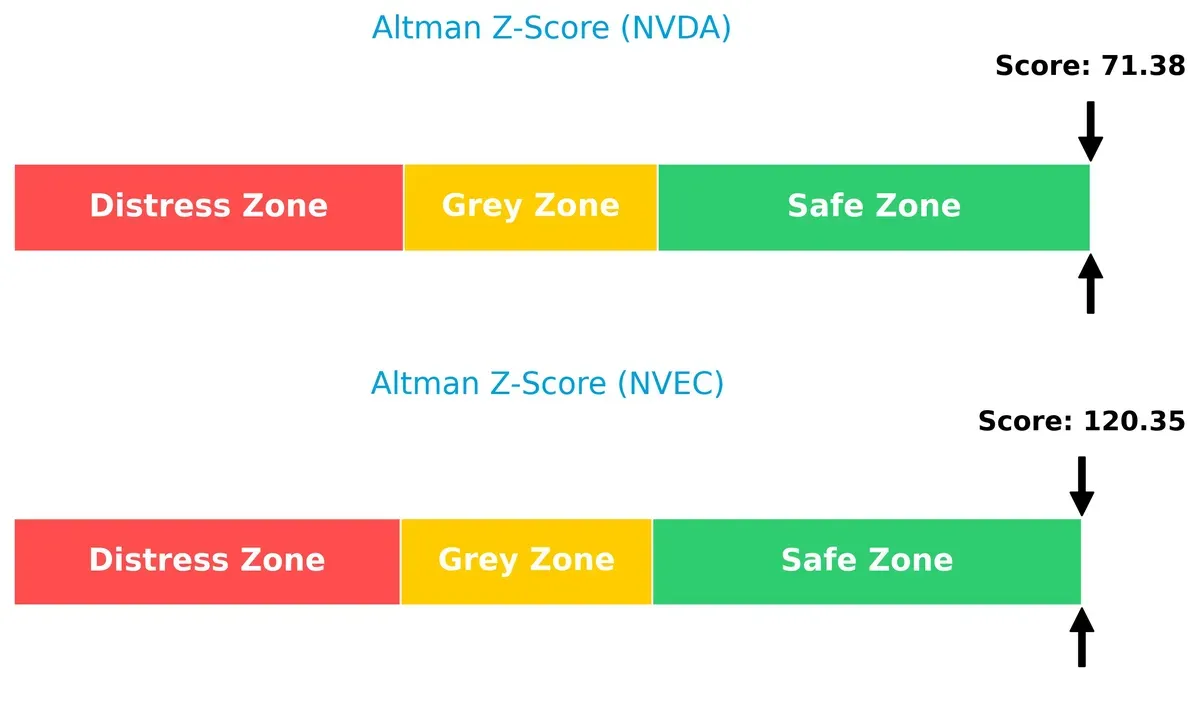
Bankruptcy Risk: Solvency Showdown
NVE’s Altman Z-Score of 120.4 far outpaces NVIDIA’s 71.4, both securely in the safe zone, signaling robust solvency and low bankruptcy risk in this cycle:
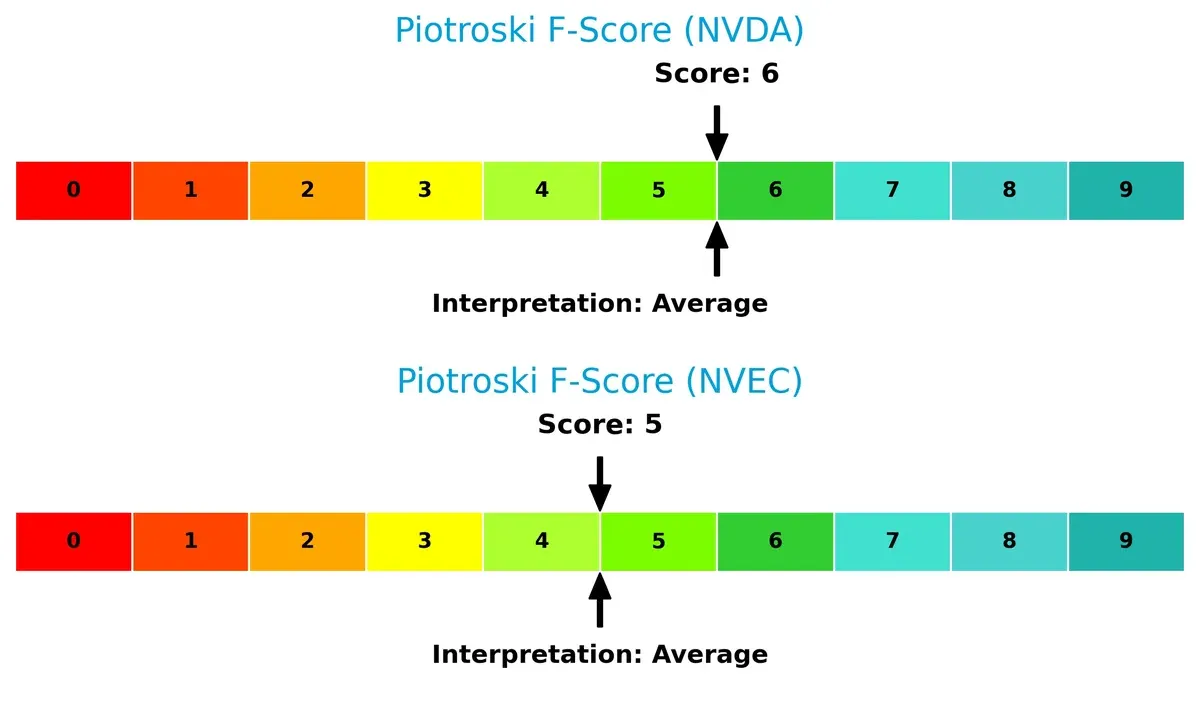
Financial Health: Quality of Operations
NVIDIA scores a 6 while NVE holds a 5 on the Piotroski F-Score scale, indicating both companies maintain average financial health, but NVIDIA slightly edges ahead in operational quality with fewer red flags:
How are the two companies positioned?
This section dissects the operational DNA of NVIDIA and NVE by comparing their revenue distribution and internal dynamics. The goal is to confront their economic moats and identify the most resilient, sustainable advantage today.
Revenue Segmentation: The Strategic Mix
This comparison dissects how NVIDIA Corporation and NVE Corporation diversify income streams and reveals their primary sector bets:
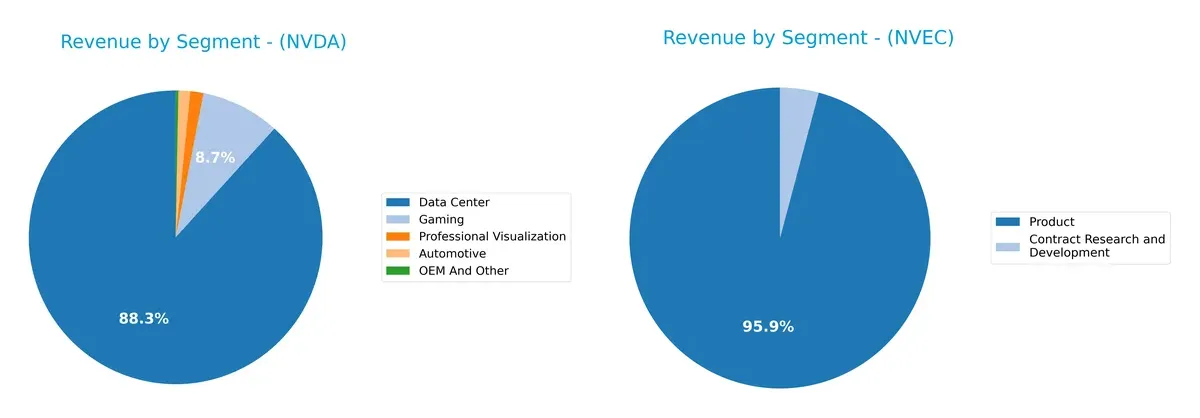
NVIDIA dwarfs NVE with a $115B Data Center segment anchoring its revenue, complemented by $11.3B Gaming and $1.7B Automotive streams. NVIDIA’s mix, though concentrated, pivots on high-growth tech ecosystems. NVE relies heavily on a $25.9M Product segment, with minimal $1.1M Contract R&D revenue. NVE’s narrow base signals higher concentration risk, while NVIDIA’s dominant segment strategy reflects infrastructure dominance and ecosystem lock-in.
Strengths and Weaknesses Comparison
This table compares the strengths and weaknesses of NVIDIA Corporation and NVE Corporation:
NVIDIA Corporation Strengths
- Strong profitability with 55.85% net margin and 91.87% ROE
- High ROIC of 75.28% well above WACC
- Diversified product portfolio including Data Center and Gaming
- Global presence with significant revenue from U.S., Taiwan, and China
- Low debt-to-assets ratio at 9.2% supports financial stability
NVE Corporation Strengths
- Solid profitability with 58.22% net margin and favorable ROE of 24.19%
- Low debt-to-assets ratio at 1.43% and infinite interest coverage
- High current and quick ratios indicate strong liquidity
- Global sales with presence in U.S., Europe, and Asia Pacific
- Product and contract research diversification
NVIDIA Corporation Weaknesses
- Unfavorable current ratio at 4.44 may signal excess short-term assets
- Elevated P/E and P/B ratios suggest high market valuation risk
- WACC at 14.73% is relatively high compared to ROIC
- Minimal dividend yield at 0.03% limits income appeal
- Concentration risk with heavy reliance on Data Center segment
NVE Corporation Weaknesses
- Extremely high current ratio at 28.4 could indicate inefficient asset use
- Unfavorable asset turnover at 0.4 points to lower operational efficiency
- P/B ratio at 4.95 is unfavorable, raising valuation concerns
- Dividend yield neutral at 6.28%, less consistent profitability signal
- Less diversified revenue base compared to NVIDIA
NVIDIA exhibits robust profitability and global diversification but faces valuation and liquidity efficiency concerns. NVE shows strong liquidity and low leverage but struggles with asset utilization and narrower diversification. Both companies maintain favorable overall financial health, reflecting distinct strategic focuses.
The Moat Duel: Analyzing Competitive Defensibility
A structural moat is the only barrier that protects long-term profits from relentless competitive erosion. Let’s examine how these two firms defend their turf:
NVIDIA Corporation: Dominant Network Effects and Innovation Powerhouse
NVIDIA’s moat stems from powerful network effects in AI and gaming GPUs, reflected by a stellar ROIC 60.6% above WACC and margin stability near 65%. Its expanding data center and automotive AI markets deepen this moat in 2026.
NVE Corporation: Niche Intangible Assets in Spintronics
NVE relies on specialized spintronic technology, a narrow intangible asset moat. While its ROIC exceeds WACC by 11.6%, growth lags and recent revenue declines limit its competitive momentum compared to NVIDIA’s scale and innovation.
Verdict: Network Effects vs. Niche Tech Asset
NVIDIA’s moat is wider and deeper, driven by explosive growth, high capital efficiency, and scalable innovation. NVE’s moat, though sustainable, remains narrow and vulnerable. NVIDIA is far better positioned to defend and expand market share.
Which stock offers better returns?
The past year saw NVIDIA’s stock more than double, showing strong gains despite recent deceleration. NVE’s shares declined overall but have picked up modestly in the latest months.
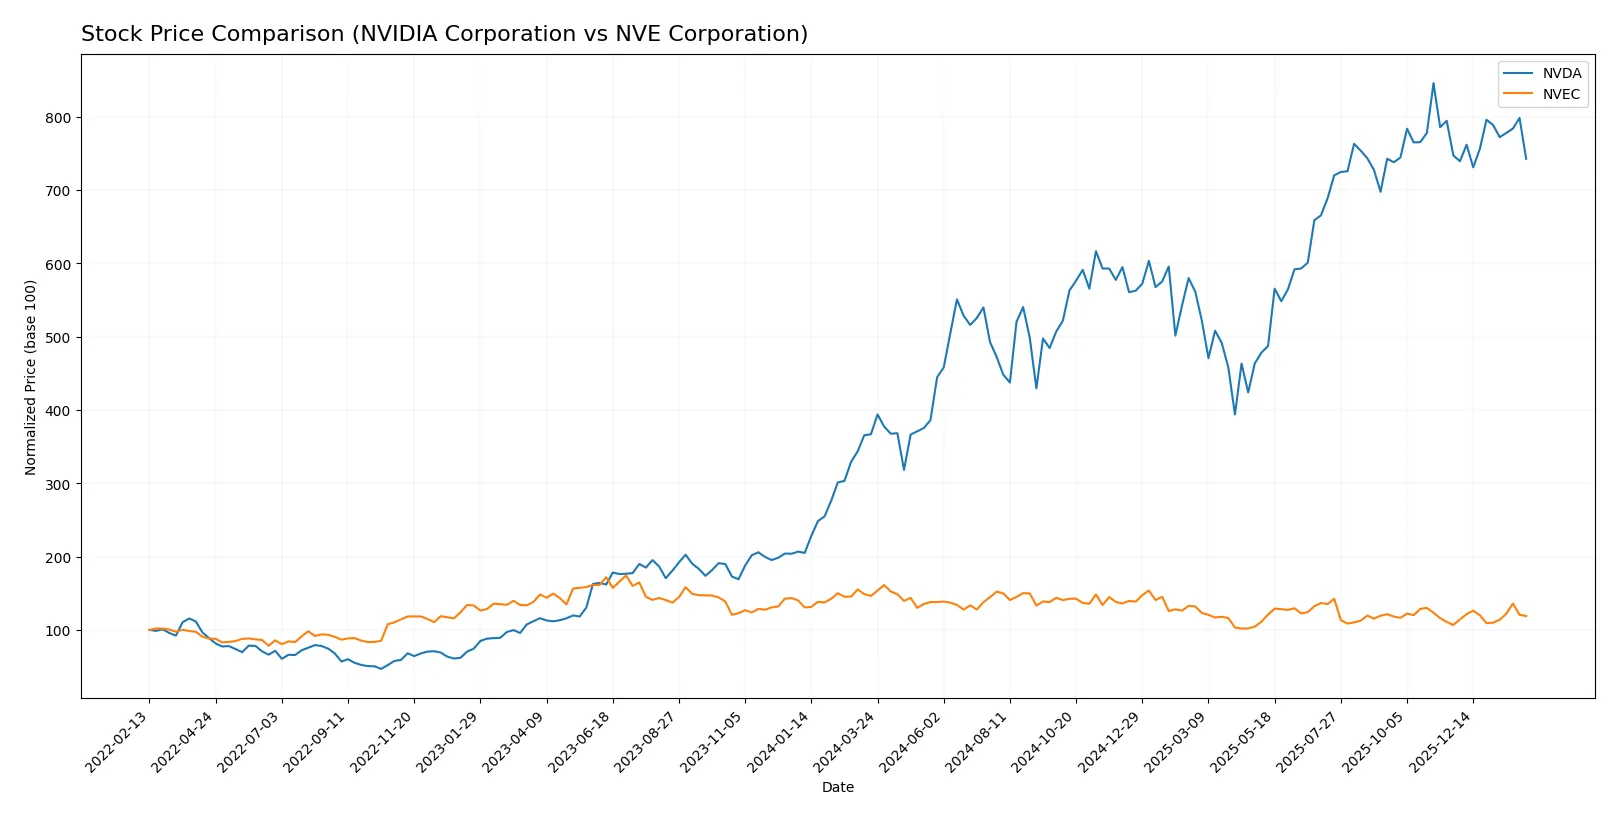
Trend Comparison
NVIDIA’s stock rose 102.41% over the past year, marking a bullish trend with decelerating momentum. It reached a high of 202.49 and a low of 76.2, showing elevated volatility at 32.09.
NVE’s stock declined 18.71% over the same period, reflecting a bearish trend with accelerating downside. It traded between 56.99 and 90.18, with moderate volatility at 7.55.
NVIDIA clearly outperformed NVE in market returns, delivering strong bullish gains compared to NVE’s prolonged bearish trend despite recent slight recovery.
Target Prices
Analysts set a broad target consensus for NVIDIA Corporation, reflecting strong growth expectations.
| Company | Target Low | Target High | Consensus |
|---|---|---|---|
| NVIDIA Corporation | 140 | 352 | 265.21 |
The consensus target of 265.21 suggests a 49% upside from the current price of 177.76, signaling robust confidence despite recent volatility. No verified target price data is available for NVE Corporation.

Don’t Let Luck Decide Your Entry Point
Optimize your entry points with our advanced ProRealTime indicators. You’ll get efficient buy signals with precise price targets for maximum performance. Start outperforming now!
How do institutions grade them?
The institutional grades for NVIDIA Corporation and NVE Corporation are as follows:
NVIDIA Corporation Grades
Below is a summary of recent ratings from reputable grading firms for NVIDIA Corporation.
| Grading Company | Action | New Grade | Date |
|---|---|---|---|
| Jefferies | Maintain | Buy | 2026-01-16 |
| Mizuho | Maintain | Outperform | 2026-01-09 |
| Truist Securities | Maintain | Buy | 2025-12-29 |
| Stifel | Maintain | Buy | 2025-12-29 |
| Baird | Maintain | Outperform | 2025-12-26 |
| Bernstein | Maintain | Outperform | 2025-12-26 |
| B of A Securities | Maintain | Buy | 2025-12-26 |
| Truist Securities | Maintain | Buy | 2025-12-19 |
| Tigress Financial | Maintain | Strong Buy | 2025-12-18 |
| Morgan Stanley | Maintain | Overweight | 2025-12-01 |
Which company has the best grades?
NVIDIA Corporation has multiple consistent Buy and Outperform grades, including a Strong Buy, while NVE Corporation lacks institutional grades. This disparity may influence investor confidence and perceived risk.
Risks specific to each company
The following categories identify critical pressure points and systemic threats facing NVIDIA Corporation and NVE Corporation in the 2026 market environment:
1. Market & Competition
NVIDIA Corporation
- Dominates with strong AI and gaming GPU market share but faces intense competition from AMD and Intel.
NVE Corporation
- Niche player in spintronics with limited scale and exposure to factory automation market competition.
2. Capital Structure & Debt
NVIDIA Corporation
- Maintains low debt-to-equity (0.13), strong interest coverage (341x), signaling financial strength.
NVE Corporation
- Extremely low debt (0.01 D/E) and infinite interest coverage, reflecting very conservative leverage.
3. Stock Volatility
NVIDIA Corporation
- High beta (2.31) indicates elevated volatility, typical in semiconductor growth leaders.
NVE Corporation
- Moderate beta (1.22) suggests lower market sensitivity and more stable price swings.
4. Regulatory & Legal
NVIDIA Corporation
- Faces heightened scrutiny on AI export controls and geopolitical regulatory risks.
NVE Corporation
- Limited regulatory exposure due to smaller scale and specialized product range.
5. Supply Chain & Operations
NVIDIA Corporation
- Complex global supply chain vulnerable to component shortages and geopolitical disruptions.
NVE Corporation
- Smaller operations with localized supply chain, reducing complexity but increasing dependence on few suppliers.
6. ESG & Climate Transition
NVIDIA Corporation
- Increasing focus on energy-efficient products and carbon footprint reduction amid tech sector pressures.
NVE Corporation
- ESG efforts less visible but potential risk as industrial IoT markets demand sustainable solutions.
7. Geopolitical Exposure
NVIDIA Corporation
- Significant exposure to US-China tensions impacting semiconductor manufacturing and sales.
NVE Corporation
- Minimal direct geopolitical risk due to smaller international footprint and niche markets.
Which company shows a better risk-adjusted profile?
NVE Corporation’s lower volatility, minimal debt, and niche market focus present a more stable risk profile. NVIDIA’s dominant position is tempered by high market volatility and geopolitical risk. NVE’s conservative financials contrast with NVIDIA’s premium valuation and regulatory challenges. Recent data show NVIDIA’s beta at 2.31 versus NVE’s 1.22, underscoring NVIDIA’s higher market risk. NVE’s debt-to-equity ratio of 0.01 versus NVIDIA’s 0.13 signals stronger balance sheet conservatism. Overall, NVE offers a clearer risk-adjusted profile in 2026’s uncertain semiconductor landscape.
Final Verdict: Which stock to choose?
NVIDIA Corporation’s superpower lies in its relentless innovation and commanding moat in high-performance computing. Its exceptional ROIC well above WACC signals strong value creation. However, its sky-high valuation multiples and stretched current ratio warrant caution. It suits aggressive growth portfolios willing to pay a premium for market leadership and scalability.
NVE Corporation offers a solid strategic moat with stable recurring revenue and impressive cash flow yield. Its conservative capital structure and attractive dividend yield provide a safety cushion lacking in NVIDIA. Despite slower recent growth and a more modest ROIC, it fits growth-at-a-reasonable-price (GARP) portfolios seeking resilience and income alongside moderate appreciation.
If you prioritize disruptive growth and long-term dominance, NVIDIA outshines due to its superior capital efficiency and innovation edge. However, if you seek stability with steady income and lower valuation risk, NVE offers better stability and a compelling value proposition. Each appeals to distinct investor profiles balancing growth ambition against risk tolerance.
Disclaimer: Investment carries a risk of loss of initial capital. The past performance is not a reliable indicator of future results. Be sure to understand risks before making an investment decision.
Go Further
I encourage you to read the complete analyses of NVIDIA Corporation and NVE Corporation to enhance your investment decisions: