Home > Comparison > Technology > NVMI vs NVEC
The strategic rivalry between Nova Ltd. and NVE Corporation shapes the semiconductor sector’s innovation frontier. Nova Ltd. operates as a capital-intensive process control system leader, serving global chip manufacturers. In contrast, NVE Corporation specializes in niche spintronic sensor technology with a leaner operational footprint. This head-to-head pits broad market scale against specialized innovation. My analysis will reveal which company presents a superior risk-adjusted profile for a diversified technology portfolio.
Table of contents
Companies Overview
Nova Ltd. and NVE Corporation stand as influential players in the semiconductor industry, each shaping niche technology markets.
Nova Ltd.: Precision Metrology Pioneer
Nova Ltd. dominates semiconductor process control systems, generating revenue by selling metrology platforms worldwide. Its core business centers on dimensional and chemical measurements critical to chip manufacturing. In 2026, the company focused on expanding advanced packaging and lithography solutions, reinforcing its competitive edge in integrated circuit production.
NVE Corporation: Spintronics Innovator
NVE Corporation leads in spintronic devices, earning revenue through specialized sensors and couplers for factory automation and medical applications. The company’s competitive advantage lies in nanotechnology that harnesses electron spin for data transmission. In 2026, NVE prioritized industrial IoT applications and research licensing, aiming to broaden its technology’s commercial footprint.
Strategic Collision: Similarities & Divergences
Both firms operate in semiconductors but diverge sharply in technology focus—Nova targets process control with metrology, while NVE bets on spintronics and IoT. Their primary battleground is technology innovation for semiconductor manufacturing efficiency versus sensor integration. Nova offers scale and platform breadth; NVE delivers niche, high-tech specialization, defining distinct investment profiles in a competitive sector.
Income Statement Comparison
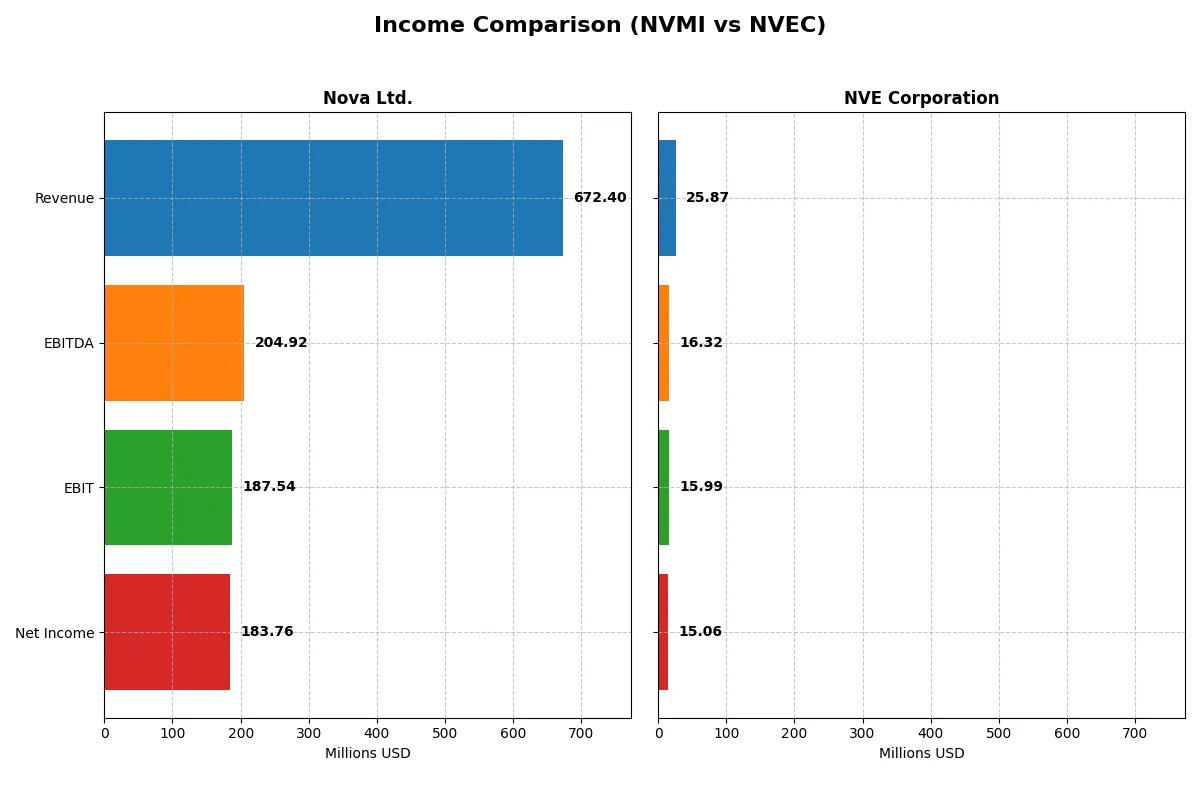
The following data dissects the core profitability and scalability of both corporate engines to reveal who dominates the bottom line:
| Metric | Nova Ltd. (NVMI) | NVE Corporation (NVEC) |
|---|---|---|
| Revenue | 672M | 26M |
| Cost of Revenue | 285M | 4.2M |
| Operating Expenses | 200M | 5.6M |
| Gross Profit | 387M | 22M |
| EBITDA | 205M | 16M |
| EBIT | 188M | 16M |
| Interest Expense | 1.6M | 0 |
| Net Income | 184.9M | 15.1M |
| EPS | 6.31 | 3.12 |
| Fiscal Year | 2024 | 2025 |
Income Statement Analysis: The Bottom-Line Duel
This income statement comparison exposes the true operational efficiency and profitability dynamics of two distinct corporate engines.
Nova Ltd. Analysis
Nova Ltd. demonstrates a robust revenue surge from $269M in 2020 to $672M in 2024, with net income tripling from $48M to $185M. Its gross margin stands strong at 57.6%, while the net margin holds a healthy 27.3%. The 2024 fiscal year shows impressive momentum, with revenue and net income growth rates exceeding 29% and 34%, respectively, reflecting operational leverage and disciplined cost control.
NVE Corporation Analysis
NVE Corporation maintains higher margin dominance with an 83.6% gross margin and an exceptional net margin of 58.2% in 2025. However, revenue declined 13.2% year-over-year to $26M, and net income fell 12.2% to $15M. Despite this short-term setback, NVE sustains strong overall growth with a 21.1% revenue increase and nearly 29% net income growth over five years, supported by its superior EBIT margin of 61.8%.
Margin Strength vs. Growth Velocity
Nova Ltd. outpaces NVE Corporation in revenue and net income growth, reflecting aggressive scale expansion and margin improvement. Conversely, NVE commands superior profitability metrics but faces recent revenue contraction. For investors, Nova presents a high-growth profile leveraging expanding operations, while NVE offers a stable, high-margin business with some short-term headwinds to monitor.
Financial Ratios Comparison
These vital ratios act as a diagnostic tool to expose the underlying fiscal health, valuation premiums, and capital efficiency of the companies compared below:
| Ratios | Nova Ltd. (NVMI) | NVE Corporation (NVEC) |
|---|---|---|
| ROE | 19.8% | 24.2% |
| ROIC | 13.4% | 21.1% |
| P/E | 31.2 | 20.5 |
| P/B | 6.18 | 4.95 |
| Current Ratio | 2.32 | 28.40 |
| Quick Ratio | 1.92 | 22.03 |
| D/E | 0.25 | 0.01 |
| Debt-to-Assets | 17.0% | 1.4% |
| Interest Coverage | 116.2 | N/A |
| Asset Turnover | 0.48 | 0.40 |
| Fixed Asset Turnover | 5.06 | 8.91 |
| Payout Ratio | 0 | 128% |
| Dividend Yield | 0% | 6.28% |
| Fiscal Year | 2024 | 2025 |
Efficiency & Valuation Duel: The Vital Signs
Ratios act as the company’s DNA, revealing hidden risks and operational excellence through key profitability and valuation metrics.
Nova Ltd.
Nova Ltd. posts a solid 19.8% ROE and a strong 27.3% net margin, signaling robust profitability. The stock trades at a stretched P/E of 31.2 and a high P/B of 6.18, indicating expensive valuation. Nova returns value mainly through reinvestment, dedicating 16.4% of sales to R&D, with no dividend payout.
NVE Corporation
NVE Corporation displays superior profitability with a 24.2% ROE and an impressive 58.2% net margin. Its valuation is more reasonable, with a P/E of 20.5 but a slightly elevated P/B of 4.95. NVE rewards shareholders with a 6.3% dividend yield, balancing growth investment and income distribution effectively.
Operational Strength vs. Valuation Discipline
Nova Ltd. features strong profitability but commands a premium valuation, relying on R&D over dividends. NVE Corporation offers higher returns with a fairer price and consistent dividends. Investors seeking income and valuation discipline may prefer NVE’s profile, while growth-focused investors might lean toward Nova’s reinvestment strategy.
Which one offers the Superior Shareholder Reward?
Nova Ltd. (NVMI) does not pay dividends but reinvests heavily in growth, with a strong free cash flow yield of 3.7% and minimal debt. NVE Corporation (NVEC) offers a 4.5% dividend yield, with a payout ratio around 113%, suggesting aggressive distributions supported by stable cash flows. NVEC’s consistent dividend and modest buybacks provide immediate income, while NVMI’s strategy prioritizes capital allocation for long-term value. Given NVEC’s attractive yield and sustainable payout coverage, I judge NVE Corporation offers the superior total shareholder return profile in 2026.
Comparative Score Analysis: The Strategic Profile
The radar chart reveals the fundamental DNA and trade-offs of Nova Ltd. and NVE Corporation, showcasing their distinct financial strengths and vulnerabilities:
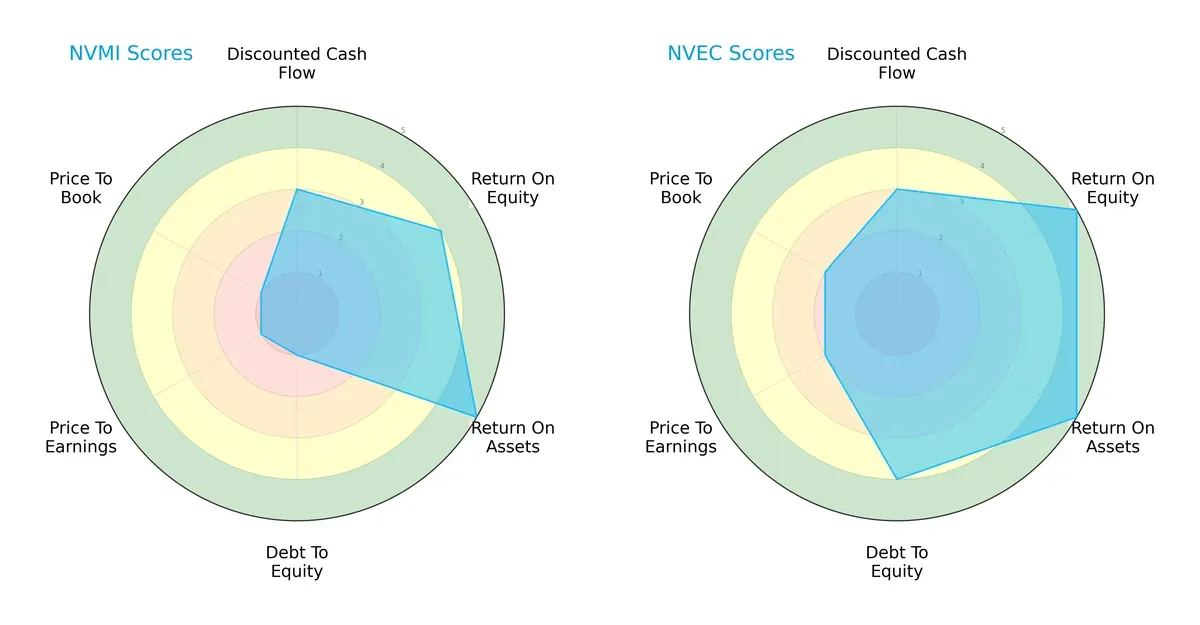
Nova Ltd. shows strong asset efficiency (ROA 5) and decent equity returns (ROE 4) but struggles with leverage and valuation (Debt/Equity 1, PE/PB 1). NVE Corporation presents a more balanced profile with superior ROE (5), solid debt management (Debt/Equity 4), and moderate valuation scores (PE 2, PB 2). NVE relies on consistent profitability and risk control, while Nova depends heavily on operational efficiency but faces financial risk and valuation headwinds.
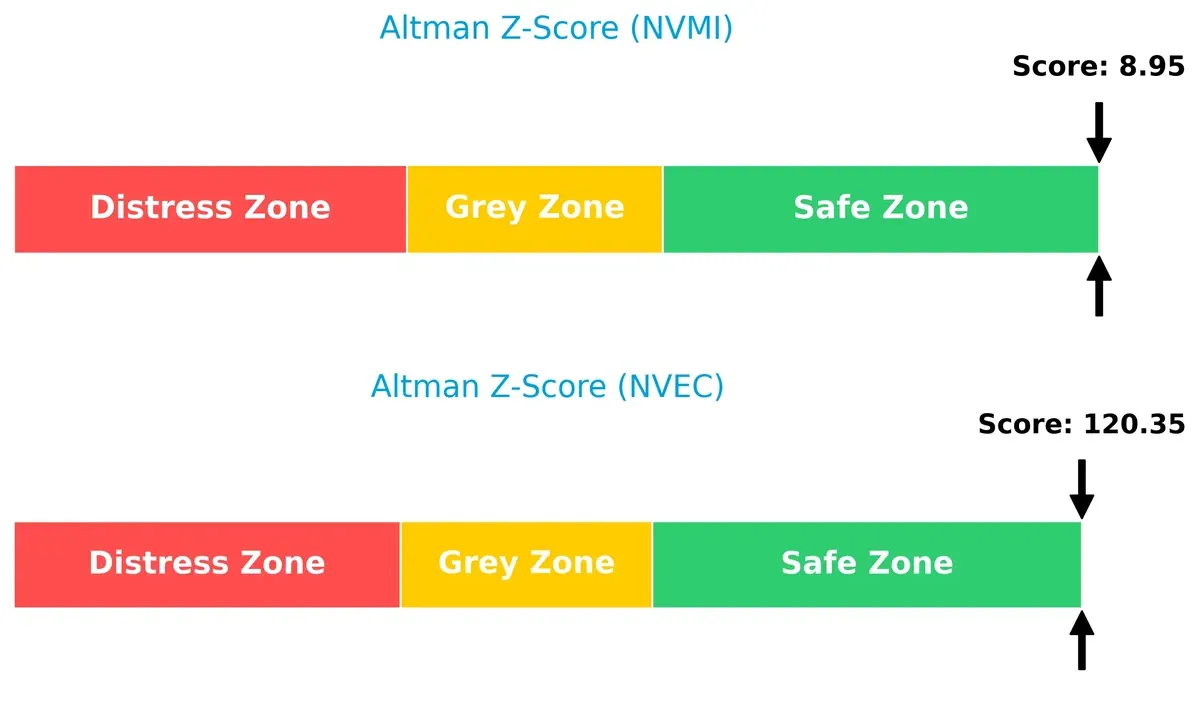
Bankruptcy Risk: Solvency Showdown
The Altman Z-Scores indicate both firms are in the safe zone, but NVE Corporation’s score (120.35) far exceeds Nova Ltd.’s (8.95), signaling a vastly stronger solvency position and lower bankruptcy risk in the current cycle:
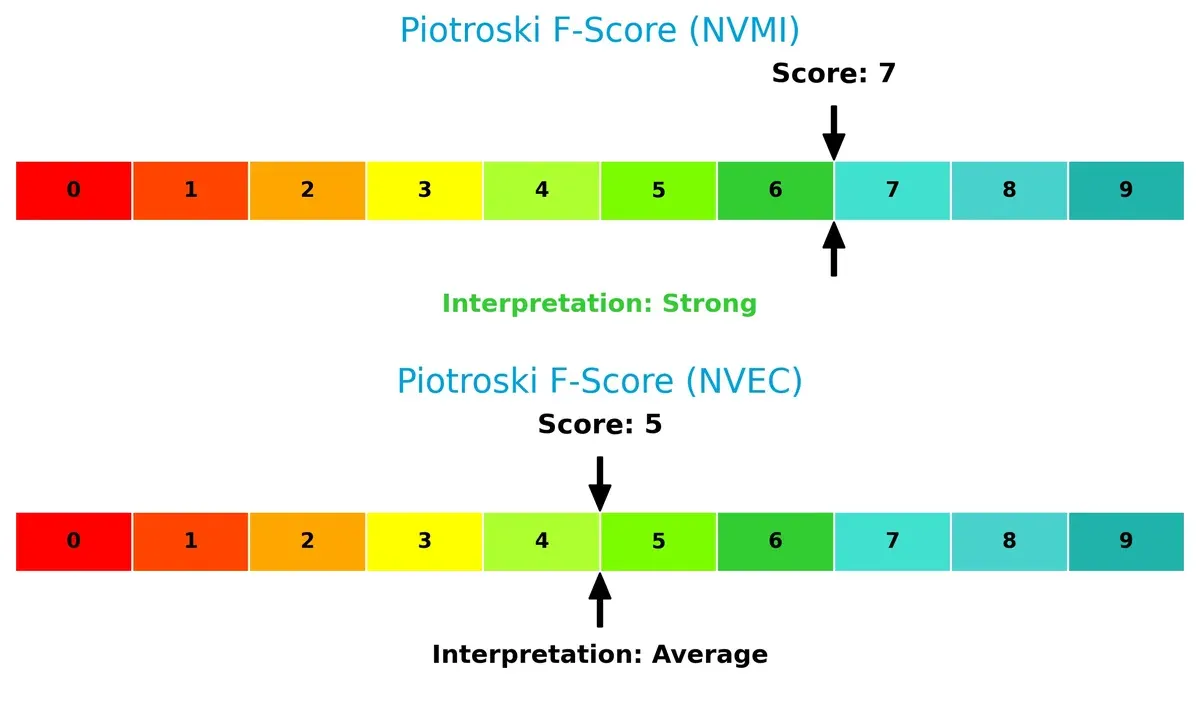
Financial Health: Quality of Operations
Nova Ltd. scores a solid 7 on the Piotroski F-Score, reflecting strong internal financial health. NVE Corporation scores 5, suggesting average operational quality with some internal metric concerns:
How are the two companies positioned?
This section dissects Nova Ltd. and NVE Corporation’s operational DNA by comparing revenue distribution and internal dynamics. The goal is to confront their economic moats and identify which model offers the most resilient competitive advantage today.
Revenue Segmentation: The Strategic Mix
This visual comparison dissects how Nova Ltd. and NVE Corporation diversify their income streams and highlights where their primary sector bets lie:
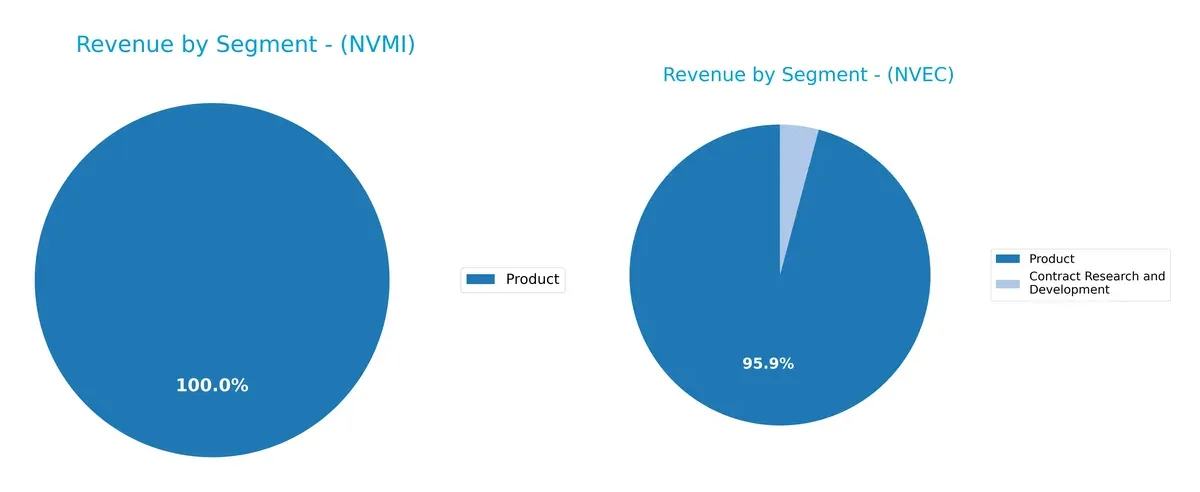
Nova Ltd. relies exclusively on its Product segment, generating $538M in 2024, showing a concentrated revenue base. In contrast, NVE Corporation diversifies between Product ($25.9M in 2022) and Contract Research and Development ($1.1M), though Product dwarfs the latter. Nova’s singular focus signals strong product specialization but raises concentration risk. NVE’s mix suggests a strategy blending stable product sales with innovative contract services, potentially cushioning market shifts.
Strengths and Weaknesses Comparison
This table compares the Strengths and Weaknesses of Nova Ltd. and NVE Corporation:
Nova Ltd. Strengths
- Favorable net margin and ROE demonstrate strong profitability
- Low debt-to-equity and high interest coverage reduce financial risk
- Solid liquidity ratios support operational stability
- Strong fixed asset turnover highlights efficient capital use
NVE Corporation Strengths
- Exceptional net margin and ROE indicate superior profitability
- Extremely low debt levels minimize financial risk
- Infinite interest coverage shows robust earnings versus interest
- High fixed asset turnover signals efficient asset utilization
- Global geographic revenue diversification
Nova Ltd. Weaknesses
- WACC exceeds ROIC, indicating potential value destruction
- Elevated PE and PB ratios may imply overvaluation
- Asset turnover below optimal benchmarks suggests weaker revenue generation from assets
- Zero dividend yield may deter income-focused investors
NVE Corporation Weaknesses
- Extremely high current ratio suggests inefficient asset deployment
- PB ratio is unfavorable compared to sector norms
- Moderate PE ratio offers less valuation upside
- Asset turnover underperforms industry expectations
Nova Ltd. excels in balanced profitability and low leverage but faces valuation and capital efficiency challenges. NVE Corporation delivers outstanding profitability and global reach yet must address asset utilization and liquidity efficiency to sharpen its competitive edge.
The Moat Duel: Analyzing Competitive Defensibility
A structural moat is the only true shield preserving long-term profits from relentless competitive pressure. Here’s how two semiconductor firms stack up:
Nova Ltd.: Intangible Assets Driving Process Control Excellence
Nova’s moat stems from proprietary metrology platforms critical in semiconductor manufacturing. This advantage supports a rising ROIC and stable 27% net margins. Continued innovation in advanced packaging deepens this edge in 2026.
NVE Corporation: Spintronics’ Cost Advantage and Superior Capital Efficiency
NVE leverages a unique spintronic technology with an 11.6% ROIC premium over WACC, vastly outperforming Nova. Despite recent revenue headwinds, its 58% net margin signals a durable cost moat poised for IoT expansion.
Verdict: Proprietary Technology vs. Capital Efficiency
NVE’s wider moat, evidenced by a strong ROIC gap and superior profitability, outmatches Nova’s growing but narrower intangible asset moat. NVE is better positioned to defend and expand its market share amidst intensifying semiconductor competition.
Which stock offers better returns?
The stock price dynamics of Nova Ltd. and NVE Corporation over the past year reveal starkly contrasting trajectories, with Nova Ltd. showing strong upward momentum while NVE Corporation faces a notable decline.
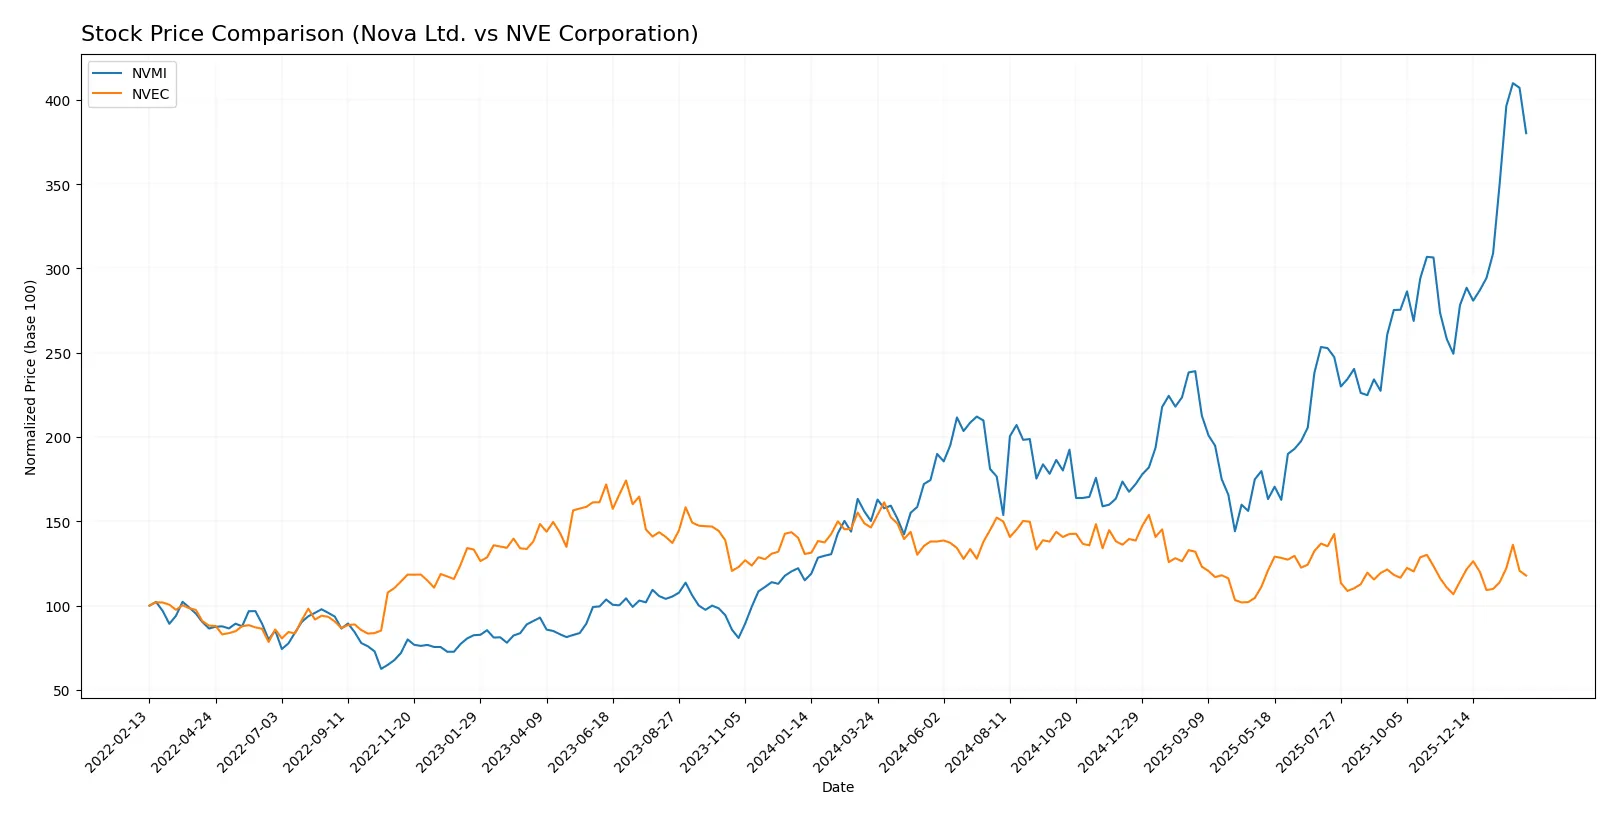
Trend Comparison
Nova Ltd. (NVMI) exhibits a robust bullish trend, surging 153.08% over the past 12 months with accelerating gains and a high price volatility of 66.1. The stock recently gained 52.46% in three months, confirming strong upward momentum.
NVE Corporation (NVEC) shows a bearish trend, dropping 19.48% over the past year despite acceleration. Its volatility remains low at 7.56. Recently, the stock rebounded 10.35% over three months, but momentum is modest.
Comparing their trends, Nova Ltd. significantly outperformed NVE Corporation, delivering the highest market returns and stronger price appreciation over the analyzed period.
Target Prices
Nova Ltd. shows a clear target price consensus from reliable analysts.
| Company | Target Low | Target High | Consensus |
|---|---|---|---|
| Nova Ltd. | 335 | 500 | 408.33 |
Analysts expect Nova Ltd.’s stock to trade slightly below the current price of $427.42, indicating cautious optimism. No verified target price data is available for NVE Corporation.

Don’t Let Luck Decide Your Entry Point
Optimize your entry points with our advanced ProRealTime indicators. You’ll get efficient buy signals with precise price targets for maximum performance. Start outperforming now!
How do institutions grade them?
The following presents the latest institutional grades for Nova Ltd. and NVE Corporation:
Nova Ltd. Grades
This table summarizes recent grades issued by reputable grading companies for Nova Ltd.:
| Grading Company | Action | New Grade | Date |
|---|---|---|---|
| Needham | Buy | Buy | 2026-01-20 |
| B of A Securities | Maintain | Buy | 2026-01-13 |
| Jefferies | Maintain | Buy | 2025-12-15 |
| Evercore ISI Group | Maintain | Outperform | 2025-11-07 |
| Benchmark | Maintain | Buy | 2025-11-07 |
| Cantor Fitzgerald | Maintain | Overweight | 2025-06-24 |
| B of A Securities | Maintain | Buy | 2025-06-24 |
| Citigroup | Maintain | Buy | 2025-05-09 |
| Benchmark | Maintain | Buy | 2025-05-09 |
| B of A Securities | Maintain | Buy | 2025-04-16 |
NVE Corporation Grades
No reliable institutional grades are available for NVE Corporation.
Which company has the best grades?
Nova Ltd. consistently receives Buy or Outperform ratings from respected firms, signaling strong institutional confidence. NVE Corporation lacks grade data, leaving investor sentiment unclear and less measurable.
Risks specific to each company
The following categories identify the critical pressure points and systemic threats facing both firms in the 2026 market environment:
1. Market & Competition
Nova Ltd.
- Operates globally in semiconductor process control, facing intense competition and rapid innovation demands.
NVE Corporation
- Focuses on spintronics devices with niche applications, but market size limits scale advantages.
2. Capital Structure & Debt
Nova Ltd.
- Maintains moderate leverage with a debt-to-equity ratio of 0.25, supported by strong interest coverage of 116x.
NVE Corporation
- Extremely low debt levels (debt-to-equity 0.01), indicating conservative financial risk and robust balance sheet.
3. Stock Volatility
Nova Ltd.
- Beta of 1.82 signals higher sensitivity to market swings and sector cyclicality.
NVE Corporation
- Lower beta at 1.22 reflects more stable stock performance relative to the tech sector.
4. Regulatory & Legal
Nova Ltd.
- Exposure to international trade regulations, especially given operations in Israel, Taiwan, China, and the US.
NVE Corporation
- US-based with fewer geopolitical cross-border regulatory risks but sensitive to domestic policy changes in technology.
5. Supply Chain & Operations
Nova Ltd.
- Complex global supply chain for semiconductor equipment exposes it to component shortages and logistics disruptions.
NVE Corporation
- Smaller scale and US-centric production reduce supply chain complexity but limit operational flexibility.
6. ESG & Climate Transition
Nova Ltd.
- Moderate ESG risks due to manufacturing footprint and energy-intensive production processes.
NVE Corporation
- Smaller environmental footprint; however, limited disclosure may pose transparency concerns.
7. Geopolitical Exposure
Nova Ltd.
- High exposure to geopolitical tensions in Asia-Pacific and Middle East impacting supply and market access.
NVE Corporation
- Primarily US-focused, reducing direct geopolitical risks but vulnerable to US-China tech decoupling effects.
Which company shows a better risk-adjusted profile?
Nova Ltd.’s primary risk lies in geopolitical exposure and competitive intensity in a fragmented semiconductor market. NVE Corporation faces operational scale limitations but benefits from a pristine balance sheet and lower stock volatility. NVE’s conservative capital structure and stable market niche grant it a superior risk-adjusted profile. Recent data highlights Nova’s elevated beta and global supply chain risks as key concerns.
Final Verdict: Which stock to choose?
Nova Ltd. (NVMI) shines as a cash machine with robust profitability and accelerating growth. Its main point of vigilance lies in a stretched valuation and a slightly unfavorable asset turnover, which might pressure future returns. NVMI suits aggressive growth portfolios willing to embrace higher risk for superior expansion.
NVE Corporation (NVEC) holds a strategic moat in its sustainable competitive advantage, demonstrated by a very favorable ROIC versus WACC gap and exceptional profitability metrics. It offers better financial stability and a cleaner balance sheet than NVMI. NVEC fits well within GARP portfolios seeking growth paired with relative safety.
If you prioritize rapid expansion and are comfortable managing valuation risk, Nova Ltd. outshines with its strong growth trajectory and improving profitability. However, if you seek a durable competitive advantage with better balance sheet strength, NVE Corporation offers superior stability and a more attractive risk profile. Both represent compelling but distinct investment scenarios.
Disclaimer: Investment carries a risk of loss of initial capital. The past performance is not a reliable indicator of future results. Be sure to understand risks before making an investment decision.
Go Further
I encourage you to read the complete analyses of Nova Ltd. and NVE Corporation to enhance your investment decisions: