Home > Comparison > Technology > INDI vs NVEC
The strategic rivalry between indie Semiconductor, Inc. and NVE Corporation shapes innovation in the semiconductor industry. Indie Semiconductor operates as a capital-intensive developer of automotive chips and software, while NVE Corporation specializes in niche spintronic sensor technology with a leaner operational model. This contrast highlights a battle between broad automotive applications and specialized industrial solutions. This analysis will assess which company offers a superior risk-adjusted return for diversified portfolios in the evolving technology landscape.
Table of contents
Companies Overview
Indie Semiconductor and NVE Corporation play key roles in the semiconductor industry, each defining unique niches in advanced technology.
indie Semiconductor, Inc.: Automotive Semiconductor Innovator
Indie Semiconductor focuses on automotive semiconductors and software, powering advanced driver assistance and connected car systems. Its core revenue comes from devices supporting parking assistance, wireless charging, infotainment, and telematics. In 2026, the company emphasizes enhancing user experience through integrated hardware and software solutions for vehicle electrification and connectivity.
NVE Corporation: Spintronics Technology Pioneer
NVE Corporation specializes in spintronic devices that utilize electron spin for data acquisition and transmission. It generates revenue primarily from sensors and couplers for factory automation, medical devices, and the industrial IoT market. The strategic focus in 2026 remains on advancing spintronic sensor technology and expanding licensing opportunities in magnetoresistive memory.
Strategic Collision: Similarities & Divergences
Indie Semiconductor and NVE both innovate in semiconductors but diverge fundamentally: Indie embraces a broad automotive ecosystem, while NVE focuses on a niche spintronic technology. Their primary battleground is industrial and automotive sensor applications. Indie’s larger scale contrasts with NVE’s specialized R&D-driven model, creating distinct risk and growth profiles for investors.
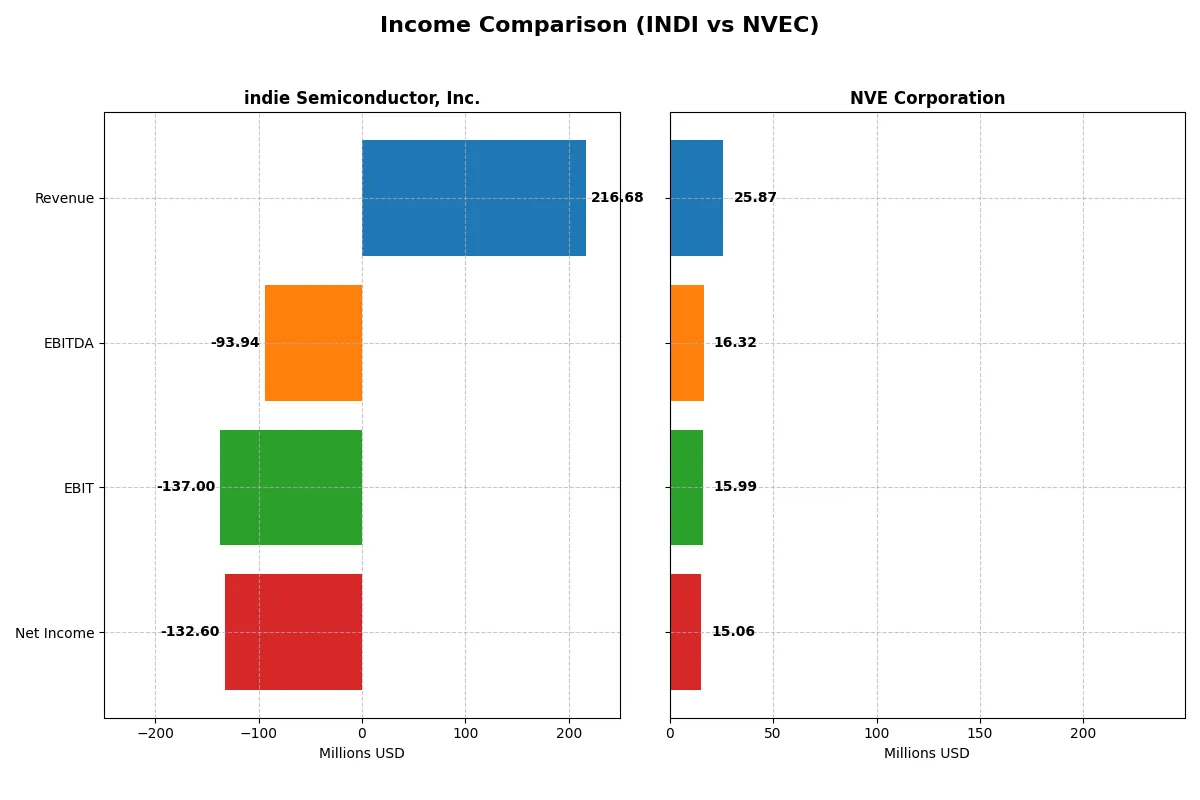
Income Statement Comparison
This data dissects the core profitability and scalability of both corporate engines to reveal who dominates the bottom line:
| Metric | indie Semiconductor, Inc. (INDI) | NVE Corporation (NVEC) |
|---|---|---|
| Revenue | 217M | 26M |
| Cost of Revenue | 126M | 4.2M |
| Operating Expenses | 260M | 5.6M |
| Gross Profit | 90M | 22M |
| EBITDA | -94M | 16M |
| EBIT | -137M | 16M |
| Interest Expense | 9.3M | 0 |
| Net Income | -133M | 15M |
| EPS | -0.76 | 3.12 |
| Fiscal Year | 2024 | 2025 |
Income Statement Analysis: The Bottom-Line Duel
This income statement comparison uncovers how each company converts revenue into profit, exposing their operational efficiency and financial health.
indie Semiconductor, Inc. Analysis
indie Semiconductor’s revenue surged from 22M in 2020 to 217M in 2024, reflecting rapid top-line growth. However, net income remains deeply negative, widening to -133M in 2024. Its gross margin improved sharply to 41.7%, yet persistent operating losses erode profitability, signaling challenges in scaling expenses relative to sales.
NVE Corporation Analysis
NVE Corporation posted steady revenues around 26B in 2025, down slightly from 38B in 2023. It maintains an impressive gross margin above 80% and net margin exceeding 58%. Despite a recent revenue dip, NVE sustains strong profitability with net income of 15B, demonstrating disciplined cost control and consistent operational leverage.
Verdict: Scaling Losses vs. Profitable Resilience
indie Semiconductor exhibits high revenue growth but struggles with persistent negative margins and widening net losses. In contrast, NVE delivers robust profitability with stable margins and positive net income despite slight revenue contraction. For investors, NVE’s resilient earnings profile offers a more attractive foundation than indie’s aggressive growth paired with ongoing deficits.
Financial Ratios Comparison
These vital ratios act as a diagnostic tool to expose the underlying fiscal health, valuation premiums, and capital efficiency of the companies compared below:
| Ratios | indie Semiconductor, Inc. (INDI) | NVE Corporation (NVEC) |
|---|---|---|
| ROE | -31.7% (2024) | 24.2% (2025) |
| ROIC | -19.3% (2024) | 21.1% (2025) |
| P/E | -5.35 (2024) | 20.46 (2025) |
| P/B | 1.70 (2024) | 4.95 (2025) |
| Current Ratio | 4.82 (2024) | 28.40 (2025) |
| Quick Ratio | 4.23 (2024) | 22.03 (2025) |
| D/E | 0.95 (2024) | 0.015 (2025) |
| Debt-to-Assets | 42.3% (2024) | 1.43% (2025) |
| Interest Coverage | -18.4 (2024) | N/A |
| Asset Turnover | 0.23 (2024) | 0.40 (2025) |
| Fixed Asset Turnover | 4.30 (2024) | 8.91 (2025) |
| Payout ratio | 0% (2024) | 128% (2025) |
| Dividend yield | 0% (2024) | 6.28% (2025) |
| Fiscal Year | 2024 | 2025 |
Efficiency & Valuation Duel: The Vital Signs
Financial ratios act as a company’s DNA, exposing hidden risks and operational excellence beneath surface-level numbers.
indie Semiconductor, Inc.
indie Semiconductor shows deeply negative profitability with ROE at -31.7% and net margins at -61.2%, indicating operational struggles. Its P/E is negative, reflecting losses, yet the P/B of 1.7 remains neutral. The firm invests heavily in R&D instead of paying dividends, aiming to fuel long-term growth despite unfavorable cash flows.
NVE Corporation
NVE Corporation delivers robust profitability with a 24.2% ROE and a strong 58.2% net margin, affirming efficient operations. Valuation appears reasonable, with a P/E of 20.5 and a high P/B of 4.95 signaling premium pricing. It returns value through a 6.28% dividend yield, balancing growth and shareholder income effectively.
Premium Valuation vs. Operational Safety
NVE offers superior profitability and a balanced mix of dividends and growth, while indie Semiconductor struggles with losses and reinvests in uncertain R&D. NVE’s profile suits risk-conscious investors seeking steady returns. Indie may appeal to growth-focused investors willing to tolerate operational challenges.
Which one offers the Superior Shareholder Reward?
I see indie Semiconductor (INDI) pays no dividends and shows no buyback activity, reflecting heavy reinvestment amid persistent losses. NVE Corporation (NVEC) yields 4.5–7.3% dividends with payout ratios around 100–165%, supported by robust free cash flow near 3B per share. NVEC’s steady buybacks amplify returns, while INDI’s lack of distributions and negative free cash flow raise red flags for income-focused investors. NVEC’s high margins and sustainable capital allocation clearly offer superior total shareholder reward in 2026.
Comparative Score Analysis: The Strategic Profile
The radar chart reveals the fundamental DNA and trade-offs of indie Semiconductor, Inc. and NVE Corporation, highlighting their strategic financial strengths and weaknesses:
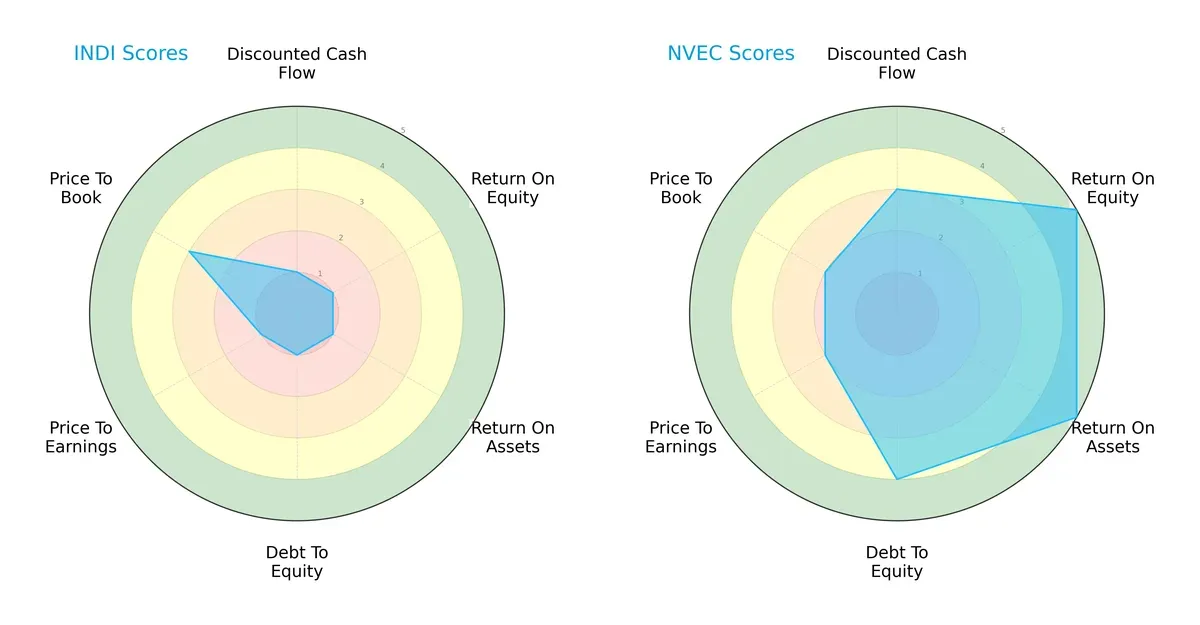
NVE Corporation dominates with a balanced profile, scoring very favorably in ROE (5), ROA (5), and maintaining solid debt-to-equity (4). indie Semiconductor, Inc. relies on a modest edge in price-to-book valuation (3) but struggles elsewhere, with uniformly low scores (1) across DCF, ROE, ROA, debt, and P/E. NVE’s diversified strengths suggest a robust operational and capital allocation strategy, while indie Semiconductor shows vulnerability and limited financial flexibility.
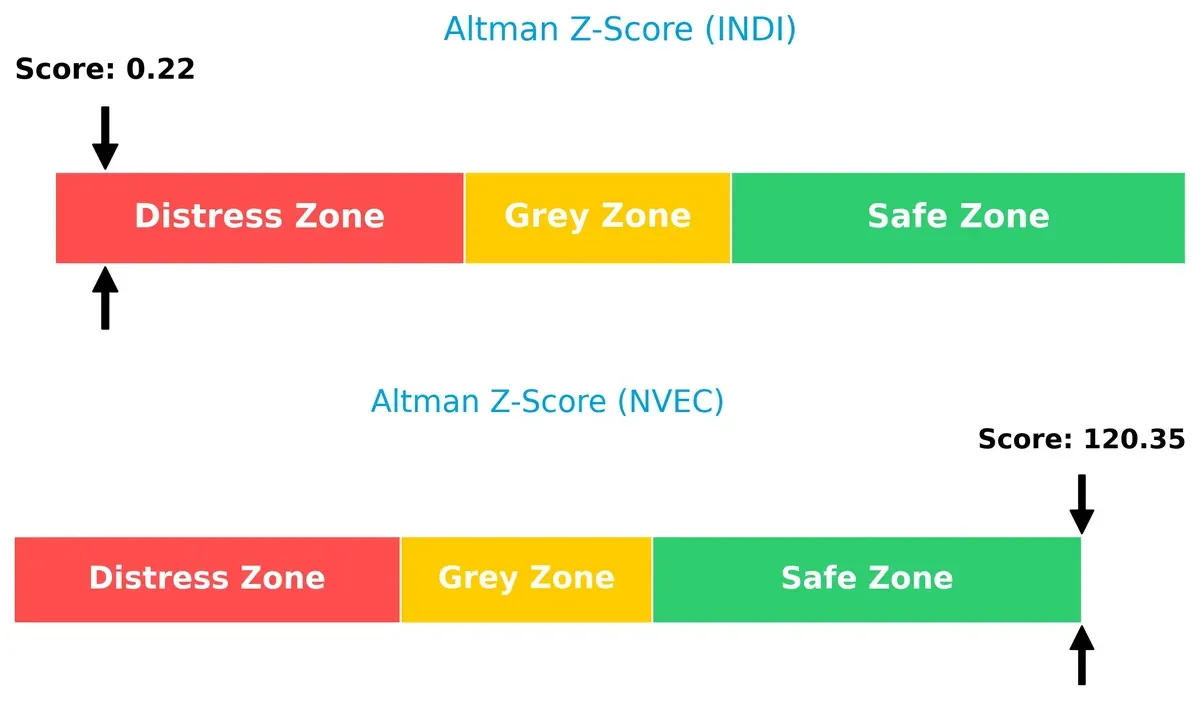
Bankruptcy Risk: Solvency Showdown
NVE Corporation’s Altman Z-Score of 120.4 places it firmly in the safe zone, signaling strong solvency and negligible bankruptcy risk. indie Semiconductor, Inc.’s score of 0.22 signals distress and high bankruptcy probability in this cycle:
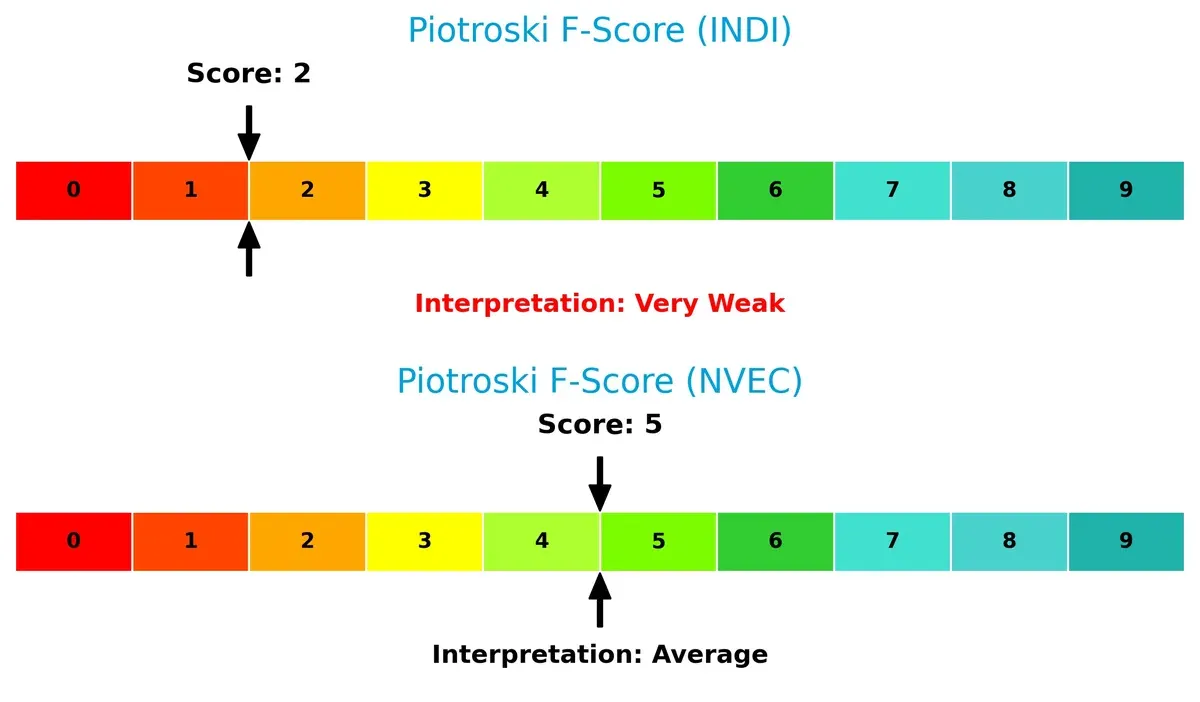
Financial Health: Quality of Operations
NVE Corporation’s Piotroski F-Score of 5 indicates average financial health, with room for improvement but no immediate red flags. indie Semiconductor, Inc.’s score of 2 is very weak, raising concerns about its operational quality and internal financial metrics:
How are the two companies positioned?
This section dissects the operational DNA of indie Semiconductor and NVE by comparing their revenue distribution and internal dynamics. The goal is to confront their economic moats to identify the most resilient competitive advantage today.
Revenue Segmentation: The Strategic Mix
This visual comparison dissects how indie Semiconductor, Inc. and NVE Corporation diversify their income streams and where their primary sector bets lie:
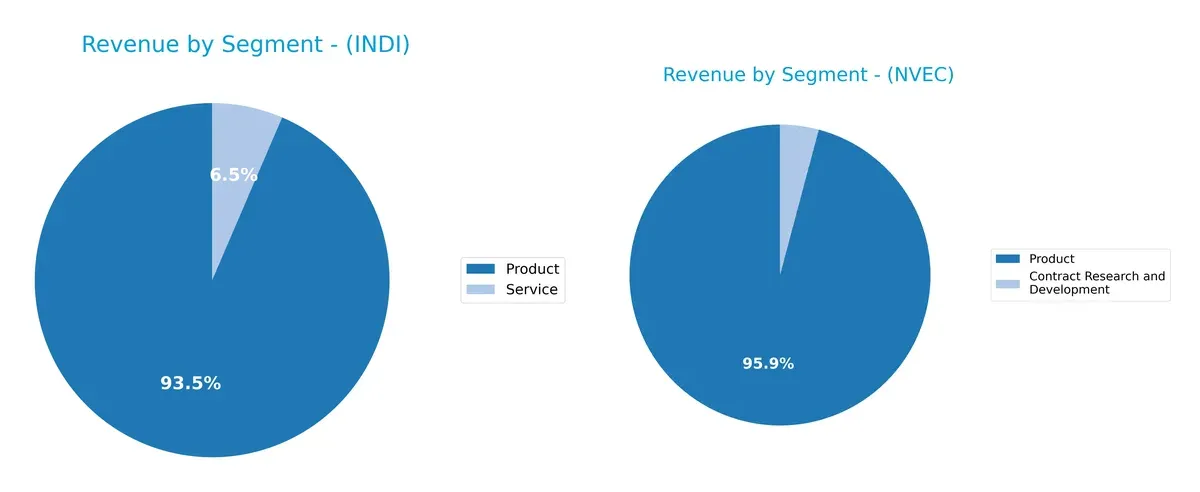
indie Semiconductor anchors its revenue in Products, generating $203M in 2024, with Services trailing at $14M, showing a moderately diversified mix. NVE Corporation pivots heavily on Products, $26B in 2022, while Contract Research and Development contributes just $1.1M, signaling a concentrated reliance. indie’s mix suggests balanced exposure, while NVE’s dominance in Products implies concentration risk but also entrenched infrastructure leadership.
Strengths and Weaknesses Comparison
This table compares the strengths and weaknesses of indie Semiconductor, Inc. and NVE Corporation:
indie Semiconductor, Inc. Strengths
- Diverse product and service revenue streams
- Strong presence in China and Europe
- High quick ratio indicating liquidity
- Favorable fixed asset turnover
NVE Corporation Strengths
- Strong profitability with high net margin and ROE
- Low debt levels and strong interest coverage
- Favorable fixed asset turnover
- Global presence across Asia, Europe, and US
indie Semiconductor, Inc. Weaknesses
- Negative net margin, ROE, and ROIC indicating unprofitability
- High weighted average cost of capital
- Negative interest coverage ratio
- Low asset turnover
NVE Corporation Weaknesses
- Elevated current ratio suggesting inefficient asset use
- Unfavorable price-to-book ratio
- Moderate asset turnover despite profitability
Despite indie Semiconductor’s liquidity and geographic diversification, its negative profitability metrics raise concerns. NVE Corporation’s strong profitability and capital structure underpin its favorable profile, though asset efficiency and valuation metrics require attention. These contrasts reflect differing strategic and operational challenges.
The Moat Duel: Analyzing Competitive Defensibility
A structural moat is the essential barrier that protects long-term profits from relentless competitive erosion. Let’s dissect the moats of these two semiconductor firms:
indie Semiconductor, Inc.: Emerging Innovation with Fragile Profitability
indie Semiconductor’s moat centers on Intangible Assets, especially proprietary automotive software and photonic tech. However, its ROIC lags well below WACC, signaling value destruction. The 2026 outlook hinges on successfully scaling new ADAS and connectivity products to deepen its moat.
NVE Corporation: Spintronics Specialist with Durable Value Creation
NVE’s competitive advantage lies in its Cost Advantage and niche spintronic technology. It sustains a ROIC comfortably above WACC, reflecting efficient capital use and margin strength. Expansion into Industrial IoT and medical sensors promises to widen its moat further in 2026.
Intangible Assets vs. Cost Advantage: Who Holds the Deeper Moat?
NVE Corporation clearly wields a wider, more durable moat, demonstrated by its robust ROIC and growing profitability. indie Semiconductor’s shrinking ROIC and value erosion leave it vulnerable. NVE is better positioned to defend and expand its market share.
Which stock offers better returns?
The past year shows contrasting price dynamics between indie Semiconductor and NVE Corporation, with notable declines and recent upward shifts in both stocks’ trajectories.
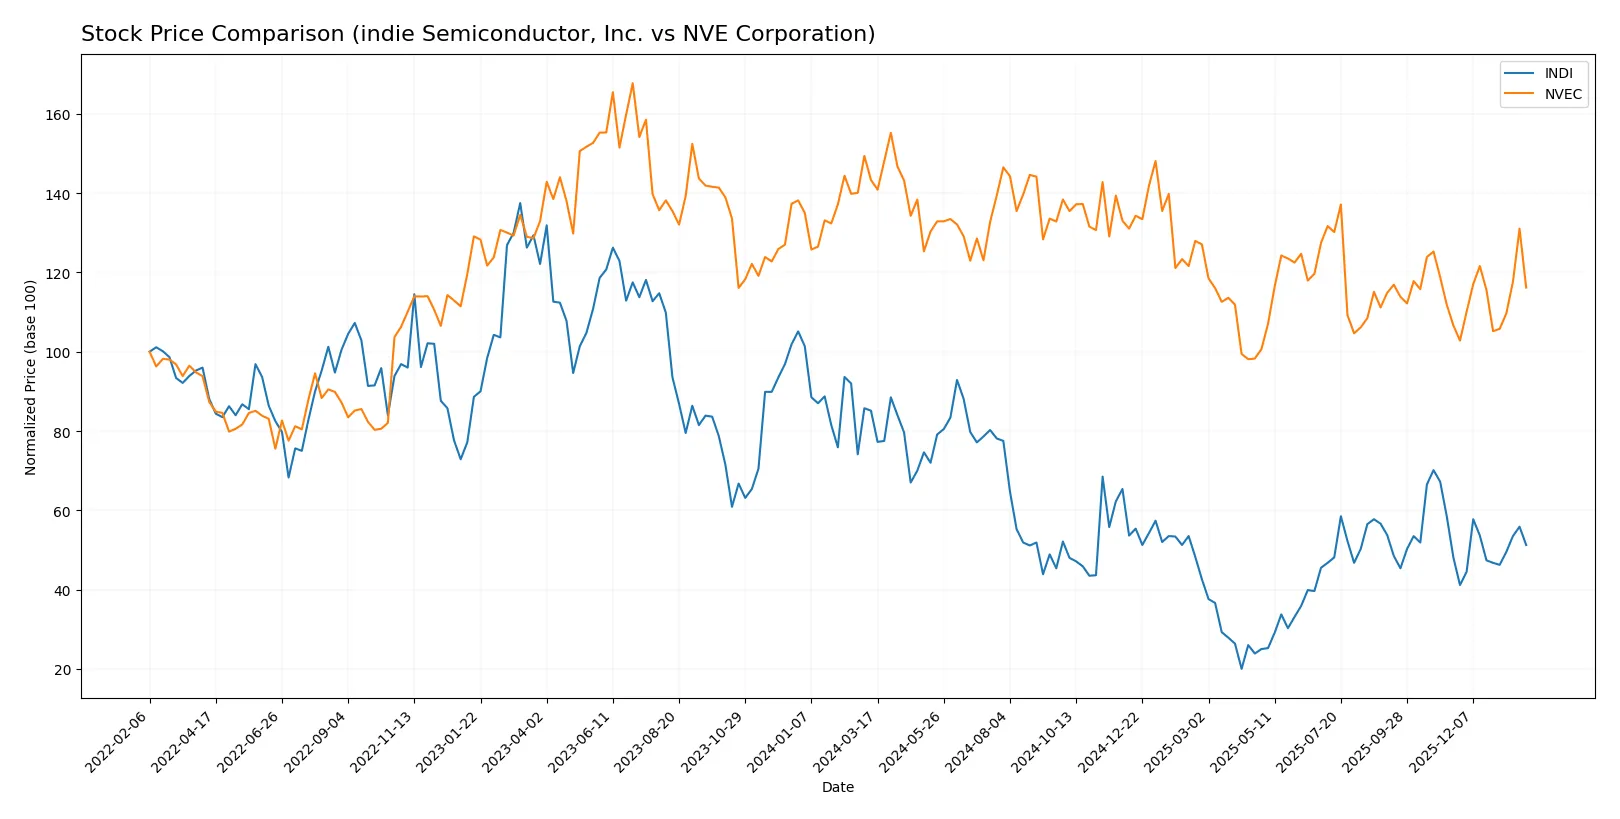
Trend Comparison
indie Semiconductor’s stock fell 39.79% over 12 months, marking a clear bearish trend with accelerating decline and a low volatility of 1.32%. It reached a peak of 7.43 and a trough near 1.6.
NVE Corporation’s stock also declined, down 18.93% in the same period. The bearish trend accelerated with higher volatility at 7.6%, hitting a high of 90.18 and a low near 57.
Both stocks show recent rebound trends; however, NVE Corporation delivered a smaller overall loss, thus outperforming indie Semiconductor over the past year.
Target Prices
The consensus target price for indie Semiconductor, Inc. signals clear analyst expectations.
| Company | Target Low | Target High | Consensus |
|---|---|---|---|
| indie Semiconductor, Inc. | 8 | 8 | 8 |
Analysts set indie Semiconductor’s target at $8, nearly doubling its current $4.1 price. No verified target price data is available for NVE Corporation; its market sentiment remains uncertain.

Don’t Let Luck Decide Your Entry Point
Optimize your entry points with our advanced ProRealTime indicators. You’ll get efficient buy signals with precise price targets for maximum performance. Start outperforming now!
How do institutions grade them?
The following summarizes the institutional grades assigned to the two companies:
indie Semiconductor, Inc. Grades
This table lists recent grades issued by recognized grading companies for indie Semiconductor, Inc.:
| Grading Company | Action | New Grade | Date |
|---|---|---|---|
| UBS | Maintain | Neutral | 2025-11-10 |
| Benchmark | Maintain | Buy | 2025-06-25 |
| Benchmark | Maintain | Buy | 2025-06-11 |
| Benchmark | Maintain | Buy | 2025-05-21 |
| Benchmark | Maintain | Buy | 2025-05-13 |
| Craig-Hallum | Maintain | Buy | 2025-05-13 |
| Keybanc | Maintain | Overweight | 2025-05-13 |
| Benchmark | Maintain | Buy | 2025-04-09 |
| Benchmark | Maintain | Buy | 2025-02-21 |
| Keybanc | Maintain | Overweight | 2025-02-21 |
Which company has the best grades?
Only indie Semiconductor, Inc. has reliable institutional grades, mostly “Buy” and “Overweight” from reputable firms. NVE Corporation lacks any available grades. This suggests indie Semiconductor holds stronger institutional support, potentially influencing investor confidence.
Risks specific to each company
The following categories identify the critical pressure points and systemic threats facing both indie Semiconductor, Inc. and NVE Corporation in the 2026 market environment:
1. Market & Competition
indie Semiconductor, Inc.
- Faces intense competition in automotive semiconductors and connectivity solutions, impacting market share.
NVE Corporation
- Operates in a niche spintronics market with less direct competition but limited scale.
2. Capital Structure & Debt
indie Semiconductor, Inc.
- Debt-to-equity ratio near 1.0 signals moderate leverage; interest coverage is negative, raising financial risk.
NVE Corporation
- Minimal debt load with a near-zero debt-to-equity ratio and infinite interest coverage, indicating strong balance sheet.
3. Stock Volatility
indie Semiconductor, Inc.
- High beta (2.54) indicates significant stock price volatility and sensitivity to market swings.
NVE Corporation
- Moderate beta (1.20) suggests lower volatility and more stable price movements relative to market.
4. Regulatory & Legal
indie Semiconductor, Inc.
- Regulatory risks tied to automotive safety standards and software compliance in connected car technologies.
NVE Corporation
- Faces regulatory scrutiny mainly around medical device certifications and industrial IoT standards.
5. Supply Chain & Operations
indie Semiconductor, Inc.
- Complex supply chain for automotive semiconductors vulnerable to component shortages and geopolitical disruptions.
NVE Corporation
- Smaller scale supply chains with specialized components, less exposure but higher dependency on niche suppliers.
6. ESG & Climate Transition
indie Semiconductor, Inc.
- Exposure to automotive electrification aligns with climate transition but requires heavy R&D investment.
NVE Corporation
- Spintronics technology offers energy-efficient solutions, positioning well for ESG-conscious markets.
7. Geopolitical Exposure
indie Semiconductor, Inc.
- US-based but reliant on global automotive markets and supply chains, exposing it to trade tensions.
NVE Corporation
- Primarily US domestic focus with limited international footprint, reducing geopolitical risk.
Which company shows a better risk-adjusted profile?
indie Semiconductor’s largest risk lies in its weak financial health, marked by negative profitability and precarious interest coverage. NVE Corporation’s key risk is its narrow market niche that limits growth potential but offers financial stability. NVE’s strong Altman Z-score and balanced capital structure support a better risk-adjusted profile. The recent surge in INDI’s stock volatility (beta 2.54) compounds investor caution amid operational and financial stress.
Final Verdict: Which stock to choose?
Indie Semiconductor’s superpower lies in its aggressive R&D investment, fueling innovation in a challenging sector. However, its persistent value destruction and weak profitability metrics signal caution. It fits portfolios that tolerate high risk for potentially disruptive growth.
NVE Corporation boasts a durable moat driven by strong profitability and efficient capital use. Its robust financial health and consistent value creation offer a safer profile compared to Indie Semiconductor. This stock suits investors seeking steady growth with reasonable valuation.
If you prioritize aggressive innovation and can withstand volatility, Indie Semiconductor might appeal despite its financial headwinds. However, if you seek a more stable investment with a proven track record of value creation, NVE Corporation offers better stability and a stronger competitive position.
Disclaimer: Investment carries a risk of loss of initial capital. The past performance is not a reliable indicator of future results. Be sure to understand risks before making an investment decision.
Go Further
I encourage you to read the complete analyses of indie Semiconductor, Inc. and NVE Corporation to enhance your investment decisions: