In today’s rapidly evolving tech landscape, choosing the right software infrastructure stock is crucial for savvy investors. Zscaler, Inc. (ZS) and Nutanix, Inc. (NTNX) both operate in cloud-focused software solutions, targeting enterprise digital transformation with innovative security and cloud management platforms. Their overlapping markets and differing innovation strategies make them compelling peers. This article will help you identify which company holds the most promise for your investment portfolio.
Table of contents
Companies Overview
I will begin the comparison between Zscaler and Nutanix by providing an overview of these two companies and their main differences.
Zscaler Overview
Zscaler, Inc. operates as a cloud security company worldwide, focusing on secure access to externally managed applications and private or public clouds. Its platform includes solutions for internet access, private access, digital experience, workload segmentation, and cloud security posture management. Headquartered in San Jose, California, Zscaler serves various industries including financial services, healthcare, manufacturing, and telecommunications with a market cap of 34.1B USD.
Nutanix Overview
Nutanix, Inc. provides an enterprise cloud platform offering virtualization, storage, networking, security, and automation services across multiple regions globally. Its product suite includes hypervisors, Kubernetes management, cloud governance, application lifecycle management, and desktop-as-a-service solutions. Also based in San Jose, Nutanix serves diverse industries like automotive, education, energy, and public sector, with a market cap of 12.4B USD.
Key similarities and differences
Both Zscaler and Nutanix operate in the software infrastructure industry and offer cloud-related enterprise solutions. While Zscaler specializes in cloud security and secure access technologies, Nutanix focuses on enterprise cloud platforms with virtualization and hybrid cloud orchestration. Zscaler has a higher market cap and beta, indicating greater market volatility compared to Nutanix’s more diversified cloud management approach.
Income Statement Comparison
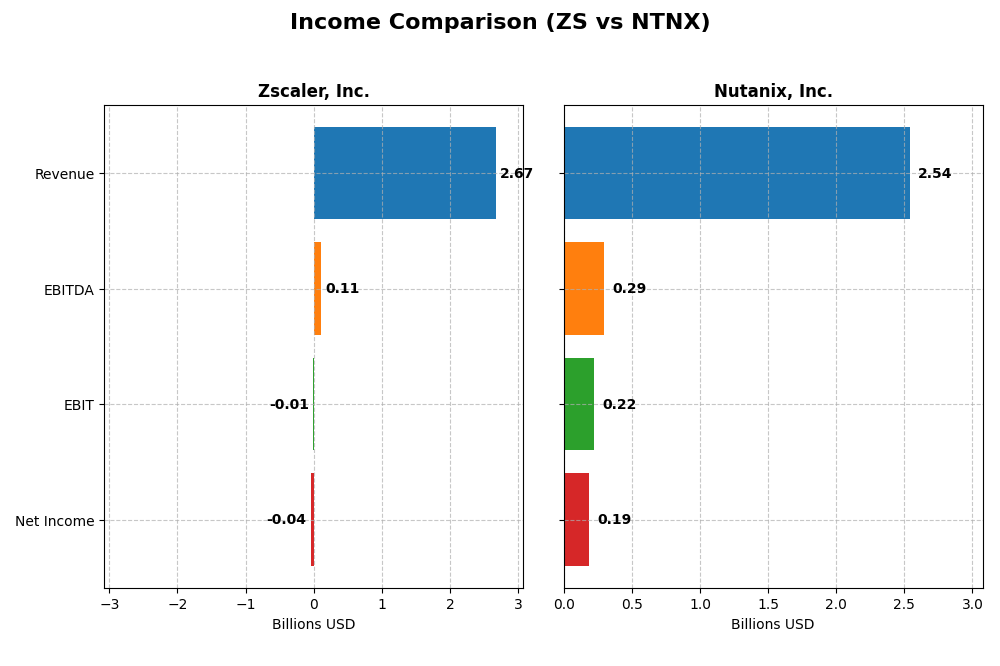
The table below compares key income statement metrics for Zscaler, Inc. and Nutanix, Inc. for the fiscal year 2025, providing a snapshot of their financial performance.
| Metric | Zscaler, Inc. (ZS) | Nutanix, Inc. (NTNX) |
|---|---|---|
| Market Cap | 34.1B | 12.4B |
| Revenue | 2.67B | 2.54B |
| EBITDA | 112M | 293M |
| EBIT | -8.8M | 220M |
| Net Income | -41.5M | 188M |
| EPS | -0.27 | 0.70 |
| Fiscal Year | 2025 | 2025 |
Income Statement Interpretations
Zscaler, Inc.
Zscaler, Inc. showed a strong revenue growth trend, increasing from 673M in 2021 to 2.67B in 2025, with net losses narrowing significantly from -262M to -41M. Gross margins remained robust around 77%, but EBIT and net margins stayed negative, despite notable margin improvements in 2025. The latest year saw a 23.3% revenue growth and a 41.7% net margin improvement, signaling operational progress.
Nutanix, Inc.
Nutanix, Inc. experienced steady revenue growth from 1.39B in 2021 to 2.54B in 2025, turning from a significant net loss of -1.03B to a net income of 188M. The company maintained high gross margins near 87%, with EBIT margins improving to 8.7% and net margins reaching 7.4% in 2025. The recent year demonstrated strong profitability growth, including a 227.8% increase in net margin and EPS growth.
Which one has the stronger fundamentals?
Both companies posted favorable income statement growth and margin improvements, but Nutanix exhibits stronger fundamentals with positive EBIT and net margins, alongside significant profitability turnaround. Zscaler maintains impressive revenue growth and gross margins but still reports net losses. Nutanix’s consistent profitability and margin expansion suggest more stable financial health based on the provided data.
Financial Ratios Comparison
The table below presents the most recent key financial ratios for Zscaler, Inc. and Nutanix, Inc. for fiscal year 2025, providing a snapshot of their profitability, liquidity, leverage, and market valuation.
| Ratios | Zscaler, Inc. (ZS) | Nutanix, Inc. (NTNX) |
|---|---|---|
| ROE | -2.31% | -27.12% |
| ROIC | -3.18% | 8.11% |
| P/E | -1063 | 107 |
| P/B | 24.5 | -28.95 |
| Current Ratio | 2.01 | 1.72 |
| Quick Ratio | 2.01 | 1.72 |
| D/E | 1.00 | -2.14 |
| Debt-to-Assets | 28.0% | 45.2% |
| Interest Coverage | -13.49 | 8.75 |
| Asset Turnover | 0.42 | 0.77 |
| Fixed Asset Turnover | 4.22 | 9.15 |
| Payout ratio | 0 | 0 |
| Dividend yield | 0 | 0 |
Interpretation of the Ratios
Zscaler, Inc.
Zscaler shows a mixed financial profile with several unfavorable ratios, including negative net margin (-1.55%) and return on equity (-2.31%), indicating profitability and efficiency challenges. The company maintains a strong liquidity position with current and quick ratios around 2.0. Zscaler does not pay dividends, reflecting its reinvestment focus likely due to ongoing growth and operational demands.
Nutanix, Inc.
Nutanix displays a slightly more favorable ratio set, with a positive net margin of 7.42% and decent liquidity ratios near 1.72. However, its return on equity is significantly negative (-27.12%), signaling shareholder returns pressure. Nutanix also does not pay dividends, which may be linked to its reinvestment in R&D and strategic growth initiatives, aligning with typical software infrastructure firms.
Which one has the best ratios?
Nutanix holds a slight advantage with a higher proportion of favorable ratios (50%) and only 21.43% unfavorable, compared to Zscaler’s 35.71% favorable and 50% unfavorable. Nutanix’s better interest coverage and fixed asset turnover ratios support operational efficiency. However, both companies face challenges in return metrics, underscoring risks in profitability and shareholder returns.
Strategic Positioning
This section compares the strategic positioning of Zscaler, Inc. and Nutanix, Inc. focusing on market position, key segments, and exposure to technological disruption:
Zscaler, Inc.
- Leading cloud security firm with global reach facing competitive pressure in software infrastructure.
- Focused on cloud security solutions including SaaS access, workload segmentation, and digital experience.
- Positioned in cloud security with solutions targeting SaaS, public clouds, and data centers, facing evolving cyber threats.
Nutanix, Inc.
- Enterprise cloud platform provider operating worldwide with moderate competitive pressure.
- Offers converged virtualization, enterprise storage, cloud governance, and automation services.
- Exposure through virtualization and hybrid cloud orchestration, with products supporting Kubernetes and cloud-native environments.
Zscaler, Inc. vs Nutanix, Inc. Positioning
Zscaler concentrates on cloud security with a specialized product suite, while Nutanix offers a more diversified enterprise cloud platform spanning virtualization, storage, and hybrid cloud management. Zscaler’s focus enables depth in security, whereas Nutanix’s breadth addresses broader infrastructure needs.
Which has the best competitive advantage?
Nutanix demonstrates a very favorable moat with ROIC above WACC and growing profitability, indicating a durable competitive advantage. Zscaler’s moat is slightly unfavorable despite a rising ROIC trend, suggesting value destruction but improving profitability.
Stock Comparison
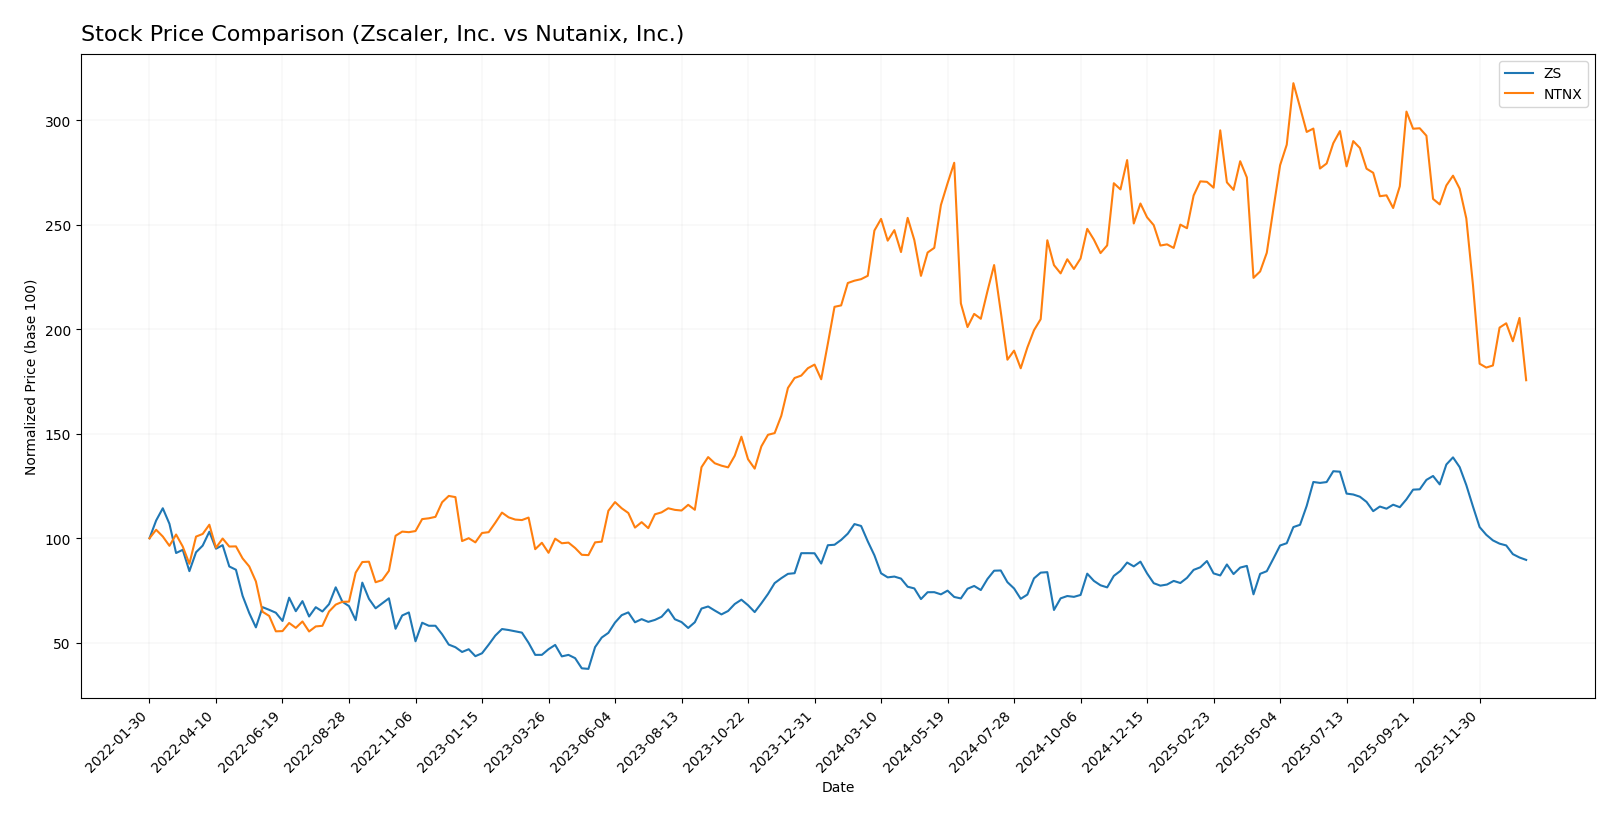
The stock prices of Zscaler, Inc. (ZS) and Nutanix, Inc. (NTNX) have exhibited notable declines over the past year, reflecting bearish trends with decelerating momentum and differing volatility profiles.
Trend Analysis
Zscaler, Inc. (ZS) showed a -9.03% price change over the past 12 months, indicating a bearish trend with deceleration. The stock fluctuated between a high of 331.14 and a low of 156.78, with high volatility (std deviation 47.11).
Nutanix, Inc. (NTNX) experienced a -22.16% decline over the same period, also bearish with deceleration. It had a lower volatility (std deviation 8.67) and traded between 82.77 and 45.74.
Comparing both, ZS’s decline was less severe than NTNX’s, making ZS the stronger market performer despite both trending downward.
Target Prices
Analysts provide a clear consensus on target prices for Zscaler, Inc. and Nutanix, Inc., indicating potential upside from current levels.
| Company | Target High | Target Low | Consensus |
|---|---|---|---|
| Zscaler, Inc. | 360 | 260 | 311.41 |
| Nutanix, Inc. | 90 | 53 | 64.67 |
The consensus target prices suggest that Zscaler’s stock, currently at $213.98, could appreciate significantly toward the $311.41 average target. Nutanix, trading at $45.74, also shows upside potential with a consensus target of $64.67.
Analyst Opinions Comparison
This section compares analysts’ ratings and financial scores for Zscaler, Inc. and Nutanix, Inc.:
Rating Comparison
ZS Rating
- Rated C- with a very favorable overall rating status.
- Discounted Cash Flow Score of 4, indicating favorable future cash flow value.
- Return on Equity Score of 1, considered very unfavorable for profitability.
- Return on Assets Score of 1, indicating very unfavorable asset utilization.
- Debt To Equity Score of 1, reflecting very unfavorable financial risk level.
- Overall Score of 1, classified as very unfavorable financial standing.
NTNX Rating
- Rated C+ with a very favorable overall rating status.
- Discounted Cash Flow Score of 4, indicating favorable future cash flow value.
- Return on Equity Score of 1, considered very unfavorable for profitability.
- Return on Assets Score of 4, showing favorable asset utilization.
- Debt To Equity Score of 1, reflecting very unfavorable financial risk level.
- Overall Score of 2, classified as moderate financial standing.
Which one is the best rated?
Nutanix holds a slightly better rating with a C+ and an overall score of 2 (moderate), outperforming Zscaler’s C- and overall score of 1 (very unfavorable). Nutanix also excels in return on assets, while both share challenges in equity returns and debt levels.
Scores Comparison
Here is a comparison of the Altman Z-Score and Piotroski Score for Zscaler and Nutanix:
Zscaler Scores
- Altman Z-Score: 4.89, indicating a safe zone with low bankruptcy risk.
- Piotroski Score: 3, categorized as very weak financial strength.
Nutanix Scores
- Altman Z-Score: 1.48, in the distress zone signaling high bankruptcy risk.
- Piotroski Score: 6, reflecting average financial strength.
Which company has the best scores?
Based strictly on the data, Zscaler has a stronger Altman Z-Score indicating financial safety, while Nutanix has a better Piotroski Score showing stronger financial health. Each company leads in a different score category.
Grades Comparison
Here is a comparison of the recent grades assigned to Zscaler, Inc. and Nutanix, Inc. by recognized grading companies:
Zscaler, Inc. Grades
The following table summarizes Zscaler’s grades from major financial institutions over recent months:
| Grading Company | Action | New Grade | Date |
|---|---|---|---|
| Citigroup | Maintain | Buy | 2026-01-13 |
| Keybanc | Maintain | Overweight | 2026-01-12 |
| Piper Sandler | Maintain | Neutral | 2026-01-05 |
| RBC Capital | Maintain | Outperform | 2026-01-05 |
| Mizuho | Upgrade | Outperform | 2025-12-16 |
| Bernstein | Downgrade | Market Perform | 2025-12-01 |
| Citigroup | Maintain | Buy | 2025-12-01 |
| JP Morgan | Maintain | Overweight | 2025-11-26 |
| Baird | Maintain | Outperform | 2025-11-26 |
| BTIG | Maintain | Buy | 2025-11-26 |
Zscaler’s grades show a generally positive trend with multiple “Buy” and “Outperform” ratings, though a few downgrades to “Market Perform” and “Neutral” are noted.
Nutanix, Inc. Grades
Below are Nutanix’s recent grades from respected financial analysts:
| Grading Company | Action | New Grade | Date |
|---|---|---|---|
| Barclays | Downgrade | Equal Weight | 2026-01-15 |
| Morgan Stanley | Downgrade | Equal Weight | 2026-01-12 |
| RBC Capital | Maintain | Outperform | 2026-01-05 |
| Goldman Sachs | Maintain | Buy | 2025-11-28 |
| JP Morgan | Maintain | Overweight | 2025-11-26 |
| Needham | Maintain | Buy | 2025-11-26 |
| Wells Fargo | Maintain | Equal Weight | 2025-11-26 |
| Morgan Stanley | Maintain | Overweight | 2025-11-26 |
| Keybanc | Maintain | Overweight | 2025-11-26 |
| Piper Sandler | Maintain | Overweight | 2025-11-26 |
Nutanix’s grades reveal a mix of “Buy,” “Overweight,” and “Outperform” ratings, though recent downgrades to “Equal Weight” indicate some caution among analysts.
Which company has the best grades?
Both Zscaler and Nutanix hold a consensus “Buy” rating, but Zscaler benefits from a stronger cluster of “Buy” and “Outperform” grades with fewer downgrades. This suggests that investors may perceive Zscaler as having a slightly more favorable outlook, potentially impacting portfolio positioning and risk assessment.
Strengths and Weaknesses
Below is a comparative overview of the strengths and weaknesses of Zscaler, Inc. and Nutanix, Inc. based on their financial performance, market positioning, and operational metrics as of 2025.
| Criterion | Zscaler, Inc. (ZS) | Nutanix, Inc. (NTNX) |
|---|---|---|
| Diversification | Focused mainly on cloud security services | Diverse product and service segments including subscriptions, professional services, and non-subscription products |
| Profitability | Negative net margin (-1.55%), ROIC at -3.18%, shedding value overall | Positive net margin (7.42%), ROIC at 8.11%, creating value with durable competitive advantage |
| Innovation | Moderate innovation with growing ROIC trend but currently value destructive | Strong innovation with very favorable moat status and increasing profitability |
| Global presence | Significant global cloud security presence | Broad global footprint with a varied product portfolio |
| Market Share | Leading in cloud security but challenged in profitability | Growing market share in hybrid cloud infrastructure solutions |
Key takeaways: Nutanix demonstrates stronger financial health and sustainable competitive advantages, while Zscaler shows improving profitability trends but currently faces value destruction challenges. Diversification and innovation favor Nutanix, making it a more attractive candidate for cautious investors.
Risk Analysis
Below is a comparative table outlining key risks for Zscaler, Inc. (ZS) and Nutanix, Inc. (NTNX) based on the most recent data from 2025:
| Metric | Zscaler, Inc. (ZS) | Nutanix, Inc. (NTNX) |
|---|---|---|
| Market Risk | Beta 1.02, moderate sensitivity to market swings | Beta 0.49, lower volatility exposure |
| Debt Level | Debt-to-equity neutral (1.0), debt-to-assets 28% favorable | Debt-to-equity favorable (-2.14), debt-to-assets 45% neutral |
| Regulatory Risk | Moderate, operates globally in cloud security | Moderate, global enterprise cloud platform exposure |
| Operational Risk | Slightly unfavorable net margin (-1.55%) and ROE (-2.31%) | Mixed margins (7.42%) but unfavorable ROE (-27.12%) |
| Environmental Risk | Low direct environmental impact, typical for software sector | Low direct environmental impact, typical for software sector |
| Geopolitical Risk | Exposure to global markets, sensitive to international cyber regulations | Similar global exposure, with diverse regional presence |
The most impactful risks are operational and financial. Zscaler shows operational challenges with negative profitability ratios and below-par returns, while Nutanix faces financial distress signals with a low Altman Z-score in the distress zone, highlighting bankruptcy risk. Both companies have moderate market and regulatory risks due to their global cloud infrastructure roles. Investors should weigh these risks carefully relative to their risk tolerance.
Which Stock to Choose?
Zscaler, Inc. (ZS) has shown strong income growth with a 297% revenue increase over five years and an improving net margin, yet its profitability ratios remain unfavorable. The company carries moderate debt, a solid current ratio of 2.01, and a slightly unfavorable overall financial ratio profile. Its rating is very favorable, though some key scores are weak, and it demonstrates a slightly unfavorable moat due to ROIC below WACC despite improving trends.
Nutanix, Inc. (NTNX) posts favorable income metrics with 82% revenue growth over five years and positive net margin and EBIT margins. Its financial ratios are slightly favorable overall, with good liquidity and interest coverage, but mixed profitability and a moderate debt level. The company holds a very favorable rating, though with some moderate to unfavorable individual scores, and a very favorable moat with ROIC above WACC and an increasing trend.
For investors prioritizing strong income growth and improving profitability, Zscaler might appear attractive despite its financial ratio weaknesses and value destruction signals. Conversely, Nutanix could be seen as favorable for those valuing a durable competitive advantage and a more balanced financial ratio profile. The choice could depend on whether one favors growth potential or stable value creation.
Disclaimer: Investment carries a risk of loss of initial capital. The past performance is not a reliable indicator of future results. Be sure to understand risks before making an investment decision.
Go Further
I encourage you to read the complete analyses of Zscaler, Inc. and Nutanix, Inc. to enhance your investment decisions: