In the fast-evolving technology sector, Nutanix, Inc. and Veritone, Inc. stand out as innovative players in software infrastructure. Nutanix excels in enterprise cloud platforms and hybrid cloud orchestration, while Veritone leads in AI-driven computing solutions and cognitive data analysis. Their market overlap and distinct innovation strategies make them compelling candidates for comparison. Join me as we explore which company offers the most promising investment opportunity in 2026.
Table of contents
Companies Overview
I will begin the comparison between Nutanix and Veritone by providing an overview of these two companies and their main differences.
Nutanix Overview
Nutanix, Inc. operates as an enterprise cloud platform provider with a global footprint across North America, Europe, Asia Pacific, the Middle East, Latin America, and Africa. The company specializes in infrastructure software solutions including virtualization, enterprise storage, networking, and hybrid cloud orchestration. Established in 2009 and headquartered in San Jose, California, Nutanix serves diverse industries such as automotive, healthcare, financial services, and telecommunications.
Veritone Overview
Veritone, Inc. delivers artificial intelligence computing solutions primarily in the US and the UK, focusing on its aiWARE platform that applies machine learning and cognitive processes to extract insights from structured and unstructured data. Founded in 2014 and based in Denver, Colorado, Veritone also offers media advertising agency services and targets verticals like media and entertainment, government, legal, and energy. The company has a smaller employee base and market capitalization than Nutanix.
Key similarities and differences
Both Nutanix and Veritone operate within the technology sector specializing in software infrastructure, but their core offerings differ significantly. Nutanix focuses on enterprise cloud infrastructure and hybrid cloud management, catering to a broad range of industries with a larger scale and global presence. Veritone concentrates on AI-driven data analytics and media services, targeting specific vertical markets with AI-powered solutions and a smaller operational footprint. Their business models diverge in scope and technological focus.
Income Statement Comparison
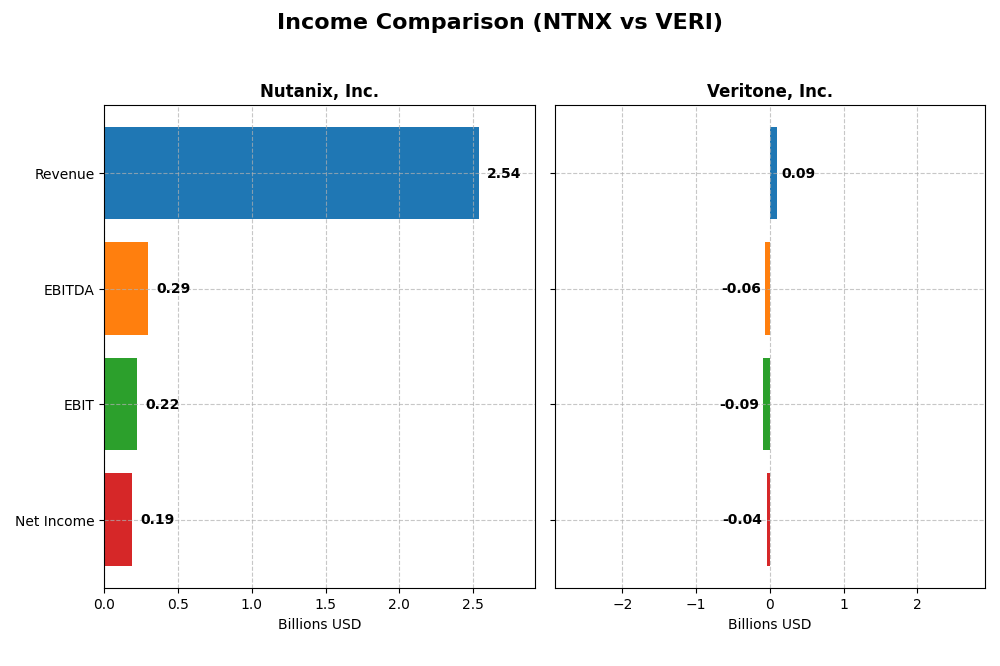
This table presents the latest fiscal year income statement figures for Nutanix, Inc. and Veritone, Inc., offering a concise comparison of their financial performance in 2025 and 2024 respectively.
| Metric | Nutanix, Inc. (NTNX) 2025 | Veritone, Inc. (VERI) 2024 |
|---|---|---|
| Market Cap | 12.4B | 225M |
| Revenue | 2.54B | 93M |
| EBITDA | 293M | -59M |
| EBIT | 220M | -88M |
| Net Income | 188M | -37M |
| EPS | 0.70 | -0.98 |
| Fiscal Year | 2025 | 2024 |
Income Statement Interpretations
Nutanix, Inc.
Nutanix showed a strong upward trend in revenue, growing 82% from 2021 to 2025, with net income turning positive and increasing by 118% over the same period. Gross margin remained high at 86.8%, while net margin improved to 7.4% in 2025. The latest fiscal year saw an 18% revenue increase and a significant 228% rise in net margin, reflecting improved profitability and efficient cost management.
Veritone, Inc.
Veritone’s revenue increased by 61% over 2020–2024 but declined by 7.4% in the most recent year. Net income improved overall by 22%, though it remained negative, with a 40.4% net margin loss in 2024. Gross margin was favorable at 70.6%, but EBIT and interest expense ratios were unfavorable. Despite recent revenue contraction, net margin and EPS showed positive growth trends.
Which one has the stronger fundamentals?
Nutanix exhibits stronger fundamentals with consistently favorable margin improvements, solid revenue growth, and positive net income turnaround. Veritone’s fundamentals are mixed: while it achieved revenue and net income growth over the period, recent declines and unfavorable EBIT and interest expense ratios suggest higher financial risk. Nutanix’s stable margins and profitability provide a more robust income statement profile.
Financial Ratios Comparison
This table presents a side-by-side comparison of key financial ratios for Nutanix, Inc. (NTNX) and Veritone, Inc. (VERI) based on their most recent fiscal year data in 2025 and 2024 respectively.
| Ratios | Nutanix, Inc. (2025) | Veritone, Inc. (2024) |
|---|---|---|
| ROE | -27.1% | -277.9% |
| ROIC | 8.1% | -58.3% |
| P/E | 106.7 | -3.3 |
| P/B | -29.0 | 9.3 |
| Current Ratio | 1.72 | 0.97 |
| Quick Ratio | 1.72 | 0.97 |
| D/E (Debt-to-Equity) | -2.14 | 8.91 |
| Debt-to-Assets | 45.2% | 60.5% |
| Interest Coverage | 8.75 | -7.31 |
| Asset Turnover | 0.77 | 0.47 |
| Fixed Asset Turnover | 9.15 | 8.51 |
| Payout Ratio | 0 | 0 |
| Dividend Yield | 0 | 0 |
Interpretation of the Ratios
Nutanix, Inc.
Nutanix shows a mixed ratio profile with several favorable liquidity ratios like a current ratio of 1.72, and strong interest coverage at 11.15, but suffers from an unfavorable return on equity at -27.12% and a high PE of 106.74, indicating potential valuation concerns. The company does not pay dividends, reflecting a reinvestment or growth focus without shareholder payouts.
Veritone, Inc.
Veritone’s financial ratios are mostly unfavorable, including a negative net margin of -40.36%, a deeply negative ROE of -277.91%, and high debt levels with a debt-to-equity of 8.91 and interest coverage of -7.3. The company also does not pay dividends, likely due to ongoing losses and a strategy emphasizing investment over distributions.
Which one has the best ratios?
Nutanix presents a more balanced ratio set with half of its ratios favorable and a slightly favorable overall opinion, contrasting sharply with Veritone’s predominantly unfavorable ratios and very unfavorable global view. Nutanix’s stronger liquidity and coverage metrics suggest comparatively better financial health, despite some valuation and profitability weaknesses.
Strategic Positioning
This section compares the strategic positioning of Nutanix and Veritone, focusing on Market position, Key segments, and exposure to technological disruption:
Nutanix, Inc.
- Positioned as a global enterprise cloud platform provider with low beta and $12.4B market cap.
- Key segments include subscription software, professional services, and enterprise cloud products.
- Exposure involves cloud infrastructure and virtualization technologies with broad industry usage.
Veritone, Inc.
- Smaller AI computing solutions provider with high beta and $225M market cap focused on US, UK.
- Focus on AI platform solutions, media advertising services, and managed software products.
- AI-driven machine learning and cognitive processes targeting media, government, and energy sectors.
Nutanix, Inc. vs Veritone, Inc. Positioning
Nutanix maintains a diversified global cloud infrastructure portfolio across multiple industries, while Veritone concentrates on AI computing and media services in fewer markets. Nutanix’s larger scale contrasts with Veritone’s niche AI focus and smaller workforce.
Which has the best competitive advantage?
Nutanix shows a very favorable moat with growing ROIC above WACC, indicating durable value creation and competitive advantage. Veritone’s declining ROIC and value destruction suggest a very unfavorable moat and weaker competitive positioning.
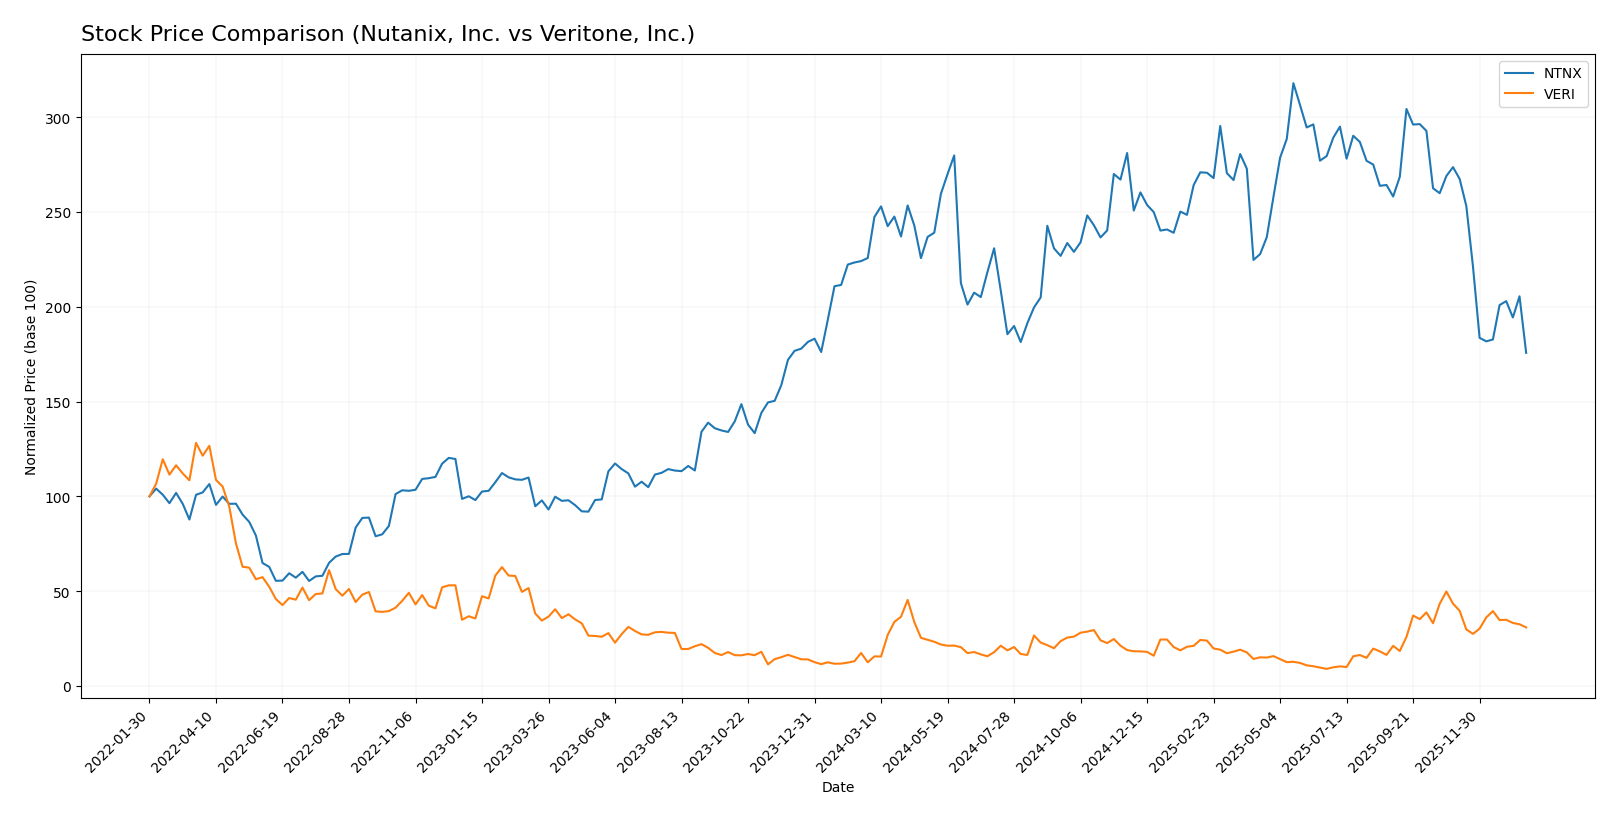
Stock Comparison
The stock price movements of Nutanix, Inc. (NTNX) and Veritone, Inc. (VERI) over the past 12 months reveal contrasting trends, with NTNX experiencing a significant decline and VERI showing a substantial rise, both facing seller dominance in recent trading.
Trend Analysis
Nutanix, Inc. (NTNX) displays a bearish trend with a 22.16% price decline over the past year, accompanied by a deceleration in trend momentum and a high volatility level (8.67 std deviation). The stock peaked at 82.77 and hit a low of 45.74.
Veritone, Inc. (VERI) shows a bullish trend with a 147.22% increase in stock price over the past year, though the trend’s acceleration has slowed and volatility remains low (1.26 std deviation). The stock’s high was 7.18, with a low at 1.3.
Comparing both, VERI delivered the highest market performance with a strong positive return, while NTNX faced a notable downturn, reflecting divergent investor sentiment and market dynamics.
Target Prices
The current target price consensus for Nutanix, Inc. and Veritone, Inc. reflects moderate optimism among analysts.
| Company | Target High | Target Low | Consensus |
|---|---|---|---|
| Nutanix, Inc. | 90 | 53 | 64.67 |
| Veritone, Inc. | 10 | 9 | 9.5 |
Analysts expect Nutanix’s stock price to rise significantly above its current $45.74, while Veritone’s consensus target price more than doubles its present $4.45, indicating bullish outlooks for both.
Analyst Opinions Comparison
This section compares analysts’ ratings and grades for Nutanix, Inc. and Veritone, Inc.:
Rating Comparison
NTNX Rating
- Rating: C+, evaluated as Very Favorable by analysts.
- Discounted Cash Flow Score: 4, indicating a Favorable outlook on future cash flows.
- ROE Score: 1, considered Very Unfavorable for profitability from equity.
- ROA Score: 4, Favorable, reflecting effective utilization of assets.
- Debt To Equity Score: 1, Very Unfavorable, suggesting higher financial risk.
- Overall Score: 2, categorized as Moderate in overall financial standing.
VERI Rating
- Rating: C, also evaluated as Very Favorable by analysts.
- Discounted Cash Flow Score: 5, rated Very Favorable, showing stronger cash flow prospects.
- ROE Score: 1, also Very Unfavorable, indicating poor profit generation efficiency.
- ROA Score: 1, Very Unfavorable, indicating weak asset utilization.
- Debt To Equity Score: 1, Very Unfavorable, showing similar financial risk.
- Overall Score: 2, also Moderate, reflecting comparable overall financial health.
Which one is the best rated?
Veritone holds a slightly higher Discounted Cash Flow Score than Nutanix, indicating better valuation prospects, but Nutanix outperforms Veritone on Return on Assets. Both have identical overall and risk-related scores, resulting in a comparable analyst rating profile.
Scores Comparison
The scores comparison between Nutanix, Inc. and Veritone, Inc. is as follows:
NTNX Scores
- Altman Z-Score: 1.48, indicating financial distress zone.
- Piotroski Score: 6, reflecting average financial strength.
VERI Scores
- Altman Z-Score: -0.07, also in financial distress zone.
- Piotroski Score: 3, indicating very weak financial health.
Which company has the best scores?
Nutanix shows a higher Piotroski Score (6 vs. 3), suggesting better financial strength. Both are in the Altman distress zone, but Veritone’s Z-Score is lower, indicating higher bankruptcy risk.
Grades Comparison
The grades assigned to Nutanix, Inc. and Veritone, Inc. by recognized financial institutions are as follows:
Nutanix, Inc. Grades
The following table summarizes recent grades from reputable financial firms for Nutanix, Inc.:
| Grading Company | Action | New Grade | Date |
|---|---|---|---|
| Barclays | Downgrade | Equal Weight | 2026-01-15 |
| Morgan Stanley | Downgrade | Equal Weight | 2026-01-12 |
| RBC Capital | Maintain | Outperform | 2026-01-05 |
| Goldman Sachs | Maintain | Buy | 2025-11-28 |
| JP Morgan | Maintain | Overweight | 2025-11-26 |
| Needham | Maintain | Buy | 2025-11-26 |
| Wells Fargo | Maintain | Equal Weight | 2025-11-26 |
| Morgan Stanley | Maintain | Overweight | 2025-11-26 |
| Keybanc | Maintain | Overweight | 2025-11-26 |
| Piper Sandler | Maintain | Overweight | 2025-11-26 |
Overall, Nutanix’s grades show a mix of strong buy-side support with some recent downgrades to equal weight, indicating a cautious shift among top analysts.
Veritone, Inc. Grades
The following table details recent grades from financial firms for Veritone, Inc.:
| Grading Company | Action | New Grade | Date |
|---|---|---|---|
| D. Boral Capital | Maintain | Buy | 2025-12-09 |
| D. Boral Capital | Maintain | Buy | 2025-12-04 |
| Needham | Maintain | Buy | 2025-12-02 |
| D. Boral Capital | Maintain | Buy | 2025-12-02 |
| D. Boral Capital | Maintain | Buy | 2025-11-07 |
| D. Boral Capital | Maintain | Buy | 2025-10-28 |
| HC Wainwright & Co. | Maintain | Buy | 2025-10-20 |
| D. Boral Capital | Maintain | Buy | 2025-10-15 |
| D. Boral Capital | Maintain | Buy | 2025-09-24 |
| D. Boral Capital | Maintain | Buy | 2025-09-09 |
Veritone’s grades consistently reflect buy ratings with no changes, showing steady analyst confidence.
Which company has the best grades?
Nutanix, Inc. has a broader range of grades with some downgrades to equal weight, while Veritone, Inc. maintains a consistent buy rating. This suggests that investors may view Veritone with steadier confidence, whereas Nutanix faces a more mixed analyst sentiment that could imply varied risk and reward expectations.
Strengths and Weaknesses
Below is a comparison table highlighting the key strengths and weaknesses of Nutanix, Inc. (NTNX) and Veritone, Inc. (VERI) based on their recent financial and operational data.
| Criterion | Nutanix, Inc. (NTNX) | Veritone, Inc. (VERI) |
|---|---|---|
| Diversification | Strong subscription-based revenue (~$2B in 2024), professional services add stability | Diverse revenue streams including software products and managed services, but smaller scale (~$62M software products in 2024) |
| Profitability | Moderate net margin (7.42%), positive ROIC (8.11%), but negative ROE (-27.12%) | Negative net margin (-40.36%), negative ROIC (-58.27%), and negative ROE (-277.91%) indicate poor profitability |
| Innovation | Demonstrates durable competitive advantage with growing ROIC, reflecting effective innovation in cloud infrastructure | Declining ROIC and unfavorable financial ratios suggest difficulties in sustaining innovation and profitability |
| Global presence | Established global presence supported by significant recurring revenue | Smaller scale and less mature global footprint |
| Market Share | Large market share in cloud infrastructure and enterprise software | Niche player in AI-powered software and services with limited market penetration |
Key takeaways: Nutanix shows a solid and growing competitive position with strong subscription revenues and a favorable moat, despite some profitability challenges. Veritone faces significant financial headwinds and value destruction, cautioning investors to carefully assess risks before considering an investment.
Risk Analysis
Below is a comparison of key risks associated with Nutanix, Inc. (NTNX) and Veritone, Inc. (VERI) based on the most recent financial and operational data available in 2026:
| Metric | Nutanix, Inc. (NTNX) | Veritone, Inc. (VERI) |
|---|---|---|
| Market Risk | Beta 0.49, relatively low volatility | Beta 2.05, high volatility and sensitivity to market swings |
| Debt level | Debt to equity: -2.14 (favorable), debt to assets: 45.16% (neutral) | Debt to equity: 8.91 (unfavorable), debt to assets: 60.54% (high leverage) |
| Regulatory Risk | Moderate, operates globally with compliance requirements | Moderate, US and UK focus with evolving AI regulations |
| Operational Risk | Medium, large employee base (7,150) with diverse product lines | High, smaller workforce (469) and reliance on AI platform operations |
| Environmental Risk | Standard for software sector, minimal direct exposure | Low direct exposure, but AI data centers may impact energy use |
| Geopolitical Risk | Exposure through global markets, potentially moderate | Limited but growing exposure due to UK operations |
In synthesis, Veritone faces higher market and debt risks with a beta over 2 and significant leverage, plus operational challenges due to smaller scale. Nutanix shows lower market risk and better debt management but carries moderate operational and geopolitical exposure. Veritone’s financial distress indicators and weak Piotroski score add to its risk profile, making Nutanix comparatively more stable though not without caution.
Which Stock to Choose?
Nutanix, Inc. (NTNX) shows a favorable income evolution with 18.11% revenue growth in 2025 and strong profitability metrics, including a 7.42% net margin. Its financial ratios are slightly favorable overall, with a strong current ratio of 1.72 and a very favorable interest coverage of 11.15. Despite a negative return on equity of -27.12%, the company’s debt profile and return on invested capital indicate value creation, supported by a very favorable economic moat and a moderate overall rating of C+.
Veritone, Inc. (VERI) presents a mixed financial picture with a 7.35% revenue decline in 2024 but some positive net margin growth overall. However, its financial ratios are very unfavorable with weak profitability indicators such as a -40.36% net margin and a negative return on equity of -277.91%. The company carries high debt levels and a very unfavorable economic moat, accompanied by a moderate rating of C. Its recent stock price trend was bullish overall but shows recent deceleration.
For investors prioritizing growth and profitability, Nutanix’s favorable income growth, improving profitability, and strong competitive advantage might signal a more stable outlook. Conversely, investors with a higher risk tolerance seeking potential turnaround plays could find Veritone’s recent stock appreciation and valuation metrics worth monitoring, despite its current financial challenges. The choice could thus depend on the investor’s risk profile and investment strategy.
Disclaimer: Investment carries a risk of loss of initial capital. The past performance is not a reliable indicator of future results. Be sure to understand risks before making an investment decision.
Go Further
I encourage you to read the complete analyses of Nutanix, Inc. and Veritone, Inc. to enhance your investment decisions: