VeriSign, Inc. and Nutanix, Inc. are two key players in the software infrastructure industry, each driving innovation in internet security and cloud computing. VeriSign anchors global online stability through domain registry services, while Nutanix pioneers enterprise cloud platforms and hybrid cloud solutions. Their shared focus on cutting-edge technology and market influence makes this comparison essential. Let’s explore which company offers the most compelling investment opportunity for your portfolio.

Table of contents
Companies Overview
I will begin the comparison between VeriSign and Nutanix by providing an overview of these two companies and their main differences.
VeriSign Overview
VeriSign, Inc. specializes in domain name registry services and internet infrastructure, ensuring the security and stability of key internet domains like .com and .net. Founded in 1995 and headquartered in Reston, Virginia, VeriSign operates critical internet root servers and supports global e-commerce through its authoritative domain resolution services, positioning it as a cornerstone of internet infrastructure.
Nutanix Overview
Nutanix, Inc. offers an enterprise cloud platform that integrates virtualization, storage, and networking services across multiple regions worldwide. Founded in 2009 and based in San Jose, California, Nutanix provides hybrid cloud orchestration, database automation, and desktop-as-a-service products, serving a broad spectrum of industries with solutions designed to simplify cloud-native and hybrid cloud environments.
Key similarities and differences
Both VeriSign and Nutanix operate within the Software – Infrastructure industry, focusing on essential services that support internet and enterprise cloud operations. VeriSign emphasizes domain registry and internet stability, while Nutanix concentrates on cloud platform solutions and virtualization. Their business models differ in scope: VeriSign offers foundational internet infrastructure, whereas Nutanix delivers integrated cloud and virtualization technologies to enterprises globally.
Income Statement Comparison
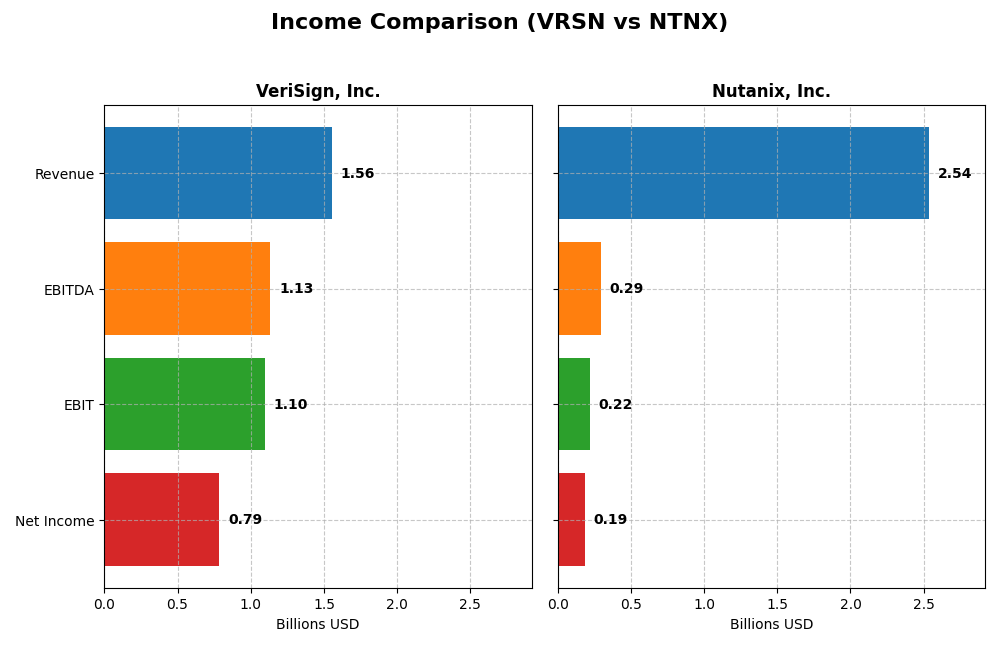
This table presents a side-by-side comparison of key income statement metrics for VeriSign, Inc. and Nutanix, Inc. for their most recent fiscal years.
| Metric | VeriSign, Inc. (2024) | Nutanix, Inc. (2025) |
|---|---|---|
| Market Cap | 23.1B | 12.4B |
| Revenue | 1.56B | 2.54B |
| EBITDA | 1.13B | 293M |
| EBIT | 1.10B | 220M |
| Net Income | 786M | 188M |
| EPS | 8.01 | 0.70 |
| Fiscal Year | 2024 | 2025 |
Income Statement Interpretations
VeriSign, Inc.
VeriSign’s revenue showed a steady increase from 1.27B in 2020 to 1.56B in 2024, a 23.11% growth over the period. Net income, however, declined slightly overall, with a recent decrease to 786M in 2024 from 818M in 2023. Margins remain robust, with gross margin at 87.7% and net margin above 50%, though net margin declined by 7.87% in the last year, signaling some margin pressure despite solid top-line growth.
Nutanix, Inc.
Nutanix’s revenue rose significantly from 1.39B in 2021 to 2.54B in 2025, an 82.01% increase, with net income turning positive to 188M in 2025 after losses in prior years. Margins improved markedly, with net margin reaching 7.42% in 2025 and EBIT margin improving to 8.67%. The company demonstrated strong recent growth, with net income and EPS growing over 220% year-on-year, reflecting operational leverage and margin expansion.
Which one has the stronger fundamentals?
VeriSign exhibits stable, high margins and consistent revenue growth but faces slight net income and margin declines, indicating mature profitability. Nutanix shows rapid revenue growth and a significant turnaround from losses to positive net income and margin expansion, highlighting improving fundamentals but at a lower absolute margin level. Both companies show favorable income statement evaluations, with Nutanix showing stronger growth dynamics and VeriSign maintaining superior margin stability.
Financial Ratios Comparison
The table below presents the most recent financial ratios for VeriSign, Inc. (VRSN) and Nutanix, Inc. (NTNX) based on their fiscal year-end data, providing a snapshot of their profitability, liquidity, leverage, and market valuation.
| Ratios | VeriSign, Inc. (2024) | Nutanix, Inc. (2025) |
|---|---|---|
| ROE | -40.1% | -27.1% |
| ROIC | 4.51% | 8.11% |
| P/E | 25.8 | 106.7 |
| P/B | -10.4 | -29.0 |
| Current Ratio | 0.43 | 1.72 |
| Quick Ratio | 0.43 | 1.72 |
| D/E (Debt-to-Equity) | -0.92 | -2.14 |
| Debt-to-Assets | 128.1% | 45.2% |
| Interest Coverage | 14.1 | 8.75 |
| Asset Turnover | 1.11 | 0.77 |
| Fixed Asset Turnover | 6.66 | 9.15 |
| Payout ratio | 0 | 0 |
| Dividend yield | 0% | 0% |
Interpretation of the Ratios
VeriSign, Inc.
VeriSign’s ratios present a mixed picture, with strong net margin at 50.45% and a robust return on invested capital of 451%, indicating efficient capital use. However, concerns arise from a negative return on equity (-40.13%) and weak liquidity ratios (current and quick ratios at 0.43). The company pays dividends, but with a zero dividend yield, signaling limited shareholder returns currently.
Nutanix, Inc.
Nutanix shows generally moderate financial health, with a neutral net margin of 7.42% and an 8.11% ROIC, reflecting steady but unspectacular profitability. Liquidity is sound, with current and quick ratios at 1.72, and leverage metrics are favorable. The company does not pay dividends, reflecting a reinvestment strategy during its growth phase, focusing on R&D and expansion efforts.
Which one has the best ratios?
VeriSign exhibits more favorable profitability and capital efficiency metrics but struggles with liquidity and negative equity returns. Nutanix offers better liquidity and moderate profitability, with fewer unfavorable ratios. Overall, VeriSign’s ratios are more favorable in profitability, while Nutanix’s strengths lie in liquidity and moderate risk, leading to a slightly favorable view.
Strategic Positioning
This section compares the strategic positioning of VeriSign and Nutanix, focusing on Market position, Key segments, and Exposure to technological disruption:
VeriSign, Inc. (VRSN)
- Dominates domain registry with key .com and .net domains; faces limited direct competition in internet infrastructure services.
- Focus on domain name registry and internet infrastructure services supporting global e-commerce and stability.
- Exposure mainly to internet infrastructure stability; less impacted by rapid tech disruptions but reliant on internet protocols.
Nutanix, Inc. (NTNX)
- Competes in enterprise cloud platform market with broad global presence; faces intense competition in cloud and virtualization.
- Diverse product suite including cloud platform, virtualization, automation, storage, and hybrid cloud orchestration.
- High exposure to cloud computing and virtualization technology shifts; must adapt to evolving enterprise IT demands.
VeriSign, Inc. vs Nutanix, Inc. Positioning
VeriSign’s strategy is concentrated on domain registry and internet infrastructure, providing stable, specialized services. Nutanix pursues a diversified enterprise cloud platform approach, addressing multiple IT needs. VeriSign benefits from niche dominance; Nutanix faces broader market challenges and innovation demands.
Which has the best competitive advantage?
Both companies demonstrate a very favorable moat with growing ROIC, indicating durable competitive advantages. VeriSign’s niche dominance suggests a stronger moat due to specialized market control, while Nutanix’s diversified offerings require continuous innovation to maintain its advantage.
Stock Comparison
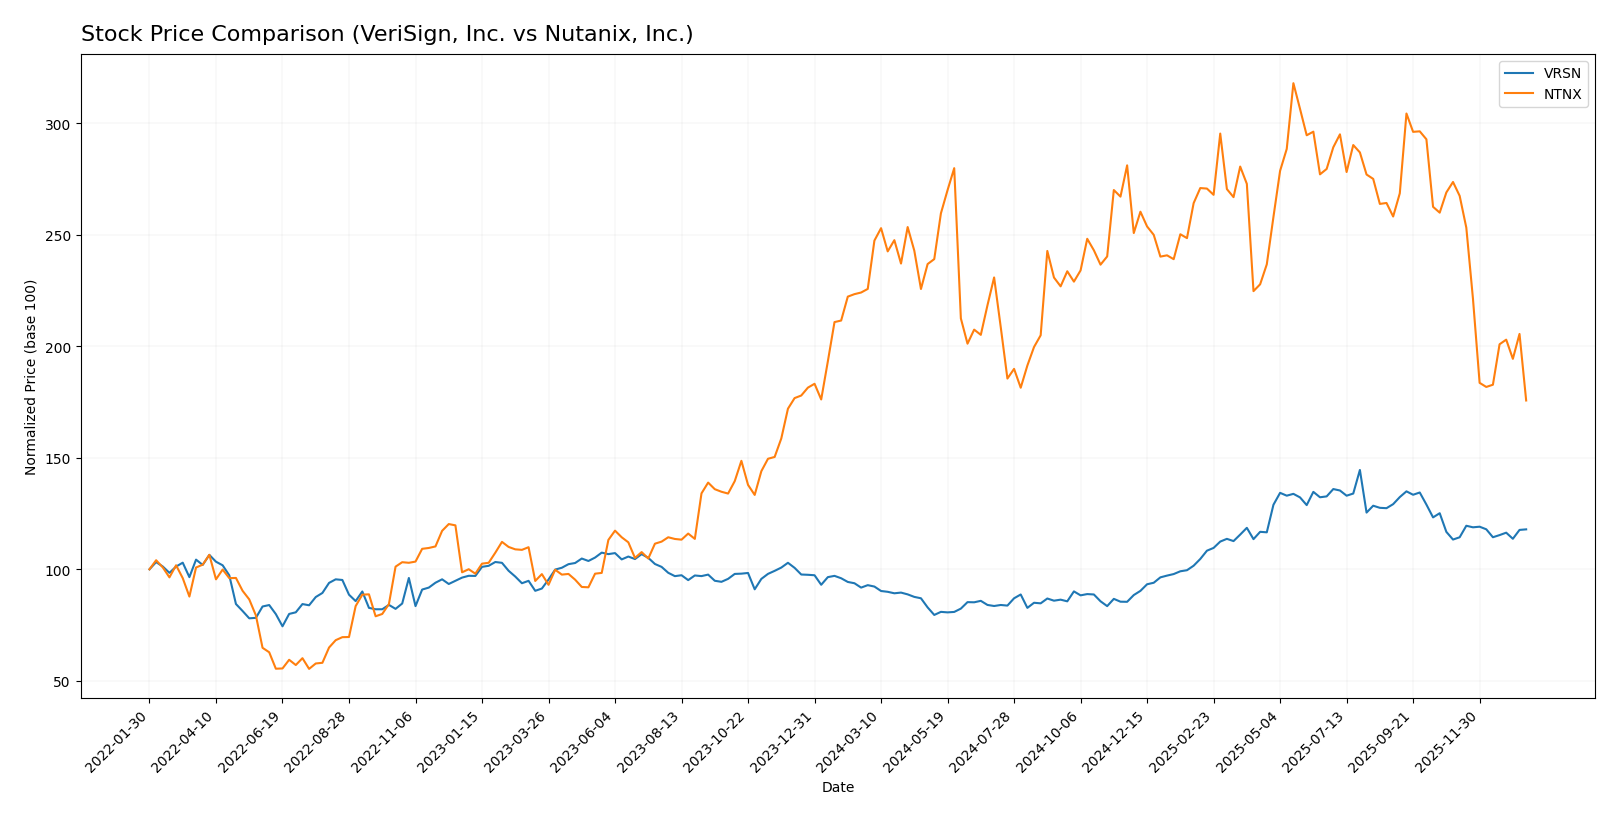
The stock price chart over the past year highlights VeriSign, Inc.’s strong bullish momentum contrasted with Nutanix, Inc.’s bearish trend, reflecting divergent trading dynamics and market sentiment.
Trend Analysis
VeriSign, Inc. (VRSN) exhibited a 26.92% price increase over the past 12 months, indicating a bullish trend with deceleration in momentum. The stock ranged between 168.32 and 305.79, showing moderate volatility (std. dev. 40.88).
Nutanix, Inc. (NTNX) showed a 22.16% decline over the same period, marking a bearish trend with decelerating losses. Price fluctuated from 45.74 to 82.77, and volatility was lower (std. dev. 8.67).
Comparing trends, VeriSign delivered the highest market performance with sustained gains, whereas Nutanix faced significant price depreciation and seller dominance recently.
Target Prices
Analysts present a clear target price consensus for VeriSign, Inc. and Nutanix, Inc., reflecting their expectations for these stocks.
| Company | Target High | Target Low | Consensus |
|---|---|---|---|
| VeriSign, Inc. | 325 | 325 | 325 |
| Nutanix, Inc. | 90 | 53 | 64.67 |
VeriSign’s target price of $325 indicates a strong upside from its current $249.47, suggesting positive analyst confidence. Nutanix’s wider target range reflects more uncertainty but implies potential growth from its present $45.74 price.
Analyst Opinions Comparison
This section compares analysts’ ratings and grades for VeriSign, Inc. and Nutanix, Inc.:
Rating Comparison
VeriSign, Inc. Rating
- Rating: B-, considered very favorable by analysts.
- Discounted Cash Flow Score: 4, indicating favorable DCF.
- ROE Score: 1, rated very unfavorable for return on equity.
- ROA Score: 5, very favorable asset utilization.
- Debt To Equity Score: 1, very unfavorable due to high debt.
- Overall Score: 2, moderate overall financial standing.
Nutanix, Inc. Rating
- Rating: C+, also considered very favorable by analysts.
- Discounted Cash Flow Score: 4, indicating favorable DCF.
- ROE Score: 1, also very unfavorable in return on equity.
- ROA Score: 4, favorable but lower than VeriSign’s score.
- Debt To Equity Score: 1, also very unfavorable with high debt.
- Overall Score: 2, moderate overall financial standing.
Which one is the best rated?
Based on the provided data, VeriSign holds a slightly better rating (B-) compared to Nutanix’s C+, with both sharing moderate overall scores. VeriSign’s stronger ROA score contributes to its marginally better evaluation.
Scores Comparison
Here is a comparison of the Altman Z-Score and Piotroski Score for VeriSign and Nutanix:
VeriSign Scores
- Altman Z-Score: -4.67, indicating distress zone with high bankruptcy risk.
- Piotroski Score: 8, classified as very strong financial health.
Nutanix Scores
- Altman Z-Score: 1.48, also in distress zone, showing financial vulnerability.
- Piotroski Score: 6, reflecting average financial strength.
Which company has the best scores?
VeriSign has a much stronger Piotroski Score (8 vs. 6), indicating better financial health, while both companies fall in the distress zone by Altman Z-Score. Thus, VeriSign shows stronger financial fundamentals despite bankruptcy risk concerns.
Grades Comparison
The following presents the recent grades from verified grading companies for VeriSign, Inc. and Nutanix, Inc.:
VeriSign, Inc. Grades
This table summarizes the latest grades assigned by reputable financial institutions for VeriSign, Inc.:
| Grading Company | Action | New Grade | Date |
|---|---|---|---|
| JP Morgan | maintain | Neutral | 2026-01-06 |
| Baird | maintain | Outperform | 2025-07-01 |
| Baird | maintain | Outperform | 2025-04-25 |
| Baird | maintain | Outperform | 2025-04-01 |
| Citigroup | maintain | Buy | 2025-02-04 |
| Citigroup | maintain | Buy | 2025-01-03 |
| Baird | upgrade | Outperform | 2024-12-09 |
| Baird | maintain | Neutral | 2024-06-27 |
| Baird | maintain | Neutral | 2024-04-26 |
| Citigroup | maintain | Buy | 2024-04-02 |
VeriSign’s grades predominantly range from Neutral to Outperform, with consistent Buy ratings from Citigroup, showing a stable positive outlook.
Nutanix, Inc. Grades
Below is the summary of recent grades from verified grading companies for Nutanix, Inc.:
| Grading Company | Action | New Grade | Date |
|---|---|---|---|
| Barclays | downgrade | Equal Weight | 2026-01-15 |
| Morgan Stanley | downgrade | Equal Weight | 2026-01-12 |
| RBC Capital | maintain | Outperform | 2026-01-05 |
| Goldman Sachs | maintain | Buy | 2025-11-28 |
| JP Morgan | maintain | Overweight | 2025-11-26 |
| Needham | maintain | Buy | 2025-11-26 |
| Wells Fargo | maintain | Equal Weight | 2025-11-26 |
| Morgan Stanley | maintain | Overweight | 2025-11-26 |
| Keybanc | maintain | Overweight | 2025-11-26 |
| Piper Sandler | maintain | Overweight | 2025-11-26 |
Nutanix shows a more mixed pattern with recent downgrades to Equal Weight from previously higher ratings, indicating some caution among analysts.
Which company has the best grades?
Both VeriSign and Nutanix have a consensus “Buy” rating, but VeriSign’s grades are more consistently positive with multiple Outperform and Buy ratings maintained over time. Nutanix, despite a higher quantity of Buy and Overweight ratings, has recent downgrades to Equal Weight that may indicate increasing uncertainty. These trends could influence investor confidence differently based on risk tolerance and market outlook.
Strengths and Weaknesses
Below is a comparative table highlighting the key strengths and weaknesses of VeriSign, Inc. (VRSN) and Nutanix, Inc. (NTNX) based on recent financial and operational data.
| Criterion | VeriSign, Inc. (VRSN) | Nutanix, Inc. (NTNX) |
|---|---|---|
| Diversification | Limited product diversification; primarily domain-related services | Moderate diversification with subscription, professional services, and non-subscription products |
| Profitability | High net margin (50.45%) but negative ROE (-40.13%) | Low net margin (7.42%) and negative ROE (-27.12%) |
| Innovation | Strong economic moat with very favorable growing ROIC | Positive value creation with growing ROIC, but lower scale |
| Global presence | Well-established global presence in internet infrastructure | Growing global presence, especially in cloud computing sectors |
| Market Share | Dominant in domain name registry market | Competitive position in enterprise cloud software |
VeriSign stands out for its exceptional profitability and strong economic moat, though it has limited diversification. Nutanix shows promising growth and diversification but faces challenges in profitability and market penetration. Investors should weigh VeriSign’s stable dominance against Nutanix’s growth potential and broader product mix.
Risk Analysis
Below is a comparative table of key risks for VeriSign, Inc. (VRSN) and Nutanix, Inc. (NTNX) based on the most recent data from 2025-2026:
| Metric | VeriSign, Inc. (VRSN) | Nutanix, Inc. (NTNX) |
|---|---|---|
| Market Risk | Moderate (Beta 0.77) | Lower (Beta 0.49) |
| Debt level | High debt-to-assets (128%) | Moderate debt-to-assets (45%) |
| Regulatory Risk | Moderate (internet infrastructure regulations) | Moderate (cloud and data privacy regulations) |
| Operational Risk | Low (stable domain registry services) | Moderate (complex software integration) |
| Environmental Risk | Low (digital services, minimal footprint) | Low (cloud infrastructure-focused) |
| Geopolitical Risk | Moderate (global internet governance) | Moderate (global cloud service markets) |
The most impactful risks are VeriSign’s high debt relative to assets and Nutanix’s operational complexity coupled with elevated valuation risks. VeriSign’s financial distress signals in Altman Z-Score highlight potential solvency concerns, while Nutanix’s moderate debt and average financial strength suggest cautious optimism. Market and regulatory environments remain important but less immediate threats.
Which Stock to Choose?
VeriSign, Inc. (VRSN) shows steady income growth with a 4.31% revenue increase in 2024 and a favorable gross margin of 87.71%. Its financial ratios are mostly favorable, including a strong ROIC of 451%, despite a negative ROE and low current ratio. The company carries moderate debt but has a very favorable credit rating of B- and a durable competitive advantage.
Nutanix, Inc. (NTNX) reports robust income growth with an 18.11% revenue increase in 2025 and a solid gross margin of 86.81%. Its financial ratios are mixed, showing slightly favorable global ratings, a lower ROIC at 8.11%, and better liquidity metrics. Nutanix has higher net debt relative to EBITDA and a favorable C+ rating, reflecting a growing but riskier profile.
Investors focused on stable value creation and profitability might find VeriSign’s strong ROIC and favorable income statement metrics more convincing. Conversely, those prioritizing growth potential and liquidity could see Nutanix’s accelerating revenue and improving ratios as indicative of future opportunities, despite higher risk. Both firms demonstrate durable moats but appeal differently depending on risk tolerance and investment strategy.
Disclaimer: Investment carries a risk of loss of initial capital. The past performance is not a reliable indicator of future results. Be sure to understand risks before making an investment decision.
Go Further
I encourage you to read the complete analyses of VeriSign, Inc. and Nutanix, Inc. to enhance your investment decisions: