In today’s fast-evolving technology landscape, Nutanix, Inc. and UiPath Inc. stand out as innovators in the software infrastructure sector. Nutanix excels in enterprise cloud platforms and hybrid cloud orchestration, while UiPath leads in robotic process automation with AI-driven solutions. Both companies target overlapping enterprise markets, making their strategies and growth potential highly relevant for investors. Join me as we analyze which company presents the most compelling investment opportunity in 2026.
Table of contents
Companies Overview
I will begin the comparison between Nutanix and UiPath by providing an overview of these two companies and their main differences.
Nutanix Overview
Nutanix, Inc. offers an enterprise cloud platform serving customers globally across industries like automotive, healthcare, and telecommunications. The company’s products include virtualization, storage, cloud governance, and automation services designed to simplify hybrid cloud orchestration. Founded in 2009 and based in San Jose, California, Nutanix operates in the software infrastructure sector with a market cap of approximately 12.4B USD.
UiPath Overview
UiPath Inc. provides an end-to-end robotic process automation (RPA) platform focused mainly on the U.S., Romania, and Japan markets. Its software suite enables organizations to build and manage automation workflows using AI and low-code tools, targeting sectors such as banking, healthcare, and government. Founded in 2005 and headquartered in New York City, UiPath holds a market cap around 7.7B USD within the software infrastructure industry.
Key similarities and differences
Both Nutanix and UiPath operate in the software infrastructure industry, emphasizing automation and cloud-based solutions. Nutanix focuses on enterprise cloud platforms and hybrid cloud management, while UiPath specializes in robotic process automation combining AI and low-code development. Their geographic reach and customer bases differ, with Nutanix serving a broad range of industries worldwide and UiPath concentrating on automation for specific sectors in select countries.
Income Statement Comparison
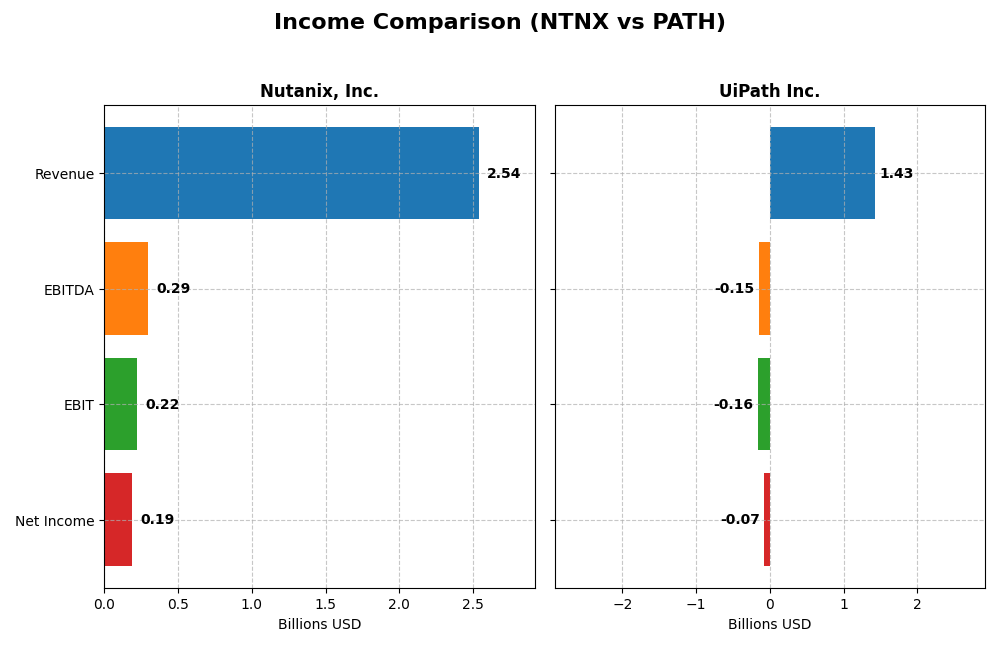
The table below compares key income statement metrics for Nutanix, Inc. and UiPath Inc. for the fiscal year 2025, providing a snapshot of their financial performance.
| Metric | Nutanix, Inc. (NTNX) | UiPath Inc. (PATH) |
|---|---|---|
| Market Cap | 12.4B | 7.7B |
| Revenue | 2.54B | 1.43B |
| EBITDA | 293M | -145M |
| EBIT | 220M | -163M |
| Net Income | 188M | -74M |
| EPS | 0.70 | -0.13 |
| Fiscal Year | 2025 | 2025 |
Income Statement Interpretations
Nutanix, Inc.
Nutanix has shown strong revenue growth from 2021 to 2025, increasing from $1.39B to $2.54B, with net income turning positive in 2025 at $188M after several years of losses. Gross margin remained high and favorable at 86.8%, while net margin improved significantly to 7.4%. The 2025 fiscal year marked a notable acceleration in profitability and margin expansion.
UiPath Inc.
UiPath’s revenue rose steadily over five years from $608M in 2021 to $1.43B in 2025, with a 9.3% growth in the last year. However, it still reported a net loss of $74M in 2025, despite improving net margin and EPS. Gross margin held favorably at 82.7%, but EBIT and net margins remain negative, reflecting ongoing operational challenges.
Which one has the stronger fundamentals?
Nutanix displays stronger fundamentals with consistent revenue and net income growth, favorable gross and net margins, and a positive EBIT margin in 2025. UiPath shows solid revenue growth but continues to operate at a loss with unfavorable EBIT and net margins. Nutanix’s income statement indicators are more robust and reflect better profitability trends.
Financial Ratios Comparison
This table presents a side-by-side view of key financial ratios for Nutanix, Inc. and UiPath Inc. based on their most recent fiscal year data, enabling straightforward comparison of their financial profiles.
| Ratios | Nutanix, Inc. (NTNX) FY 2025 | UiPath Inc. (PATH) FY 2025 |
|---|---|---|
| ROE | -27.1% | -4.0% |
| ROIC | 8.1% | -7.4% |
| P/E | 106.7 | -108.0 |
| P/B | -29.0 | 4.3 |
| Current Ratio | 1.72 | 2.93 |
| Quick Ratio | 1.72 | 2.93 |
| D/E (Debt-to-Equity) | -2.14 | 0.04 |
| Debt-to-Assets | 45.2% | 2.7% |
| Interest Coverage | 8.7 | 0 |
| Asset Turnover | 0.77 | 0.50 |
| Fixed Asset Turnover | 9.15 | 14.41 |
| Payout Ratio | 0 | 0 |
| Dividend Yield | 0 | 0 |
Interpretation of the Ratios
Nutanix, Inc.
Nutanix shows a mixed ratio profile with half of its key metrics favorable, including a strong current ratio of 1.72 and interest coverage of 11.15, signaling liquidity and debt service capacity. However, a negative return on equity at -27.12% and a high P/E of 106.74 raise concerns. The company does not pay dividends, likely reflecting reinvestment in growth and operations.
UiPath Inc.
UiPath presents weaker financial ratios, with half of its key metrics unfavorable such as negative net margin (-5.15%) and return on invested capital (-7.41%). The current ratio stands at a solid 2.93, indicating good short-term liquidity. UiPath also does not issue dividends, which may relate to ongoing investment in research, development, and expansion initiatives.
Which one has the best ratios?
Nutanix has a slightly favorable overall ratio evaluation, benefiting from better coverage ratios and liquidity, despite some profitability weaknesses. UiPath’s ratios are slightly unfavorable, reflecting challenges in profitability and asset efficiency. Thus, Nutanix’s metrics demonstrate a comparatively more balanced financial standing in 2025.
Strategic Positioning
This section compares the strategic positioning of Nutanix, Inc. and UiPath Inc., focusing on Market position, Key segments, and Exposure to technological disruption:
Nutanix, Inc.
- Established enterprise cloud platform with global reach and moderate competitive pressure.
- Key segments include subscription services, professional services, and enterprise cloud infrastructure.
- Exposure linked to advancements in cloud computing and hybrid cloud orchestration technologies.
UiPath Inc.
- End-to-end automation platform with strong presence in US, Romania, and Japan amid competitive RPA market.
- Key segments cover license sales, subscription services, and professional services in automation software.
- Exposure to AI integration and robotic process automation innovations driving business automation.
Nutanix vs UiPath Positioning
Nutanix pursues a diversified approach with multiple cloud and infrastructure products across various industries, supported by a broad geographic footprint. UiPath concentrates on automation software with a focus on robotic process automation and AI, serving selected sectors and regions.
Which has the best competitive advantage?
Nutanix exhibits a very favorable moat with growing ROIC above WACC, indicating durable competitive advantage and value creation. UiPath shows a slightly unfavorable moat, shedding value despite improving profitability.
Stock Comparison
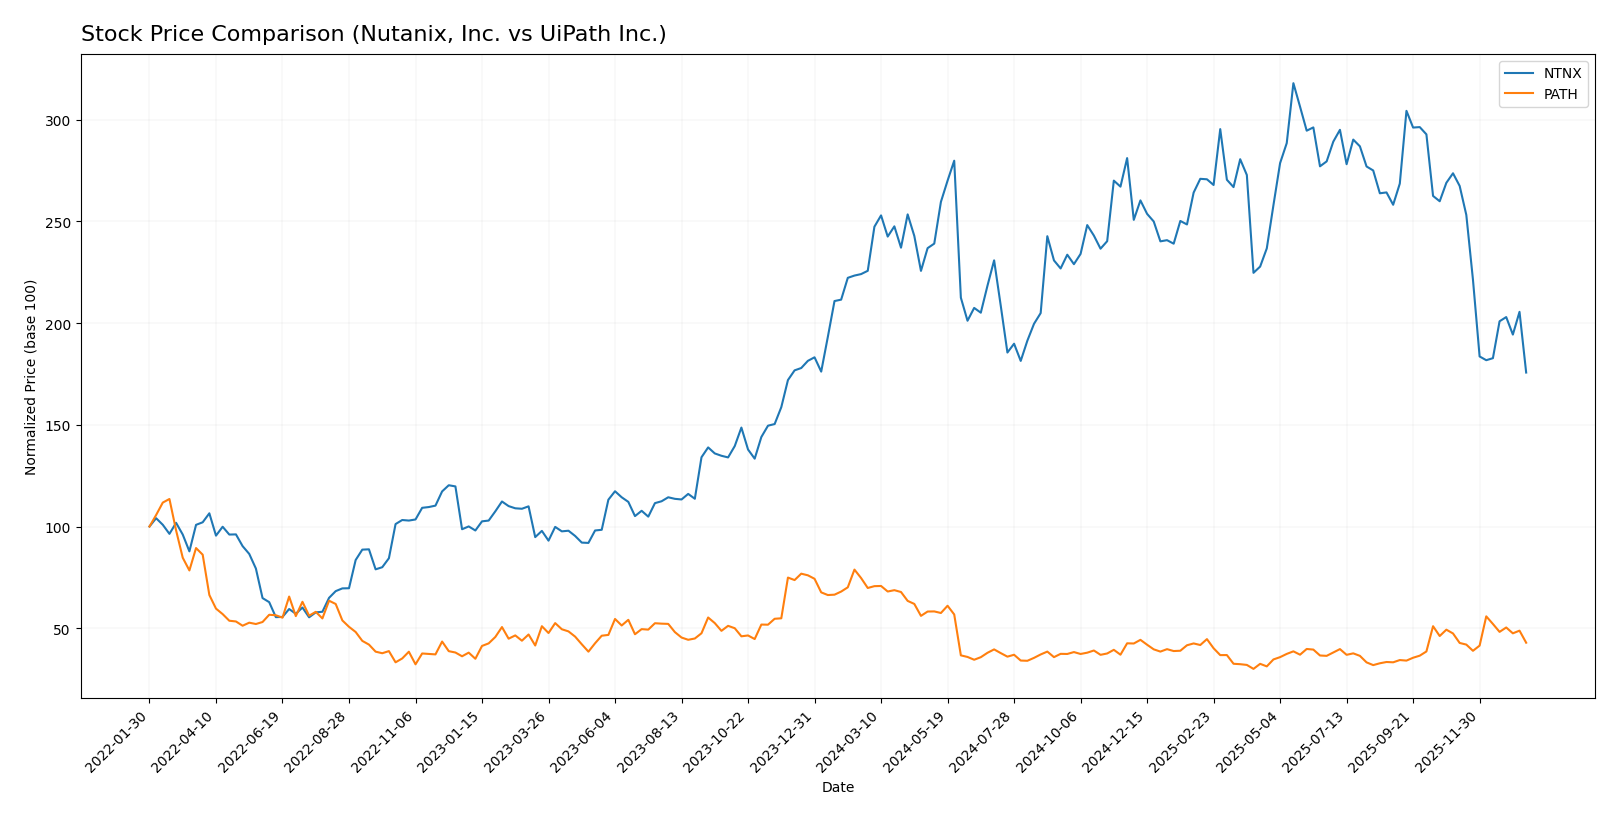
The stock prices of Nutanix, Inc. and UiPath Inc. have exhibited notable declines over the past 12 months, with distinct trading volume patterns and trend dynamics shaping their performance.
Trend Analysis
Nutanix, Inc. (NTNX) shows a bearish trend with a 22.16% price decrease over the past year, accompanied by deceleration in the downtrend and a high volatility level of 8.67. The stock’s highest and lowest prices were 82.77 and 45.74, respectively.
UiPath Inc. (PATH) also experienced a bearish trend with a 38.53% decline over the same period, but its downtrend accelerated. Volatility is lower at 3.33, with prices ranging from 23.66 to 10.04.
Comparing both, Nutanix delivered a less severe market decline than UiPath, indicating a relatively better performance despite both stocks trending downward.
Target Prices
The consensus target prices for Nutanix, Inc. and UiPath Inc. reflect moderate upside potential based on current valuations.
| Company | Target High | Target Low | Consensus |
|---|---|---|---|
| Nutanix, Inc. | 90 | 53 | 64.67 |
| UiPath Inc. | 19 | 14 | 16.6 |
Analysts expect Nutanix’s stock to rise from its current price of 45.74 USD toward a consensus near 64.67 USD, indicating upside potential. UiPath’s consensus target at 16.6 USD suggests a modest increase from its current 14.34 USD.
Analyst Opinions Comparison
This section compares analysts’ ratings and grades for Nutanix, Inc. and UiPath Inc.:
Rating Comparison
NTNX Rating
- Rating: C+, evaluated as Very Favorable
- Discounted Cash Flow Score: 4, deemed Favorable
- ROE Score: 1, marked Very Unfavorable
- ROA Score: 4, rated Favorable
- Debt To Equity Score: 1, marked Very Unfavorable
- Overall Score: 2, considered Moderate
PATH Rating
- Rating: B+, evaluated as Very Favorable
- Discounted Cash Flow Score: 3, considered Moderate
- ROE Score: 4, rated Favorable
- ROA Score: 4, rated Favorable
- Debt To Equity Score: 4, rated Favorable
- Overall Score: 3, considered Moderate
Which one is the best rated?
UiPath Inc. holds a better overall rating and superior scores in ROE, debt to equity, and discounted cash flow compared to Nutanix, Inc., indicating a relatively stronger analyst assessment based on the provided data.
Scores Comparison
The comparison of Nutanix and UiPath scores illustrates their financial stability and strength as measured by Altman Z-Score and Piotroski Score:
Nutanix Scores
- Altman Z-Score: 1.48, indicating financial distress with high bankruptcy risk.
- Piotroski Score: 6, reflecting average financial strength.
UiPath Scores
- Altman Z-Score: 5.27, indicating a safe zone and low bankruptcy risk.
- Piotroski Score: 7, reflecting strong financial health and value.
Which company has the best scores?
Based on the provided data, UiPath has a significantly higher Altman Z-Score in the safe zone and a stronger Piotroski Score than Nutanix, which is in financial distress with an average Piotroski rating.
Grades Comparison
The following presents a detailed comparison of recent grades assigned to Nutanix, Inc. and UiPath Inc.:
Nutanix, Inc. Grades
This table summarizes the latest grades from reputable financial institutions for Nutanix, Inc.:
| Grading Company | Action | New Grade | Date |
|---|---|---|---|
| Barclays | Downgrade | Equal Weight | 2026-01-15 |
| Morgan Stanley | Downgrade | Equal Weight | 2026-01-12 |
| RBC Capital | Maintain | Outperform | 2026-01-05 |
| Goldman Sachs | Maintain | Buy | 2025-11-28 |
| JP Morgan | Maintain | Overweight | 2025-11-26 |
| Needham | Maintain | Buy | 2025-11-26 |
| Wells Fargo | Maintain | Equal Weight | 2025-11-26 |
| Morgan Stanley | Maintain | Overweight | 2025-11-26 |
| Keybanc | Maintain | Overweight | 2025-11-26 |
| Piper Sandler | Maintain | Overweight | 2025-11-26 |
Overall, Nutanix’s grades show a mix of holds and buys, with recent downgrades to equal weight by Barclays and Morgan Stanley, indicating some cautious sentiment.
UiPath Inc. Grades
This table presents recent grades from recognized grading companies for UiPath Inc.:
| Grading Company | Action | New Grade | Date |
|---|---|---|---|
| Barclays | Maintain | Equal Weight | 2026-01-12 |
| RBC Capital | Maintain | Sector Perform | 2026-01-05 |
| RBC Capital | Maintain | Sector Perform | 2025-12-10 |
| Morgan Stanley | Maintain | Equal Weight | 2025-12-09 |
| DA Davidson | Maintain | Neutral | 2025-12-05 |
| Canaccord Genuity | Maintain | Buy | 2025-12-04 |
| Mizuho | Maintain | Neutral | 2025-12-04 |
| RBC Capital | Maintain | Sector Perform | 2025-12-04 |
| Wells Fargo | Maintain | Equal Weight | 2025-12-04 |
| Evercore ISI Group | Maintain | In Line | 2025-12-04 |
UiPath’s grades predominantly reflect a hold or neutral stance, with a limited number of buy ratings and consistent maintenance of existing ratings.
Which company has the best grades?
Nutanix, Inc. has received a stronger overall grade consensus, with 21 buy ratings and no sell ratings compared to UiPath’s 5 buys and 2 sells. This suggests that Nutanix is currently viewed more favorably by analysts, potentially indicating better growth or performance prospects, which could influence investor confidence accordingly.
Strengths and Weaknesses
Below is a comparative overview of key strengths and weaknesses for Nutanix, Inc. (NTNX) and UiPath Inc. (PATH) based on the most recent financial and market data:
| Criterion | Nutanix, Inc. (NTNX) | UiPath Inc. (PATH) |
|---|---|---|
| Diversification | Strong subscription & professional services mix; steady product revenue growth | Balanced revenue from license, subscription, and services but more dependent on licenses |
| Profitability | Positive net margin (7.42%), ROIC (8.11%) above WACC; slight concerns on ROE (-27.12%) | Negative net margin (-5.15%), ROIC (-7.41%) below WACC; improving profitability trend |
| Innovation | Demonstrates durable competitive advantage with growing ROIC | Growing ROIC indicates improving innovation impact, but currently shedding value |
| Global presence | Established global footprint with expanding subscription base | Growing global reach, strong subscription services growth |
| Market Share | Solid market presence in cloud infrastructure and enterprise software | Rapid growth in automation software but faces intense competition |
Key takeaways: Nutanix shows a durable competitive advantage with value creation and balanced revenue streams, despite some profitability ratio concerns. UiPath is improving profitability but still shedding value, with a need to strengthen margins and market position. Both companies have growth potential but differ in risk profiles.
Risk Analysis
Below is a summary table highlighting key risks for Nutanix, Inc. (NTNX) and UiPath Inc. (PATH) based on the most recent 2025 data:
| Metric | Nutanix, Inc. (NTNX) | UiPath Inc. (PATH) |
|---|---|---|
| Market Risk | Moderate beta (0.49), stable sector | Higher beta (1.08), volatile market |
| Debt level | Moderate debt-to-assets (45.16%) | Very low debt-to-assets (2.72%) |
| Regulatory Risk | Moderate, US tech regulations | Moderate, US and international scope |
| Operational Risk | Large employee base, complex platform | Smaller team, rapid growth challenges |
| Environmental Risk | Moderate, global footprint | Moderate, presence in multiple regions |
| Geopolitical Risk | Exposure in multiple regions | Exposure focused in US, Romania, Japan |
Nutanix faces moderate market and debt risks, with a beta indicating lower stock volatility but a debt ratio that requires monitoring. Its Altman Z-Score places it in the distress zone, signaling financial caution. UiPath, with a higher beta, shows more market volatility but benefits from strong financial health and low debt, reflected in a safe zone Altman Z-Score. The most impactful risks are Nutanix’s financial distress signals and UiPath’s market volatility given their sector exposure and operational scale.
Which Stock to Choose?
Nutanix, Inc. shows a favorable income evolution with 18.11% revenue growth in 2025 and strong profitability metrics, including a 7.42% net margin. Its financial ratios are slightly favorable overall, supported by a very favorable MOAT status indicating value creation and growing ROIC, despite some unfavorable equity returns and valuation ratios. The company carries moderate debt and holds a very favorable rating of C+.
UiPath Inc. presents a positive income trend with 9.3% revenue growth and a mixed profitability profile, marked by an unfavorable net margin of -5.15%. Financial ratios appear slightly unfavorable overall, with a slightly unfavorable MOAT status reflecting value destruction but improving profitability. The company maintains low debt levels and holds a very favorable B+ rating.
For investors prioritizing durable competitive advantage and value creation, Nutanix might appear more favorable given its strong income growth and very favorable MOAT. Conversely, those focusing on financial stability and moderate valuation metrics might see UiPath as a potential, considering its very favorable rating and safer financial distress profile. Ultimately, the choice could depend on the investor’s risk tolerance and emphasis on growth versus stability.
Disclaimer: Investment carries a risk of loss of initial capital. The past performance is not a reliable indicator of future results. Be sure to understand risks before making an investment decision.
Go Further
I encourage you to read the complete analyses of Nutanix, Inc. and UiPath Inc. to enhance your investment decisions: