In the evolving landscape of enterprise software infrastructure, Nutanix, Inc. and Teradata Corporation stand out as key players. Both companies offer innovative cloud and data platform solutions, addressing overlapping markets such as hybrid cloud management and enterprise analytics. Their strategies in multi-cloud integration and automation reflect their commitment to innovation. This article will help you determine which company presents the most compelling investment opportunity in 2026.
Table of contents
Companies Overview
I will begin the comparison between Nutanix and Teradata by providing an overview of these two companies and their main differences.
Nutanix Overview
Nutanix, Inc. is a technology company specializing in enterprise cloud platforms across multiple continents including North America, Europe, and Asia Pacific. Founded in 2009 and headquartered in San Jose, California, Nutanix offers a range of virtualization, storage, and cloud management products designed to simplify hybrid cloud operations. The company serves diverse industries such as automotive, healthcare, retail, and telecommunications.
Teradata Overview
Teradata Corporation provides a connected multi-cloud data platform aimed at enterprise analytics. Established in 1979 and based in San Diego, California, Teradata offers its flagship Vantage platform along with consulting and support services to help organizations optimize data use and cloud migration. Its clientele spans sectors including financial services, government, manufacturing, and telecommunications across global markets.
Key similarities and differences
Both Nutanix and Teradata operate in the software infrastructure sector, focusing on cloud and data solutions for enterprises with a global presence. Nutanix emphasizes hybrid cloud orchestration and virtualization, while Teradata centers on multi-cloud data analytics and consulting. Each company serves multiple industries, but Nutanix offers more diverse cloud-native products, whereas Teradata’s strength lies in integrated data platforms and ecosystem simplification.
Income Statement Comparison
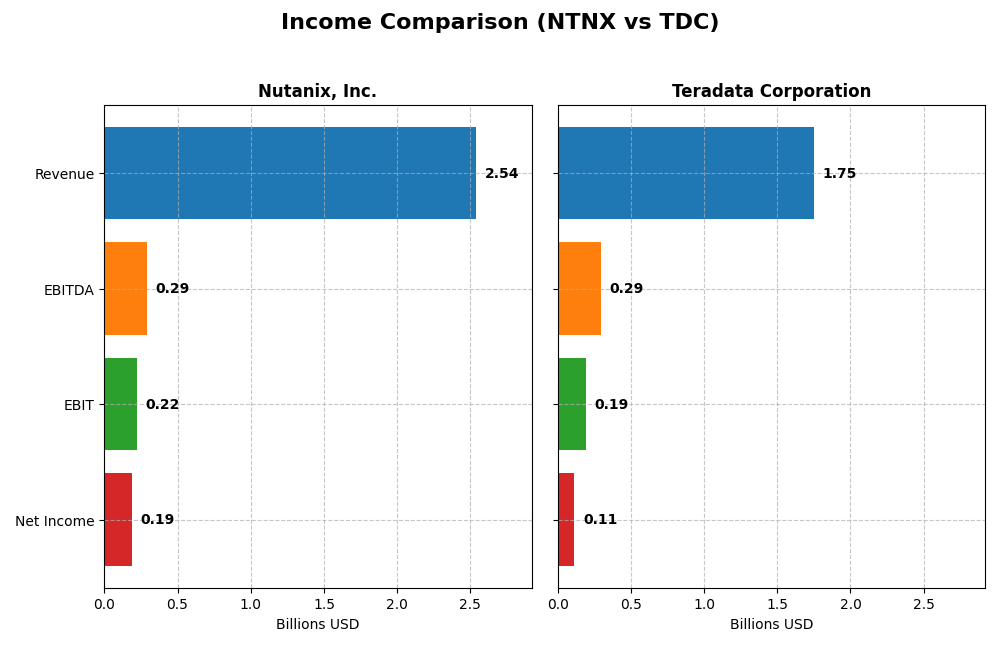
The table below compares key income statement metrics for Nutanix, Inc. and Teradata Corporation for their most recent fiscal years, highlighting revenue, profitability, and earnings per share.
| Metric | Nutanix, Inc. (NTNX) | Teradata Corporation (TDC) |
|---|---|---|
| Market Cap | 12.4B | 2.8B |
| Revenue | 2.54B | 1.75B |
| EBITDA | 293M | 293M |
| EBIT | 220M | 193M |
| Net Income | 188M | 114M |
| EPS | 0.70 | 1.18 |
| Fiscal Year | 2025 | 2024 |
Income Statement Interpretations
Nutanix, Inc.
Nutanix experienced strong revenue growth from 2021 to 2025, increasing from $1.39B to $2.54B, with net income turning positive at $188M in 2025 after previous losses. Gross margin remained high at 86.8%, while EBIT margin was stable around 8.7%. The latest year showed significant improvement in profitability and earnings per share, indicating a favorable turnaround.
Teradata Corporation
Teradata’s revenue declined slightly over 2020-2024, falling from $1.84B to $1.75B, with net income fluctuating but recovering to $114M in 2024. Gross margin averaged around 60.5%, and EBIT margin improved to 11%. Despite a recent revenue dip, operating efficiency and net margin growth were positive, reflecting moderate but stable profitability gains.
Which one has the stronger fundamentals?
Nutanix demonstrates stronger fundamentals with consistent revenue and net income growth, exceptionally high gross margins, and marked profitability improvements in 2025. Teradata, while profitable, shows declining revenue and net income over the period. Nutanix’s superior margin expansion and positive earnings growth suggest more favorable income statement dynamics.
Financial Ratios Comparison
The table below presents key financial ratios for Nutanix, Inc. (NTNX) and Teradata Corporation (TDC) based on their most recent fiscal year data, allowing for a straightforward comparison.
| Ratios | Nutanix, Inc. (2025) | Teradata Corporation (2024) |
|---|---|---|
| ROE | -27.1% | 85.7% |
| ROIC | 8.1% | 16.9% |
| P/E | 106.7 | 26.3 |
| P/B | -29.0 | 22.6 |
| Current Ratio | 1.72 | 0.81 |
| Quick Ratio | 1.72 | 0.79 |
| D/E (Debt-to-Equity) | -2.14 | 4.33 |
| Debt-to-Assets | 45.2% | 33.8% |
| Interest Coverage | 8.75 | 7.21 |
| Asset Turnover | 0.77 | 1.03 |
| Fixed Asset Turnover | 9.15 | 9.07 |
| Payout Ratio | 0 | 0 |
| Dividend Yield | 0 | 0 |
Interpretation of the Ratios
Nutanix, Inc.
Nutanix exhibits a balanced ratio profile with half of its key ratios rated favorable, including a strong current and quick ratio of 1.72 each, and a solid interest coverage of 11.15. However, concerns arise from a negative return on equity at -27.12% and an elevated price-to-earnings ratio of 106.74. Nutanix does not pay dividends, likely reflecting a reinvestment strategy or growth focus.
Teradata Corporation
Teradata shows favorable returns on equity (85.71%) and invested capital (16.89%), alongside efficient asset turnover metrics. Yet, it faces weaknesses such as a low current ratio of 0.81 and a high debt-to-equity ratio of 4.33. Like Nutanix, Teradata pays no dividends, possibly prioritizing reinvestment or acquisitions over shareholder distributions.
Which one has the best ratios?
Nutanix’s ratios are slightly more favorable overall, with stronger liquidity and coverage ratios, despite its negative equity returns. Teradata presents stronger profitability but is hindered by weaker liquidity and higher leverage. The choice depends on investor preference for liquidity versus profitability metrics, as both companies have notable strengths and weaknesses.
Strategic Positioning
This section compares the strategic positioning of Nutanix and Teradata, including Market position, Key segments, and exposure to disruption:
Nutanix, Inc.
- Larger market cap ($12.4B) with moderate competitive pressure in software infrastructure.
- Focused on enterprise cloud platform, virtualization, hybrid cloud orchestration, and automation services.
- Exposure to cloud-native technologies and Kubernetes automation reflects adaptation to technological disruption.
Teradata Corporation
- Smaller market cap ($2.8B) but strong presence in enterprise analytics software.
- Concentrated on connected multi-cloud data platform and consulting services for analytics.
- Focus on multi-cloud ecosystem and integrated migration shows responsiveness to cloud data trends.
Nutanix vs Teradata Positioning
Nutanix pursues a diversified product mix with cloud, virtualization, and automation tools across multiple industries. Teradata concentrates on enterprise analytics and consulting services, emphasizing multi-cloud data platforms. Nutanix’s broader portfolio contrasts with Teradata’s focused data ecosystem approach.
Which has the best competitive advantage?
Both companies demonstrate a very favorable moat with growing ROIC above WACC, indicating durable competitive advantages and increasing profitability based on their efficient use of invested capital.
Stock Comparison
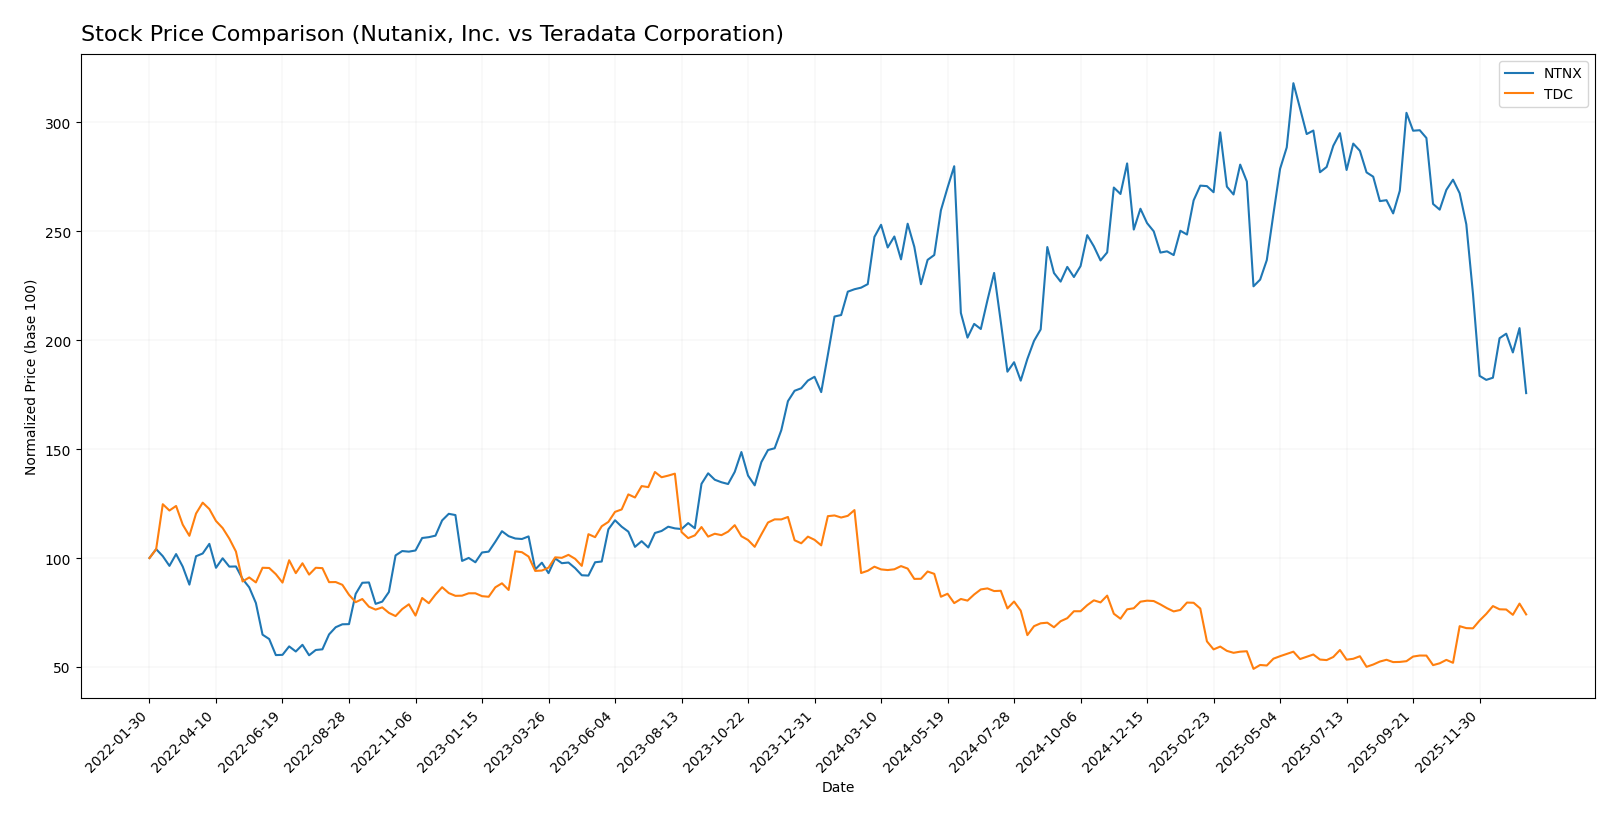
The stock prices of Nutanix, Inc. and Teradata Corporation have exhibited significant volatility and contrasting short-term momentum over the past 12 months, reflecting divergent trading dynamics and investor sentiment.
Trend Analysis
Nutanix, Inc. (NTNX) experienced a bearish trend over the past year with a -22.16% price decline and decelerating downward momentum, fluctuating between a high of 82.77 and a low of 45.74, with elevated volatility (8.67 std deviation).
Teradata Corporation (TDC) also followed a bearish trend annually with a -21.26% price drop but showed accelerating trend dynamics and lower volatility (5.63 std deviation); notably, it posted a strong recent rebound of +42.78%.
Comparing both stocks, Teradata’s recent positive momentum contrasts with Nutanix’s continued decline, resulting in Teradata delivering the highest market performance in the latest period analyzed.
Target Prices
Analysts present a clear consensus on target prices for Nutanix, Inc. and Teradata Corporation, indicating moderate upside potential.
| Company | Target High | Target Low | Consensus |
|---|---|---|---|
| Nutanix, Inc. | 90 | 53 | 64.67 |
| Teradata Corporation | 35 | 27 | 31 |
For Nutanix, the consensus target price of 64.67 USD suggests a significant premium over the current price of 45.74 USD, reflecting optimistic analyst outlooks. Teradata’s consensus target at 31 USD is slightly above its current price of 29.77 USD, indicating modest expected appreciation.
Analyst Opinions Comparison
This section compares analysts’ ratings and grades for Nutanix, Inc. and Teradata Corporation:
Rating Comparison
NTNX Rating
- Rating: C+; classified as Very Favorable by analysts.
- Discounted Cash Flow Score: 4, indicating a Favorable outlook on cash flow.
- ROE Score: 1, assessed as Very Unfavorable, showing low efficiency in equity use.
- ROA Score: 4, Favorable, showing good asset utilization.
- Debt To Equity Score: 1, Very Unfavorable, indicating high financial risk.
- Overall Score: 2, Moderate assessment overall.
TDC Rating
- Rating: B+; also classified as Very Favorable by analysts.
- Discounted Cash Flow Score: 4, similarly Favorable for future cash flows.
- ROE Score: 5, Very Favorable, indicating strong profit generation from equity.
- ROA Score: 4, Favorable, similarly efficient asset use.
- Debt To Equity Score: 1, also Very Unfavorable, reflecting similar risk level.
- Overall Score: 3, Moderate but higher than NTNX’s score.
Which one is the best rated?
Teradata Corporation holds a higher overall score (3 versus 2) and significantly outperforms Nutanix in Return on Equity, indicating better profitability efficiency. Both share similar discounted cash flow and debt-to-equity concerns.
Scores Comparison
Here is a comparison of the financial scores for Nutanix, Inc. and Teradata Corporation:
Nutanix Scores
- Altman Z-Score: 1.48, in distress zone, high risk of bankruptcy
- Piotroski Score: 6, average financial strength
Teradata Scores
- Altman Z-Score: 0.81, in distress zone, higher risk of bankruptcy
- Piotroski Score: 8, very strong financial strength
Which company has the best scores?
Teradata has a lower Altman Z-Score, indicating higher bankruptcy risk, but a stronger Piotroski Score, suggesting better financial strength compared to Nutanix. The scores show mixed signals for each company.
Grades Comparison
Here is a comparison of the recent grades assigned to Nutanix, Inc. and Teradata Corporation by reputable grading companies:
Nutanix, Inc. Grades
This table lists the latest grades and rating actions from major financial institutions for Nutanix, Inc.
| Grading Company | Action | New Grade | Date |
|---|---|---|---|
| Barclays | Downgrade | Equal Weight | 2026-01-15 |
| Morgan Stanley | Downgrade | Equal Weight | 2026-01-12 |
| RBC Capital | Maintain | Outperform | 2026-01-05 |
| Goldman Sachs | Maintain | Buy | 2025-11-28 |
| JP Morgan | Maintain | Overweight | 2025-11-26 |
| Needham | Maintain | Buy | 2025-11-26 |
| Wells Fargo | Maintain | Equal Weight | 2025-11-26 |
| Morgan Stanley | Maintain | Overweight | 2025-11-26 |
| Keybanc | Maintain | Overweight | 2025-11-26 |
| Piper Sandler | Maintain | Overweight | 2025-11-26 |
Nutanix’s recent grades show a slight downgrade trend from Overweight to Equal Weight by Barclays and Morgan Stanley, while other firms maintain positive ratings such as Buy and Outperform.
Teradata Corporation Grades
Below are the recent grades and rating actions from credible financial firms for Teradata Corporation.
| Grading Company | Action | New Grade | Date |
|---|---|---|---|
| Barclays | Maintain | Underweight | 2026-01-12 |
| RBC Capital | Maintain | Sector Perform | 2026-01-05 |
| Morgan Stanley | Maintain | Overweight | 2025-12-17 |
| Citizens | Upgrade | Market Outperform | 2025-11-10 |
| Barclays | Maintain | Underweight | 2025-11-05 |
| TD Cowen | Maintain | Hold | 2025-11-05 |
| Evercore ISI Group | Maintain | Outperform | 2025-11-05 |
| UBS | Maintain | Neutral | 2025-08-06 |
| Guggenheim | Maintain | Buy | 2025-05-07 |
| Barclays | Maintain | Underweight | 2025-04-21 |
Teradata’s grades generally indicate a more cautious outlook, with multiple Underweight ratings from Barclays and several Hold or Neutral assessments, though some firms rate it as Buy or Outperform.
Which company has the best grades?
Nutanix, Inc. holds a stronger overall consensus with 21 Buy ratings and no Sell ratings, whereas Teradata Corporation has a consensus of Hold with a higher number of Hold and Sell ratings. This suggests Nutanix is currently viewed more favorably by analysts, potentially implying better growth expectations or stability for investors compared to Teradata.
Strengths and Weaknesses
Below is a comparative overview of Nutanix, Inc. (NTNX) and Teradata Corporation (TDC) based on key business and financial criteria as of 2026:
| Criterion | Nutanix, Inc. (NTNX) | Teradata Corporation (TDC) |
|---|---|---|
| Diversification | Moderate: Focused on subscription services with growing professional services | High: Broad product and service recurring revenues including consulting and software licenses |
| Profitability | Moderate net margin (7.4%), negative ROE (-27.1%), neutral ROIC (8.1%) | Moderate net margin (6.5%), strong ROE (85.7%), favorable ROIC (16.9%) |
| Innovation | Strong innovation indicated by high fixed asset turnover (9.15) and growing ROIC | Strong innovation with consistent asset turnover (9.07) and growing ROIC |
| Global presence | Growing presence with increasing subscription revenues globally | Established global presence with diversified international revenues |
| Market Share | Growing market share in cloud infrastructure software | Stable market share in data analytics and enterprise software |
Key takeaways: Both companies demonstrate durable competitive advantages with growing ROIC trends. Teradata shows stronger profitability metrics and broader diversification, while Nutanix emphasizes innovative subscription-based growth but faces challenges in profitability. Investors should weigh Nutanix’s growth potential against Teradata’s established financial strength and global reach.
Risk Analysis
Below is a comparative table outlining key risks for Nutanix, Inc. (NTNX) and Teradata Corporation (TDC) based on the most recent data from 2025 and 2024 respectively:
| Metric | Nutanix, Inc. (NTNX) | Teradata Corporation (TDC) |
|---|---|---|
| Market Risk | Moderate (Beta 0.49) | Moderate (Beta 0.57) |
| Debt Level | Moderate (Debt-to-Assets 45.16%) | Moderate (Debt-to-Assets 33.8%) |
| Regulatory Risk | Moderate (Tech sector exposure) | Moderate (Tech sector exposure) |
| Operational Risk | Moderate (Complex cloud solutions) | Moderate (Multi-cloud platform) |
| Environmental Risk | Low (Software-focused) | Low (Software-focused) |
| Geopolitical Risk | Moderate (Global operations) | Moderate (Global operations) |
In synthesis, both companies face moderate market and operational risks due to their technology infrastructure roles and global presence. Nutanix’s higher debt-to-assets ratio and lower ROE highlight financial vulnerability, while Teradata shows stronger profitability but also carries moderate leverage. Both are exposed to tech sector regulatory shifts and global geopolitical uncertainties. Nutanix’s Altman Z-Score in the distress zone signals higher bankruptcy risk compared to Teradata, whose Piotroski Score indicates stronger financial health. Caution is advised, especially with Nutanix’s valuation and profitability challenges.
Which Stock to Choose?
Nutanix, Inc. (NTNX) shows a strong income evolution with 18.11% revenue growth in 2025 and a favorable 92.86% positive income statement evaluation. Its financial ratios are slightly favorable overall, with a solid current ratio of 1.72 and good interest coverage, despite an unfavorable ROE and high P/E. The company carries moderate debt, and its rating is very favorable with a C+ score, supported by a very favorable moat indicating durable competitive advantage.
Teradata Corporation (TDC) experienced a slight revenue decline of -4.53% in 2024 but maintains favorable income margins and a 57.14% favorable income statement evaluation. Its financial ratios are neutral overall, with strong ROE and ROIC, though weaker liquidity ratios and higher debt-to-equity. The rating is very favorable at B+, reflecting strong profitability and a very favorable moat with notable value creation and growing returns.
Considering their ratings and financial evaluations, NTNX might appeal to investors prioritizing strong income growth and competitive moat durability, despite some valuation challenges. Conversely, TDC could be more attractive for those seeking stable profitability and robust returns on equity with a slightly more moderate risk profile. Each stock’s suitability could thus vary depending on an investor’s risk tolerance and investment strategy.
Disclaimer: Investment carries a risk of loss of initial capital. The past performance is not a reliable indicator of future results. Be sure to understand risks before making an investment decision.
Go Further
I encourage you to read the complete analyses of Nutanix, Inc. and Teradata Corporation to enhance your investment decisions: