In the fast-evolving technology sector, Nutanix, Inc. (NTNX) and StoneCo Ltd. (STNE) stand out as innovative players in software infrastructure. Nutanix focuses on enterprise cloud platforms globally, while StoneCo drives fintech solutions primarily in Brazil’s electronic commerce market. Despite their different niches, both companies share a commitment to cutting-edge technology and growth. This analysis will help you decide which stock could be the smarter addition to your investment portfolio.
Table of contents
Companies Overview
I will begin the comparison between Nutanix and StoneCo by providing an overview of these two companies and their main differences.
Nutanix Overview
Nutanix, Inc. provides an enterprise cloud platform serving multiple regions including North America, Europe, and Asia Pacific. It specializes in software infrastructure products such as virtualization, storage, and cloud-native environment management solutions. Founded in 2009 and based in San Jose, California, Nutanix targets diverse industries like healthcare, financial services, and telecommunications with a portfolio that includes automation, hybrid cloud orchestration, and database services.
StoneCo Overview
StoneCo Ltd. offers financial technology solutions primarily to merchants and integrated partners in Brazil. Its products enable electronic commerce across in-store, online, and mobile channels, distributed mainly through proprietary Stone Hubs and a dedicated sales force. Founded in 2000 and headquartered in George Town, Cayman Islands, StoneCo serves about 1.77M clients, focusing on small-and-medium-sized businesses and digital platforms within the financial technology sector.
Key similarities and differences
Both Nutanix and StoneCo operate within the technology sector and are listed on the NASDAQ Global Select exchange. They serve business clients with software infrastructure solutions but differ in focus: Nutanix provides enterprise cloud and virtualization products globally, while StoneCo concentrates on fintech solutions for commerce in Brazil. Their client bases and geographic markets vary significantly, reflecting distinct business models within software infrastructure.
Income Statement Comparison
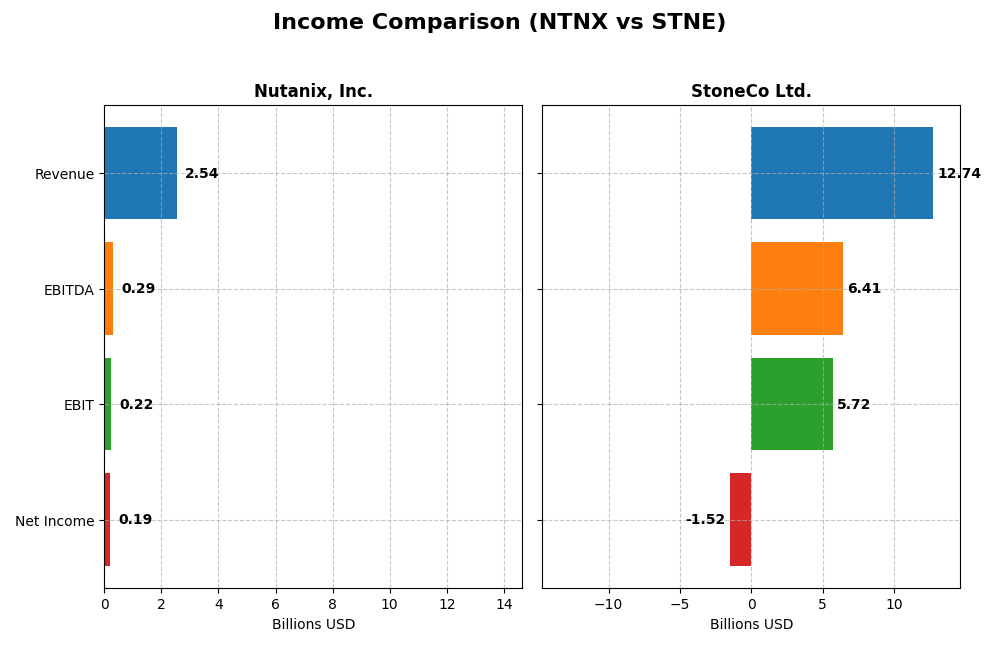
This table presents a factual comparison of the most recent fiscal year income statement metrics for Nutanix, Inc. and StoneCo Ltd., highlighting key financial indicators in their respective currencies.
| Metric | Nutanix, Inc. (NTNX) | StoneCo Ltd. (STNE) |
|---|---|---|
| Market Cap | 12.4B USD | 3.9B USD |
| Revenue | 2.54B USD | 12.7B BRL |
| EBITDA | 293M USD | 6.41B BRL |
| EBIT | 220M USD | 5.72B BRL |
| Net Income | 188M USD | -1.52B BRL |
| EPS | 0.70 USD | -5.02 BRL |
| Fiscal Year | 2025 | 2024 |
Income Statement Interpretations
Nutanix, Inc.
Nutanix demonstrated consistent revenue growth from 2021 to 2025, reaching $2.54B in 2025 with an 82% increase overall. Net income improved significantly, turning positive in 2025 at $188M after several years of losses. Gross margin remained strong at 86.8%, while net margin improved to 7.4%. The latest year showed favorable growth and margin expansion, reflecting improved profitability.
StoneCo Ltd.
StoneCo’s revenue surged by over 300% from 2020 to 2024, reaching BRL 12.7B in 2024. However, net income declined sharply, posting a net loss of BRL 1.52B in 2024 and a negative net margin of -11.9%. Gross margin stayed favorable at 73.4%, and EBIT margin was robust at 44.9%. Despite revenue growth, net margin and EPS deteriorated, signaling profitability challenges in the latest year.
Which one has the stronger fundamentals?
Nutanix exhibits stronger fundamentals with favorable trends across revenue, net income, and margin improvements, including positive net margins and EPS growth. StoneCo, while growing revenue impressively, struggles with consistent net losses and deteriorating profitability metrics. Nutanix’s income statement presents a more balanced growth and margin profile, whereas StoneCo faces significant earnings challenges despite scale.
Financial Ratios Comparison
The table below presents the key financial ratios for Nutanix, Inc. (NTNX) and StoneCo Ltd. (STNE) based on their most recent fiscal year data, providing a snapshot for comparative analysis.
| Ratios | Nutanix, Inc. (2025) | StoneCo Ltd. (2024) |
|---|---|---|
| ROE | -27.1% | -12.9% |
| ROIC | 8.1% | 22.4% |
| P/E | 106.7 | -9.8 |
| P/B | -29.0 | 1.27 |
| Current Ratio | 1.72 | 1.37 |
| Quick Ratio | 1.72 | 1.37 |
| D/E (Debt to Equity) | -2.14 | 1.10 |
| Debt-to-Assets | 45.2% | 23.5% |
| Interest Coverage | 8.75 | 5.57 |
| Asset Turnover | 0.77 | 0.23 |
| Fixed Asset Turnover | 9.15 | 6.95 |
| Payout Ratio | 0 | 0 |
| Dividend Yield | 0 | 0 |
Interpretation of the Ratios
Nutanix, Inc.
Nutanix’s ratios show a mix of strengths and weaknesses, with a favorable WACC and current ratio but unfavorable ROE and high PE ratio. The company’s negative dividend yield indicates it does not pay dividends, likely due to reinvestment for growth or other strategic priorities. Shareholder returns currently depend on potential capital gains rather than income distribution.
StoneCo Ltd.
StoneCo presents favorable ROIC, PB, and interest coverage ratios, but net margin and ROE are negative, reflecting profitability challenges. The company also does not pay dividends, suggesting a focus on reinvestment or growth strategies. Its moderate current ratio and some unfavorable leverage metrics indicate cautious monitoring is necessary.
Which one has the best ratios?
Both Nutanix and StoneCo have an equal share of favorable ratios at 50%, but Nutanix displays fewer unfavorable metrics (21.43% vs. 42.86%) and a slightly stronger liquidity position. However, both companies face profitability concerns and do not provide dividend income, requiring investors to weigh their growth prospects against these risks.
Strategic Positioning
This section compares the strategic positioning of Nutanix, Inc. and StoneCo Ltd. in terms of Market position, Key segments, and Exposure to technological disruption:
Nutanix, Inc.
- Market position and competitive pressure
- Key segments and business drivers
- Exposure to technological disruption
StoneCo Ltd.
- Operates globally with a $12.4B market cap in infrastructure software.
- Diverse software products including enterprise cloud, virtualization, and hybrid cloud orchestration.
- Offers advanced cloud, Kubernetes, and hybrid cloud solutions, adapting to cloud-native trends.
Nutanix, Inc. vs StoneCo Ltd. Positioning
Nutanix pursues a diversified global software infrastructure approach, spanning multiple industries and cloud technologies. StoneCo concentrates on regional fintech services for SMBs in Brazil, leveraging local market expertise but with less diversification.
Which has the best competitive advantage?
Both companies show a very favorable moat with growing ROIC and value creation. StoneCo’s higher ROIC above WACC and stronger growth trend suggests a durable competitive advantage, while Nutanix also demonstrates solid value creation and profitability growth.
Stock Comparison
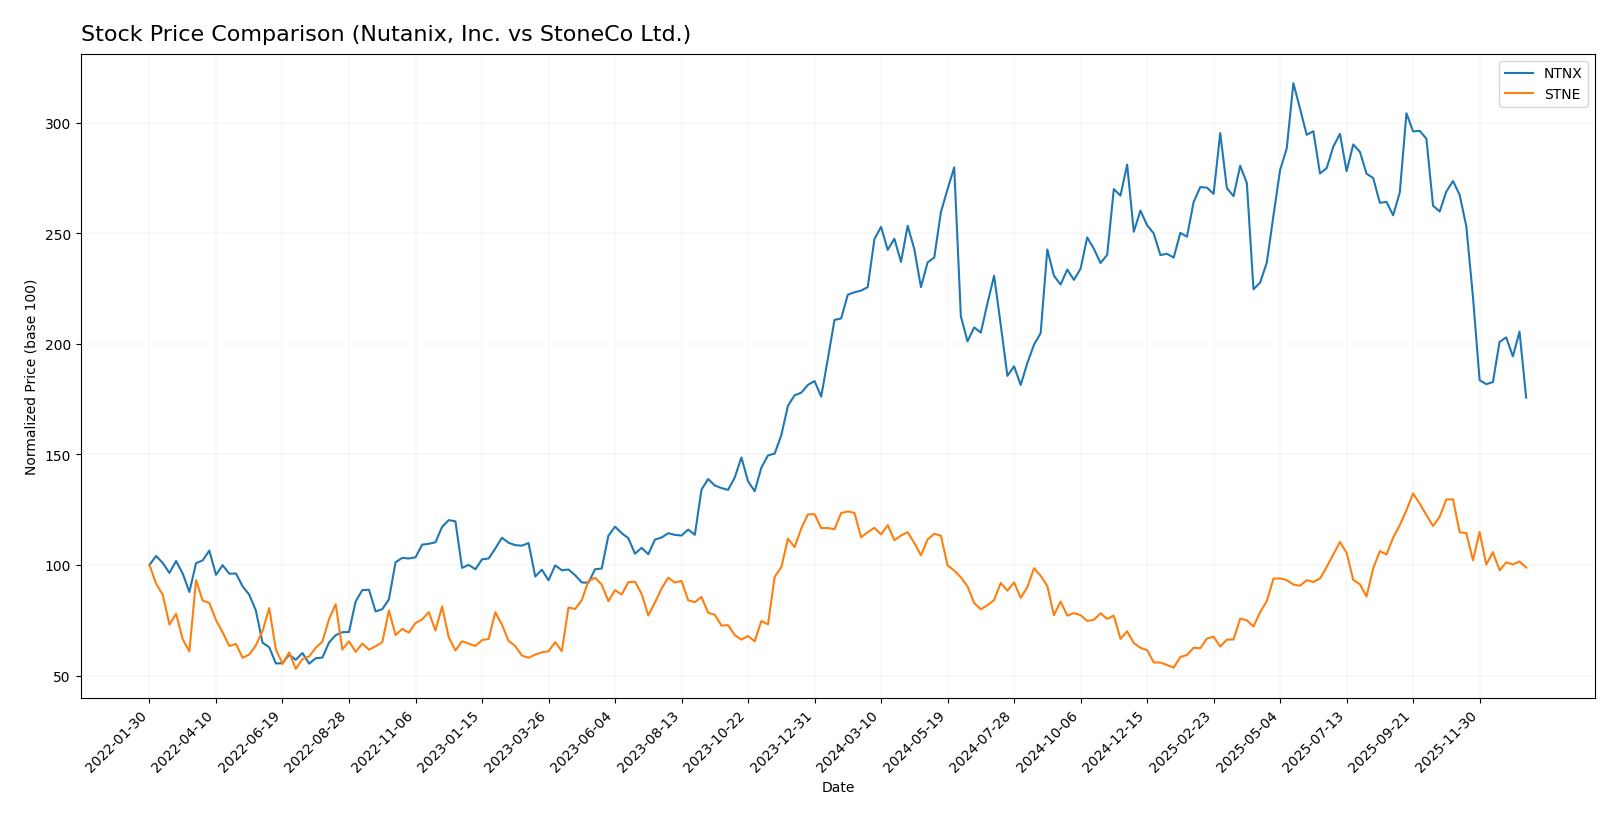
The past year has seen both Nutanix, Inc. and StoneCo Ltd. experience notable declines in their stock prices, with sustained bearish trends and decelerating momentum reflecting persistent selling pressure in their trading dynamics.
Trend Analysis
Nutanix, Inc. (NTNX) exhibited a bearish trend over the past 12 months with a -22.16% price change, decelerating in momentum. The stock showed significant volatility with an 8.67 standard deviation and ranged between $45.74 and $82.77.
StoneCo Ltd. (STNE) also followed a bearish trend over the same period, declining by -13.9%. Its trend decelerated with lower volatility at 2.92 standard deviation and traded between $7.85 and $19.40.
Comparing the two, Nutanix’s stock experienced a larger price drop and greater volatility, whereas StoneCo had a smaller decline and steadier trading. Nutanix delivered the lowest market performance over the past year.
Target Prices
The current analyst consensus provides a clear range of target prices for Nutanix, Inc. and StoneCo Ltd.
| Company | Target High | Target Low | Consensus |
|---|---|---|---|
| Nutanix, Inc. | 90 | 53 | 64.67 |
| StoneCo Ltd. | 20 | 20 | 20 |
Analysts expect Nutanix shares to appreciate significantly from the current price of $45.74, while StoneCo’s target consensus at $20 suggests a moderate upside from its present price of $14.49.
Analyst Opinions Comparison
This section compares analysts’ ratings and grades for Nutanix, Inc. and StoneCo Ltd.:
Rating Comparison
NTNX Rating
- Rating: C+, classified as Very Favorable.
- Discounted Cash Flow Score: 4 (Favorable), indicating stronger cash flow value.
- ROE Score: 1 (Very Unfavorable), showing weak profit generation from equity.
- ROA Score: 4 (Favorable), reflecting effective asset utilization.
- Debt To Equity Score: 1 (Very Unfavorable), suggesting higher financial risk.
- Overall Score: 2 (Moderate), a moderate overall financial standing.
STNE Rating
- Rating: C, classified as Very Favorable.
- Discounted Cash Flow Score: 3 (Moderate), showing moderate cash flow value.
- ROE Score: 1 (Very Unfavorable), also indicating weak profit generation.
- ROA Score: 1 (Very Unfavorable), indicating poor asset utilization.
- Debt To Equity Score: 1 (Very Unfavorable), also indicating higher risk.
- Overall Score: 2 (Moderate), similarly moderate overall financial standing.
Which one is the best rated?
Nutanix holds a slightly stronger position with a higher rating (C+) and better scores in discounted cash flow and asset utilization. StoneCo shares the same overall moderate score but shows weaker asset and cash flow metrics.
Scores Comparison
Here is a comparison of Nutanix and StoneCo scores based on Altman Z-Score and Piotroski Score:
Nutanix Scores
- Altman Z-Score: 1.48, in distress zone indicating high bankruptcy risk.
- Piotroski Score: 6, average financial strength rating.
StoneCo Scores
- Altman Z-Score: 1.02, in distress zone indicating high bankruptcy risk.
- Piotroski Score: 5, average financial strength rating.
Which company has the best scores?
Nutanix has a slightly higher Altman Z-Score and Piotroski Score than StoneCo, indicating marginally better financial stability and strength based on these metrics. Both remain in the distress zone with average Piotroski ratings.
Grades Comparison
Here is a comparison of the recent grades assigned to Nutanix, Inc. and StoneCo Ltd. by reputable grading companies:
Nutanix, Inc. Grades
The table below summarizes recent grades from verified financial institutions for Nutanix, Inc.:
| Grading Company | Action | New Grade | Date |
|---|---|---|---|
| Barclays | Downgrade | Equal Weight | 2026-01-15 |
| Morgan Stanley | Downgrade | Equal Weight | 2026-01-12 |
| RBC Capital | Maintain | Outperform | 2026-01-05 |
| Goldman Sachs | Maintain | Buy | 2025-11-28 |
| JP Morgan | Maintain | Overweight | 2025-11-26 |
| Needham | Maintain | Buy | 2025-11-26 |
| Wells Fargo | Maintain | Equal Weight | 2025-11-26 |
| Morgan Stanley | Maintain | Overweight | 2025-11-26 |
| Keybanc | Maintain | Overweight | 2025-11-26 |
| Piper Sandler | Maintain | Overweight | 2025-11-26 |
The overall trend for Nutanix shows a recent shift from overweight to equal weight by key analysts, while most maintain positive ratings such as buy and outperform.
StoneCo Ltd. Grades
The table below shows recent verified grades for StoneCo Ltd.:
| Grading Company | Action | New Grade | Date |
|---|---|---|---|
| Goldman Sachs | Maintain | Buy | 2025-10-14 |
| B of A Securities | Maintain | Buy | 2025-09-09 |
| UBS | Maintain | Buy | 2025-08-29 |
| JP Morgan | Maintain | Overweight | 2025-07-16 |
| Barclays | Maintain | Equal Weight | 2025-05-12 |
| Barclays | Maintain | Equal Weight | 2025-04-23 |
| Citigroup | Upgrade | Buy | 2025-04-22 |
| Barclays | Maintain | Equal Weight | 2025-03-21 |
| Morgan Stanley | Maintain | Underweight | 2025-03-21 |
| Goldman Sachs | Maintain | Buy | 2025-02-06 |
StoneCo’s grades mostly consist of buy and equal weight ratings, with one underweight rating from Morgan Stanley, indicating mixed but generally positive sentiment.
Which company has the best grades?
Both Nutanix and StoneCo have a consensus rating of “Buy,” but Nutanix features more recent downgrades from overweight to equal weight by major firms, while StoneCo maintains stable buy and equal weight ratings with fewer downgrades. This suggests Nutanix’s outlook is slightly more cautious recently, potentially affecting investor confidence and risk assessment.
Strengths and Weaknesses
Below is a comparison of Nutanix, Inc. (NTNX) and StoneCo Ltd. (STNE) across key business criteria based on the most recent financial and operational data.
| Criterion | Nutanix, Inc. (NTNX) | StoneCo Ltd. (STNE) |
|---|---|---|
| Diversification | Strong subscription-based revenue (2B USD in 2024) with growing professional services segment; moderate product diversification | Focused primarily on payment solutions, less diversified product range |
| Profitability | Moderate net margin (7.42%), slightly favorable ROIC (8.11%); however, negative ROE (-27.12%) and high P/E (106.74) indicate profitability challenges | Negative net margin (-11.89%) and ROE (-12.87%) but high ROIC (22.41%) shows efficient capital use despite losses |
| Innovation | Continuous growth in ROIC (+117%) suggests effective innovation and operational improvements | Very strong ROIC growth (+371%) reflecting rapid innovation and scaling capabilities |
| Global presence | Established presence with a wide global customer base in cloud computing and enterprise IT | Primarily focused on Brazil and Latin America, limiting global reach |
| Market Share | Significant in cloud infrastructure market with growing subscription revenues | Strong presence in Brazilian fintech but relatively smaller global market share |
Key takeaways: Nutanix benefits from a diversified subscription revenue model and steady profitability improvements, though its negative ROE and valuation raise caution. StoneCo shows remarkable ROIC growth and capital efficiency but struggles with profitability and geographic concentration. Both demonstrate durable competitive advantages but require careful risk assessment.
Risk Analysis
Below is a comparison table of key risks for Nutanix, Inc. (NTNX) and StoneCo Ltd. (STNE) based on the most recent data available:
| Metric | Nutanix, Inc. (NTNX) | StoneCo Ltd. (STNE) |
|---|---|---|
| Market Risk | Low beta (0.49), less volatile | High beta (1.835), more volatile |
| Debt level | Moderate debt-to-assets (45.16%), favorable debt/equity ratio (-2.14) | Lower debt-to-assets (23.53%), but unfavorable debt/equity ratio (1.1) |
| Regulatory Risk | Moderate, US-based tech sector | Elevated, operates in Brazil’s fintech sector with evolving regulations |
| Operational Risk | Moderate, technology platform complexity | Moderate to high, fintech service delivery in emerging market |
| Environmental Risk | Low, technology sector with limited direct environmental impact | Low, fintech sector with minimal environmental footprint |
| Geopolitical Risk | Low, US-based operations | Higher, exposure to Brazil and Cayman Islands jurisdictions |
The most likely and impactful risks are StoneCo’s elevated market volatility and regulatory risk in Brazil, which could affect earnings stability. Nutanix faces moderate debt and operational risks but benefits from a stable market environment with lower volatility. Both companies show financial distress signals with Altman Z-scores in the distress zone, urging caution.
Which Stock to Choose?
Nutanix, Inc. (NTNX) shows a favorable income evolution with 18.11% revenue growth in 2025 and strong profitability indicated by a 7.42% net margin. Its financial ratios are slightly favorable overall, supported by a very favorable economic moat with ROIC exceeding WACC, though it carries moderate debt and a C+ rating.
StoneCo Ltd. (STNE) presents a favorable revenue growth of 12.1% in 2024 but suffers from an unfavorable net margin of -11.89%. Its financial ratios are also slightly favorable, with a very favorable moat reflecting value creation, balanced against moderate debt levels and a C rating.
Investors seeking growth and improving profitability might view Nutanix’s strong income trends and durable competitive advantage as attractive, while those valuing a company with solid economic moat metrics but facing margin challenges could interpret StoneCo’s profile as more suitable; risk tolerance and investment strategy remain key factors in this assessment.
Disclaimer: Investment carries a risk of loss of initial capital. The past performance is not a reliable indicator of future results. Be sure to understand risks before making an investment decision.
Go Further
I encourage you to read the complete analyses of Nutanix, Inc. and StoneCo Ltd. to enhance your investment decisions: