In the fast-evolving world of software infrastructure, Rubrik, Inc. and Nutanix, Inc. stand out as key players driving innovation in enterprise cloud and data protection solutions. Both companies serve diverse industries with overlapping markets, leveraging cutting-edge technologies to secure and optimize digital environments. This article will analyze their strengths and strategies to help you decide which company deserves a spot in your investment portfolio. Let’s explore which firm offers the most compelling opportunity for investors today.
Table of contents
Companies Overview
I will begin the comparison between Rubrik, Inc. and Nutanix, Inc. by providing an overview of these two companies and their main differences.
Rubrik, Inc. Overview
Rubrik, Inc. focuses on data security solutions, offering enterprise, unstructured, cloud, and SaaS data protection, alongside data threat analytics and cyber recovery services. The company serves diverse sectors including financial, retail, healthcare, and public sectors. Founded in 2013 and based in Palo Alto, California, Rubrik positions itself as a key player in software infrastructure with a market cap of approximately 13.4B USD.
Nutanix, Inc. Overview
Nutanix, Inc. delivers an enterprise cloud platform featuring virtualization, storage, security, and automation tools like Kubernetes management and hybrid cloud orchestration. Headquartered in San Jose, California, and founded in 2009, it serves various industries globally, including automotive, healthcare, and telecommunications. Nutanix operates with a market cap near 12.4B USD and offers a broad suite of cloud-native and hybrid cloud solutions.
Key similarities and differences
Both companies operate within the software infrastructure sector, targeting enterprise customers with cloud-focused technologies. Rubrik specializes primarily in data security and protection, while Nutanix emphasizes a broader cloud platform with virtualization and automation capabilities. Rubrik has a smaller workforce and a slightly larger market cap compared to Nutanix, which maintains a more extensive product portfolio and global reach.
Income Statement Comparison
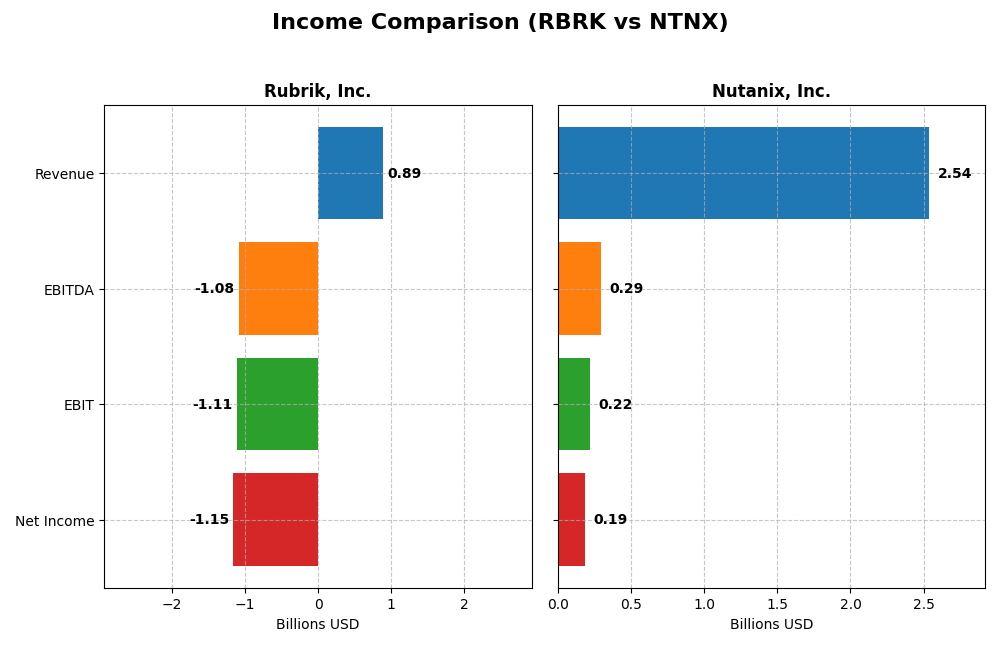
Below is a side-by-side comparison of key income statement metrics for Rubrik, Inc. and Nutanix, Inc. for the fiscal year 2025.
| Metric | Rubrik, Inc. (RBRK) | Nutanix, Inc. (NTNX) |
|---|---|---|
| Market Cap | 13.4B | 12.4B |
| Revenue | 887M | 2.54B |
| EBITDA | -1.08B | 293M |
| EBIT | -1.11B | 220M |
| Net Income | -1.15B | 188M |
| EPS | -7.48 | 0.70 |
| Fiscal Year | 2025 | 2025 |
Income Statement Interpretations
Rubrik, Inc.
Rubrik’s revenue showed strong growth, increasing by 128.64% from 2021 to 2025, reaching $887M in 2025. However, net income declined drastically, with a negative margin of -130.26% in 2025, reflecting heavy losses. Gross margins remained favorable at 70%, but operating expenses grew proportionally, worsening EBIT and net income margins in the latest fiscal year.
Nutanix, Inc.
Nutanix demonstrated solid revenue growth of 82.01% over the 2021-2025 period, reaching $2.54B in 2025. Net income turned positive with a 7.42% net margin, supported by an EBIT margin of 8.67%. Margins improved steadily, and the company posted strong year-over-year growth in revenue, profit, and EPS, signaling recovering fundamentals and operational efficiency gains.
Which one has the stronger fundamentals?
Nutanix holds stronger fundamentals, showing consistent revenue expansion and a positive net margin, alongside favorable EBIT and interest expense ratios. In contrast, Rubrik, despite rapid revenue gains, suffers from significant net losses and deteriorating profitability metrics. Nutanix’s overall income statement evaluation is favorable, while Rubrik’s remains unfavorable, highlighting clear differences in financial health.
Financial Ratios Comparison
The table below compares key financial ratios of Rubrik, Inc. and Nutanix, Inc. for the most recent fiscal year, providing insights into profitability, liquidity, leverage, and operational efficiency.
| Ratios | Rubrik, Inc. (2025) | Nutanix, Inc. (2025) |
|---|---|---|
| ROE | 2.09% | -27.12% |
| ROIC | -2.35% | 8.11% |
| P/E | -9.79 | 106.74 |
| P/B | -20.42 | -28.95 |
| Current Ratio | 1.13 | 1.72 |
| Quick Ratio | 1.13 | 1.72 |
| D/E (Debt-to-Equity) | -0.63 | -2.14 |
| Debt-to-Assets | 24.65% | 45.16% |
| Interest Coverage | -27.49 | 8.75 |
| Asset Turnover | 0.62 | 0.77 |
| Fixed Asset Turnover | 16.67 | 9.15 |
| Payout Ratio | 0 | 0 |
| Dividend Yield | 0% | 0% |
Interpretation of the Ratios
Rubrik, Inc.
Rubrik exhibits a mixed ratio profile with favorable ROE at 208.55% and solid debt metrics, including a negative debt-to-equity of -0.63 and a debt-to-assets ratio of 24.65%, indicating strong solvency. However, concerns arise from an unfavorable net margin of -130.26% and weak interest coverage at -26.84. The current ratio is neutral at 1.13. Rubrik does not pay dividends, likely due to negative profitability and reinvestment priorities.
Nutanix, Inc.
Nutanix presents a generally balanced ratio set, with favorable liquidity indicated by a current ratio of 1.72 and quick ratio at the same level. Its interest coverage is strong at 11.15, while net margin is neutral at 7.42%. However, Nutanix shows unfavorable ROE of -27.12% and a high PE ratio of 106.74, suggesting valuation concerns. Like Rubrik, Nutanix pays no dividends, consistent with growth and reinvestment strategies.
Which one has the best ratios?
Rubrik’s ratios lean more favorable globally at 57.14% versus Nutanix’s 50%, supported by superior ROE and solvency metrics, despite profitability challenges. Nutanix’s stronger liquidity and interest coverage offer stability, but its negative ROE and high valuation ratios temper its profile. Overall, Rubrik holds a slight edge in ratio strength based on the provided data.
Strategic Positioning
This section compares the strategic positioning of Rubrik and Nutanix, including market position, key segments, and exposure to technological disruption:
Rubrik, Inc.
- Strong presence in data security with low beta and NYSE listing; faces competition in infrastructure software.
- Focuses on data security solutions including enterprise and SaaS data protection, serving multiple sectors globally.
- Operates in a technology-driven industry with emphasis on data threat analytics and cyber recovery solutions.
Nutanix, Inc.
- Enterprise cloud platform leader with higher beta, NASDAQ listing, and broad geographic reach.
- Offers a diversified cloud platform covering virtualization, storage, Kubernetes, and hybrid cloud orchestration.
- Highly exposed to cloud-native technologies and hybrid cloud orchestration, integrating Kubernetes and automation tools.
Rubrik vs Nutanix Positioning
Rubrik concentrates on data security and protection across diverse industries, while Nutanix pursues a diversified cloud infrastructure platform with broad service offerings. Rubrik’s narrower focus contrasts with Nutanix’s extensive product suite and global market presence.
Which has the best competitive advantage?
Nutanix demonstrates a very favorable moat with growing ROIC exceeding WACC, indicating durable competitive advantage and increasing profitability. Rubrik shows a very unfavorable moat with declining ROIC, signaling value destruction and weaker competitive positioning.
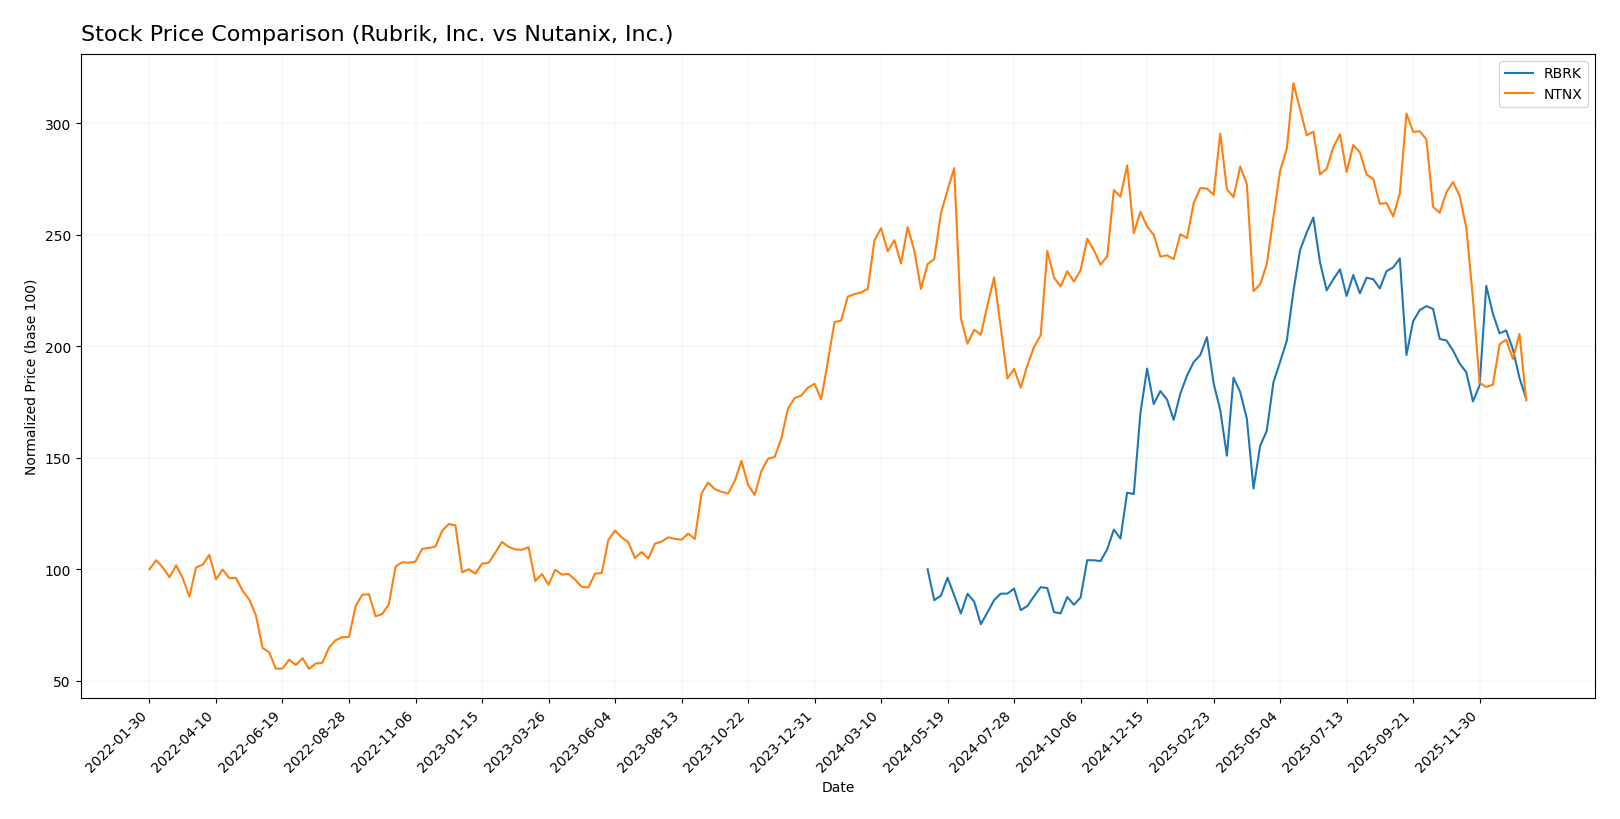
Stock Comparison
The past year has seen Rubrik, Inc. (RBRK) display a strong bullish trend with a 76.58% gain, albeit with decelerating momentum, while Nutanix, Inc. (NTNX) experienced a bearish decline of 22.16%, also slowing down in its downward trajectory.
Trend Analysis
Rubrik, Inc.’s stock showed a bullish trend over the past 12 months with a 76.58% increase, though the trend is decelerating and volatility remains elevated with a 21.4 std deviation.
Nutanix, Inc.’s stock declined 22.16% over the same period, marking a bearish trend with decelerating losses and lower volatility at an 8.67 std deviation.
Comparing both, Rubrik delivered the highest market performance with a significant positive price change, contrasting with Nutanix’s notable negative return.
Target Prices
The current analyst consensus indicates varying upside potential for Rubrik, Inc. and Nutanix, Inc.
| Company | Target High | Target Low | Consensus |
|---|---|---|---|
| Rubrik, Inc. | 113 | 105 | 109.33 |
| Nutanix, Inc. | 90 | 53 | 64.67 |
Analysts see Rubrik’s price potentially rising significantly from its current $67.1, while Nutanix shows moderate upside from $45.74, reflecting cautious optimism in both stocks.
Analyst Opinions Comparison
This section compares analysts’ ratings and grades for Rubrik, Inc. and Nutanix, Inc.:
Rating Comparison
Rubrik, Inc. Rating
- Rating: C, considered very favorable by evaluators.
- Discounted Cash Flow Score: 1, indicating very unfavorable valuation.
- ROE Score: 5, showing very favorable efficiency in generating profit from equity.
- ROA Score: 1, reflecting very unfavorable asset utilization.
- Debt To Equity Score: 1, indicating very unfavorable financial risk.
- Overall Score: 2, representing a moderate overall rating.
Nutanix, Inc. Rating
- Rating: C+, also considered very favorable by evaluators.
- Discounted Cash Flow Score: 4, indicating a favorable valuation.
- ROE Score: 1, indicating very unfavorable profit generation efficiency.
- ROA Score: 4, reflecting favorable asset utilization.
- Debt To Equity Score: 1, also indicating very unfavorable financial risk.
- Overall Score: 2, representing a moderate overall rating.
Which one is the best rated?
Nutanix, Inc. holds a slightly better rating with a C+ versus Rubrik’s C, driven by a favorable discounted cash flow and return on assets scores. However, Rubrik excels in return on equity. Both share moderate overall scores and high financial risk indicators.
Scores Comparison
The following table compares the Altman Z-Score and Piotroski Score of Rubrik, Inc. and Nutanix, Inc.:
Rubrik, Inc. Scores
- Altman Z-Score: 1.41, indicating financial distress zone.
- Piotroski Score: 4, reflecting average financial strength.
Nutanix, Inc. Scores
- Altman Z-Score: 1.48, indicating financial distress zone.
- Piotroski Score: 6, reflecting average financial strength.
Which company has the best scores?
Nutanix has marginally higher Altman Z-Score and Piotroski Score than Rubrik, both remaining in the distress and average categories respectively, indicating relatively better but still cautious financial health.
Grades Comparison
Here is a comparison of the latest grades assigned to Rubrik, Inc. and Nutanix, Inc.:
Rubrik, Inc. Grades
The following table summarizes recent grades from recognized grading companies for Rubrik, Inc.:
| Grading Company | Action | New Grade | Date |
|---|---|---|---|
| Keybanc | Maintain | Overweight | 2026-01-12 |
| Piper Sandler | Maintain | Overweight | 2026-01-05 |
| Citigroup | Maintain | Buy | 2025-12-08 |
| Piper Sandler | Maintain | Overweight | 2025-12-05 |
| Baird | Maintain | Outperform | 2025-12-05 |
| William Blair | Upgrade | Outperform | 2025-12-05 |
| Keybanc | Maintain | Overweight | 2025-12-05 |
| Wedbush | Maintain | Outperform | 2025-12-05 |
| BMO Capital | Maintain | Outperform | 2025-12-05 |
| Rosenblatt | Maintain | Buy | 2025-12-05 |
Rubrik’s grades consistently indicate positive analyst sentiment, with most firms maintaining or upgrading to Overweight, Buy, or Outperform ratings.
Nutanix, Inc. Grades
The following table shows recent grades from recognized grading companies for Nutanix, Inc.:
| Grading Company | Action | New Grade | Date |
|---|---|---|---|
| Barclays | Downgrade | Equal Weight | 2026-01-15 |
| Morgan Stanley | Downgrade | Equal Weight | 2026-01-12 |
| RBC Capital | Maintain | Outperform | 2026-01-05 |
| Goldman Sachs | Maintain | Buy | 2025-11-28 |
| JP Morgan | Maintain | Overweight | 2025-11-26 |
| Needham | Maintain | Buy | 2025-11-26 |
| Wells Fargo | Maintain | Equal Weight | 2025-11-26 |
| Morgan Stanley | Maintain | Overweight | 2025-11-26 |
| Keybanc | Maintain | Overweight | 2025-11-26 |
| Piper Sandler | Maintain | Overweight | 2025-11-26 |
Nutanix’s grades show a mixed trend with recent downgrades to Equal Weight by Barclays and Morgan Stanley, though several firms continue to rate it Overweight or Buy.
Which company has the best grades?
Rubrik, Inc. has received more uniformly positive grades, with no downgrades and several upgrades, signaling stronger analyst confidence. Nutanix, Inc. shows some recent cautious downgrades, which could imply higher uncertainty. Investors might perceive Rubrik’s more consistent positive ratings as an indicator of comparatively steadier outlook.
Strengths and Weaknesses
Below is a comparative overview of key strengths and weaknesses for Rubrik, Inc. (RBRK) and Nutanix, Inc. (NTNX) based on recent financial data and market performance.
| Criterion | Rubrik, Inc. (RBRK) | Nutanix, Inc. (NTNX) |
|---|---|---|
| Diversification | Moderate, with strong subscription revenue (828M USD in 2025) but limited product variety | High, balanced between subscriptions (2B USD in 2024) and professional services |
| Profitability | Negative net margin (-130%), negative ROIC (-235%), value destroying | Slightly positive net margin (7.4%), positive ROIC (8.1%), value creating |
| Innovation | Declining ROIC trend, indicating issues in sustaining innovation | Growing ROIC trend, reflecting durable competitive advantage and innovation |
| Global presence | Limited data, but moderate asset turnover and liquidity ratios indicate stable operations | Strong liquidity and asset turnover, indicating efficient global operations |
| Market Share | Challenged by value destruction and declining profitability | Favorable market position with increasing profitability and investment returns |
Key takeaway: Nutanix demonstrates a stronger economic moat with growing profitability and innovation, suitable for cautious investment. Rubrik faces significant headwinds with declining returns and profitability, suggesting higher risk for investors.
Risk Analysis
Below is a comparative table illustrating key risks for Rubrik, Inc. (RBRK) and Nutanix, Inc. (NTNX) based on the most recent 2025 data:
| Metric | Rubrik, Inc. (RBRK) | Nutanix, Inc. (NTNX) |
|---|---|---|
| Market Risk | Low beta (0.28) suggests lower volatility; moderate market cap $13.4B | Moderate beta (0.49) indicates medium volatility; market cap $12.4B |
| Debt Level | Low debt-to-assets at 24.7%, favorable debt/equity ratio | Higher debt-to-assets at 45.2%, neutral risk profile |
| Regulatory Risk | Moderate, operates globally with diverse sectors, including public and healthcare | Moderate, global presence with complex cloud and data services |
| Operational Risk | Negative net margin (-130%) and interest coverage ratio signals operational challenges | Slightly positive margin (7.4%), healthy interest coverage (11.15) |
| Environmental Risk | Standard for tech sector; no specific disclosures raising concern | Standard for tech sector; no specific disclosures raising concern |
| Geopolitical Risk | US-based with diversified international clients, moderate exposure | US-based with broad global operations, moderate exposure |
In synthesis, Rubrik faces significant operational risks with deeply negative profitability and weak interest coverage, increasing financial strain. Nutanix has better operational metrics but carries higher debt levels, posing moderate financial risk. Both companies have moderate market and geopolitical risks typical for global tech firms. Investors should carefully weigh Rubrik’s financial distress signals against Nutanix’s leverage when managing portfolio risk.
Which Stock to Choose?
Rubrik, Inc. (RBRK) displays a strong revenue growth of 41% in 2025 but suffers from negative profitability with a net margin of -130%. Financial ratios are mostly favorable, including a high ROE of 208%, low debt, and a moderate current ratio. However, its overall income statement and MOAT evaluations are unfavorable, indicating value destruction and declining profitability.
Nutanix, Inc. (NTNX) shows a favorable income statement with 7.4% net margin and steady revenue growth of 18% in 2025. Its financial ratios are slightly favorable, supported by a stable WACC, good cash flow yield, and moderate debt levels. The MOAT analysis is very favorable, signaling value creation and increasing profitability, despite a less positive ROE.
For investors prioritizing durable competitive advantage and value creation, Nutanix’s improving profitability and favorable MOAT might appear more attractive. Conversely, investors focused on high ROE and rapid top-line growth could see Rubrik’s profile as offering potential despite current profitability challenges. Thus, the choice could depend on the investor’s risk tolerance and strategy focus.
Disclaimer: Investment carries a risk of loss of initial capital. The past performance is not a reliable indicator of future results. Be sure to understand risks before making an investment decision.
Go Further
I encourage you to read the complete analyses of Rubrik, Inc. and Nutanix, Inc. to enhance your investment decisions: