In the rapidly evolving software infrastructure sector, Palo Alto Networks, Inc. (PANW) and Nutanix, Inc. (NTNX) stand out as key players driving innovation. Both companies offer cutting-edge solutions addressing enterprise security and cloud computing needs, competing for market share among global organizations. This comparison sheds light on their strategic strengths and growth potential, helping you decide which stock could be the smarter addition to your investment portfolio.
Table of contents
Companies Overview
I will begin the comparison between Palo Alto Networks, Inc. and Nutanix, Inc. by providing an overview of these two companies and their main differences.
Palo Alto Networks Overview
Palo Alto Networks, Inc. is a leading cybersecurity company headquartered in Santa Clara, California. Established in 2005, it provides a wide range of cybersecurity solutions including firewall appliances, subscription services for threat prevention, cloud security, and cyber consulting. Its client base spans medium to large enterprises, service providers, and government sectors globally, positioning it strongly in the software infrastructure industry with a market cap of 128B USD.
Nutanix Overview
Nutanix, Inc., based in San Jose, California, offers an enterprise cloud platform with products such as virtualization, storage, and cloud orchestration services. Founded in 2009, Nutanix serves a diverse range of industries across multiple continents, focusing on hybrid and public cloud environments. The company holds a market cap of 12.4B USD and specializes in software infrastructure, providing automation and cloud governance solutions alongside consulting and support services.
Key similarities and differences
Both Palo Alto Networks and Nutanix operate in the software infrastructure sector and serve large enterprise customers across various industries worldwide. While Palo Alto Networks specializes in cybersecurity solutions and threat intelligence, Nutanix focuses on enterprise cloud platforms and hybrid cloud management. The companies differ significantly in scale, with Palo Alto Networks having a market cap more than ten times larger and a broader portfolio in cybersecurity compared to Nutanix’s cloud-centric product suite.
Income Statement Comparison
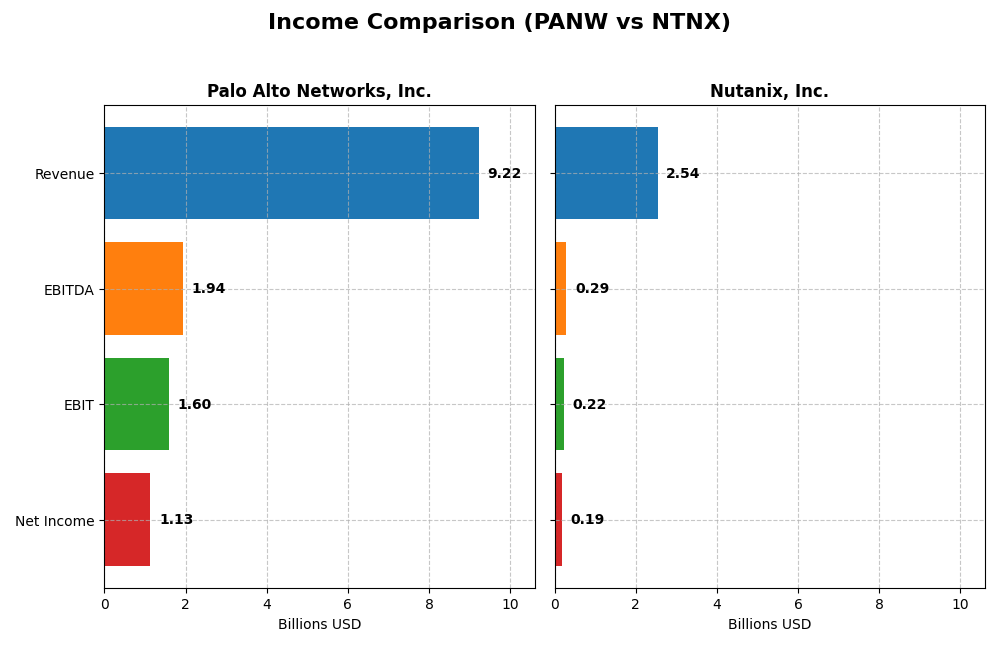
The table below presents a side-by-side comparison of the most recent fiscal year income statement metrics for Palo Alto Networks, Inc. and Nutanix, Inc., facilitating a clear financial overview.
| Metric | Palo Alto Networks, Inc. | Nutanix, Inc. |
|---|---|---|
| Market Cap | 128.4B | 12.4B |
| Revenue | 9.22B | 2.54B |
| EBITDA | 1.94B | 293M |
| EBIT | 1.60B | 220M |
| Net Income | 1.13B | 188M |
| EPS | 1.71 | 0.70 |
| Fiscal Year | 2025 | 2025 |
Income Statement Interpretations
Palo Alto Networks, Inc.
From 2021 to 2025, Palo Alto Networks saw strong revenue growth, climbing from $4.3B to $9.2B, with net income turning positive after initial losses and reaching $1.13B in 2025. Margins mostly improved, notably gross margin at 73.41% and EBIT margin at 17.32% in 2025. However, net margin declined sharply in the last year despite revenue growth, reflecting margin pressure or expenses increase.
Nutanix, Inc.
Nutanix’s revenue rose steadily from $1.39B in 2021 to $2.54B in 2025, with net income shifting from a significant loss to a positive $188M. The company maintained a high gross margin of 86.81% in 2025, though EBIT margin remained moderate at 8.67%. Recent year growth accelerated, with net margin and EPS showing strong improvement, indicating operational gains and better profitability.
Which one has the stronger fundamentals?
Both companies exhibit favorable income statement trends, with Palo Alto Networks showing higher absolute revenues and margins but recent net margin decline. Nutanix demonstrates a robust margin profile and consistent move from losses to profits, with strong recent margin expansion. Nutanix’s income statement shows fewer unfavorable signals, suggesting relatively stronger current profitability fundamentals.
Financial Ratios Comparison
The table below presents a side-by-side comparison of key financial ratios for Palo Alto Networks, Inc. (PANW) and Nutanix, Inc. (NTNX) based on the most recent fiscal year 2025 data.
| Ratios | Palo Alto Networks, Inc. (PANW) | Nutanix, Inc. (NTNX) |
|---|---|---|
| ROE | 14.49% | -27.12% |
| ROIC | 5.67% | 8.11% |
| P/E | 101.43 | 106.74 |
| P/B | 14.70 | -28.95 |
| Current Ratio | 0.89 | 1.72 |
| Quick Ratio | 0.89 | 1.72 |
| D/E | 0.04 | -2.14 |
| Debt-to-Assets | 1.43% | 45.16% |
| Interest Coverage | 414.3 | 8.75 |
| Asset Turnover | 0.39 | 0.77 |
| Fixed Asset Turnover | 12.56 | 9.15 |
| Payout ratio | 0 | 0 |
| Dividend yield | 0 | 0 |
Interpretation of the Ratios
Palo Alto Networks, Inc.
Palo Alto Networks shows a mix of strengths and weaknesses in its 2025 ratios. It has favorable net margin (12.3%) and WACC (7.37%), with strong interest coverage (532.53) and low debt to equity (0.04). However, its valuation ratios (PE 101.43, PB 14.7) and liquidity (current ratio 0.89) are unfavorable. The company does not pay dividends, likely focusing on growth and reinvestment.
Nutanix, Inc.
Nutanix demonstrates several favorable ratios in 2025, including a solid current ratio (1.72), quick ratio (1.72), and interest coverage (11.15). Its negative debt to equity (-2.14) and favorable price-to-book ratio contrast with a negative return on equity (-27.12%) and high PE (106.74), suggesting caution. The company does not distribute dividends, possibly prioritizing growth and R&D investments.
Which one has the best ratios?
Both companies receive a “slightly favorable” overall rating, but Nutanix holds a higher percentage of favorable ratios (50% vs. 42.86%) and stronger liquidity metrics. Palo Alto Networks boasts better profitability and leverage indicators but weaker valuation and liquidity. The choice depends on weighing profitability versus financial stability and valuation concerns.
Strategic Positioning
This section compares the strategic positioning of Palo Alto Networks and Nutanix, focusing on market position, key segments, and exposure to technological disruption:
Palo Alto Networks
- Leading cybersecurity provider with significant market cap and competitive pressure.
- Key segments include firewall appliances, subscription services, and security support.
- Exposed to rapid cybersecurity innovation and evolving cloud security needs.
Nutanix
- Smaller market cap, focused on enterprise cloud platform with moderate competitive pressure.
- Key segments cover virtualization, hybrid cloud orchestration, and professional services.
- Faces technological shifts in cloud-native environments and Kubernetes management.
Palo Alto Networks vs Nutanix Positioning
Palo Alto Networks has a diversified cybersecurity approach spanning multiple industries and product types, while Nutanix concentrates on enterprise cloud infrastructure and automation. Diversification offers broad exposure, whereas concentration focuses on cloud-native technology specialization.
Which has the best competitive advantage?
Nutanix shows a durable competitive advantage with a favorable moat and growing profitability. Palo Alto Networks currently sheds value despite increasing ROIC, indicating a slightly unfavorable moat position.
Stock Comparison
The past year has seen Palo Alto Networks, Inc. (PANW) exhibit strong bullish momentum with a 33.05% price increase, while Nutanix, Inc. (NTNX) faced a significant bearish trend, declining by 22.16%, reflecting contrasting market dynamics.
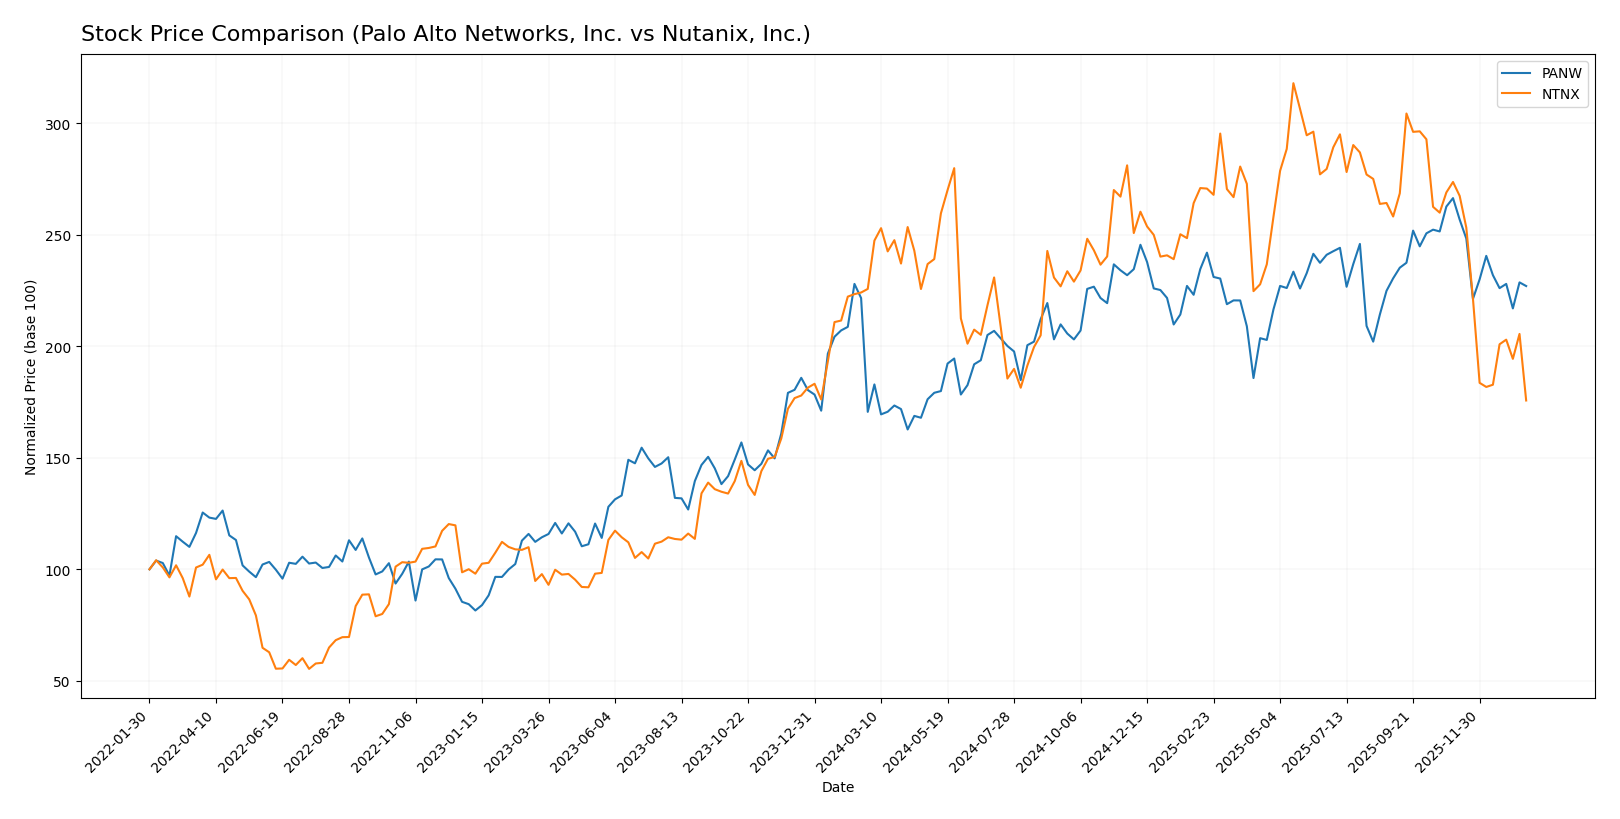
Trend Analysis
Palo Alto Networks, Inc. showed a bullish trend over the past 12 months with a 33.05% price increase and decelerating momentum, reaching a high of 220.24 and a low of 134.51, with notable volatility (std dev 19.95).
Nutanix, Inc. displayed a bearish trend with a 22.16% price decline over the same period, decelerating in its downward trajectory, hitting a high of 82.77 and a low of 45.74, with less volatility (std dev 8.67).
Comparing the two, PANW delivered the highest market performance with a strong positive trend, while NTNX experienced a substantial decline, underscoring divergent investor sentiment and stock momentum.
Target Prices
The consensus target prices from recognized analysts indicate potential upside for both Palo Alto Networks and Nutanix.
| Company | Target High | Target Low | Consensus |
|---|---|---|---|
| Palo Alto Networks, Inc. | 265 | 157 | 231.07 |
| Nutanix, Inc. | 90 | 53 | 64.67 |
Analysts expect Palo Alto Networks’ stock to rise significantly above its current price of $187.66, while Nutanix’s consensus target of $64.67 suggests a substantial potential rebound from its current $45.74.
Analyst Opinions Comparison
This section compares analysts’ ratings and grades for Palo Alto Networks, Inc. and Nutanix, Inc.:
Rating Comparison
Palo Alto Networks, Inc. Rating
- Rating: B, considered very favorable by analysts.
- Discounted Cash Flow Score: 4, indicating favorable valuation.
- ROE Score: 4, showing efficient profit generation from equity.
- ROA Score: 3, demonstrating moderate asset utilization.
- Debt To Equity Score: 4, indicating favorable financial stability.
- Overall Score: 3, reflecting moderate overall financial standing.
Nutanix, Inc. Rating
- Rating: C+, also considered very favorable by analysts.
- Discounted Cash Flow Score: 4, indicating favorable valuation.
- ROE Score: 1, indicating very unfavorable profit generation.
- ROA Score: 4, demonstrating favorable asset utilization.
- Debt To Equity Score: 1, indicating very unfavorable stability.
- Overall Score: 2, reflecting moderate overall financial standing.
Which one is the best rated?
Based strictly on the provided data, Palo Alto Networks holds a higher overall rating (B vs. C+) and stronger scores in ROE and debt to equity, suggesting a better rating compared to Nutanix.
Scores Comparison
Here is a comparison of the financial scores for Palo Alto Networks and Nutanix:
Palo Alto Networks Scores
- Altman Z-Score: 5.95, indicating a safe zone, low bankruptcy risk.
- Piotroski Score: 6, reflecting average financial strength.
Nutanix Scores
- Altman Z-Score: 1.48, indicating distress zone, high bankruptcy risk.
- Piotroski Score: 6, reflecting average financial strength.
Which company has the best scores?
Palo Alto Networks shows a significantly stronger Altman Z-Score, placing it in the safe zone, while Nutanix falls in the distress zone. Both companies have the same average Piotroski Score of 6. Thus, Palo Alto Networks has the better overall scores based on this data.
Grades Comparison
The grades provided by reputable financial institutions for Palo Alto Networks, Inc. and Nutanix, Inc. are as follows:
Palo Alto Networks, Inc. Grades
The following table summarizes recent grades from established grading companies for Palo Alto Networks, Inc.:
| Grading Company | Action | New Grade | Date |
|---|---|---|---|
| UBS | Maintain | Neutral | 2026-01-13 |
| Piper Sandler | Maintain | Overweight | 2026-01-05 |
| Guggenheim | Upgrade | Neutral | 2026-01-05 |
| Morgan Stanley | Maintain | Overweight | 2025-12-18 |
| Goldman Sachs | Maintain | Buy | 2025-11-21 |
| HSBC | Downgrade | Reduce | 2025-11-21 |
| Needham | Maintain | Buy | 2025-11-20 |
| WestPark Capital | Maintain | Hold | 2025-11-20 |
| Bernstein | Maintain | Outperform | 2025-11-20 |
| DA Davidson | Maintain | Buy | 2025-11-20 |
Overall, Palo Alto Networks exhibits a generally positive grade trend with multiple “Buy” and “Overweight” ratings, though a downgrade to “Reduce” by HSBC stands out as a cautionary note.
Nutanix, Inc. Grades
The following table shows recent grades from recognized grading companies for Nutanix, Inc.:
| Grading Company | Action | New Grade | Date |
|---|---|---|---|
| Barclays | Downgrade | Equal Weight | 2026-01-15 |
| Morgan Stanley | Downgrade | Equal Weight | 2026-01-12 |
| RBC Capital | Maintain | Outperform | 2026-01-05 |
| Goldman Sachs | Maintain | Buy | 2025-11-28 |
| JP Morgan | Maintain | Overweight | 2025-11-26 |
| Needham | Maintain | Buy | 2025-11-26 |
| Wells Fargo | Maintain | Equal Weight | 2025-11-26 |
| Morgan Stanley | Maintain | Overweight | 2025-11-26 |
| Keybanc | Maintain | Overweight | 2025-11-26 |
| Piper Sandler | Maintain | Overweight | 2025-11-26 |
Nutanix shows a mix of “Buy,” “Overweight,” and “Equal Weight” ratings, with some recent downgrades from “Overweight” to “Equal Weight,” indicating a slightly more cautious stance by certain analysts.
Which company has the best grades?
Palo Alto Networks, Inc. has a stronger consensus with a majority of “Buy” and “Overweight” ratings and only one notable downgrade, whereas Nutanix, Inc. has recent downgrades to “Equal Weight” alongside its positive ratings. This suggests Palo Alto Networks currently holds a comparatively more favorable analyst outlook, potentially impacting investor perception of growth and risk profiles.
Strengths and Weaknesses
Below is a comparative overview of key strengths and weaknesses for Palo Alto Networks, Inc. (PANW) and Nutanix, Inc. (NTNX) based on recent financial and strategic data.
| Criterion | Palo Alto Networks, Inc. (PANW) | Nutanix, Inc. (NTNX) |
|---|---|---|
| Diversification | Strong with balanced revenue from products (1.8B), subscriptions (4.97B), and support (2.45B) in 2025 | Moderate, primarily subscription-driven (2.02B in 2024), supplemented by professional services and product sales |
| Profitability | Net margin of 12.3%, ROIC 5.67%, but ROIC below WACC indicating value shedding | Net margin 7.42%, ROIC 8.11%, ROIC above WACC showing value creation |
| Innovation | Growing ROIC trend (225%) suggests improving profitability and innovation potential | ROIC trend growing (117%), indicating increasing profitability and competitive advantage |
| Global presence | Large global footprint, high support and subscription revenue imply strong international customer base | Growing global presence with increasing subscription services and professional services revenue |
| Market Share | High market share in cybersecurity, but high P/E (101.43) and P/B (14.7) ratios may indicate overvaluation | Smaller market share in cloud infrastructure, high P/E (106.74), but favorable P/B (-28.95) ratio suggests undervaluation in book terms |
Key takeaways: Palo Alto Networks shows strong revenue diversification and improving profitability, though it currently sheds value relative to capital costs. Nutanix demonstrates durable competitive advantage with growing ROIC and better value creation. Both companies have slightly favorable financial ratios, but valuation metrics require careful consideration for risk management.
Risk Analysis
The table below summarizes key risk factors for Palo Alto Networks, Inc. (PANW) and Nutanix, Inc. (NTNX) based on the most recent financial and operational data for 2025.
| Metric | Palo Alto Networks, Inc. (PANW) | Nutanix, Inc. (NTNX) |
|---|---|---|
| Market Risk | Moderate beta 0.75; stable sector demand | Lower beta 0.49; volatile recent price drop (-6%) |
| Debt level | Very low debt-to-equity (0.04), very favorable | Moderate debt-to-assets (45.16%), mixed signals |
| Regulatory Risk | Moderate, cybersecurity sensitive | Moderate, cloud infrastructure regulations |
| Operational Risk | High asset turnover challenges (0.39 unfavorable) | Moderate operational efficiency (asset turnover 0.77 neutral) |
| Environmental Risk | Low direct exposure | Low direct exposure |
| Geopolitical Risk | Moderate, global sales exposure | Moderate, international customer base |
The most significant risks are Nutanix’s financial distress signals, reflected in its Altman Z-score in the distress zone (1.48) and negative return on equity (-27.12%), indicating higher bankruptcy risk. Palo Alto Networks shows stronger financial stability with a safe Altman Z-score (5.95) and low debt, though its high valuation ratios (P/E and P/B unfavorable) and slightly weak liquidity (current ratio 0.89) warrant caution. Investors should weigh Nutanix’s financial risk against potential growth and monitor Palo Alto’s valuation carefully.
Which Stock to Choose?
Palo Alto Networks, Inc. (PANW) shows a favorable income statement with strong revenue and net income growth over 2021-2025, a slightly favorable global ratios evaluation, low debt levels, and a very favorable B rating, despite some unfavorable P/E and P/B metrics.
Nutanix, Inc. (NTNX) presents a favorable income statement with solid revenue and net margin growth, a slightly favorable global ratios evaluation, higher debt compared to assets, and a very favorable C+ rating, although its return on equity and price multiples are unfavorable.
Investors seeking growth might find PANW appealing given its strong profitability and low debt, while those with a higher risk tolerance and focus on value creation could view NTNX’s favorable moat and improving income statement as attractive, despite its financial leverage and mixed profitability metrics.
Disclaimer: Investment carries a risk of loss of initial capital. The past performance is not a reliable indicator of future results. Be sure to understand risks before making an investment decision.
Go Further
I encourage you to read the complete analyses of Palo Alto Networks, Inc. and Nutanix, Inc. to enhance your investment decisions: