Home > Comparison > Technology > PLTR vs NTNX
The strategic rivalry between Palantir Technologies Inc. and Nutanix, Inc. shapes the future of the software infrastructure sector. Palantir operates as a data analytics powerhouse focused on intelligence and defense, while Nutanix delivers enterprise cloud platforms emphasizing hybrid cloud orchestration. This head-to-head pits Palantir’s specialized software solutions against Nutanix’s broad cloud infrastructure services. This analysis will reveal which company’s trajectory offers a superior risk-adjusted return for diversified portfolios.
Table of contents
Companies Overview
Palantir Technologies and Nutanix stand as pivotal players in the software infrastructure sector, shaping enterprise technology globally.
Palantir Technologies Inc.: Data-Driven Intelligence Pioneer
Palantir specializes in software platforms that empower intelligence agencies and enterprises to uncover deep data patterns. Its core revenue derives from Palantir Gotham and Foundry, which enable complex data integration and operational planning. In 2026, Palantir focuses on expanding its AI platform and enhancing software deployment flexibility across diverse environments.
Nutanix, Inc.: Hybrid Cloud Infrastructure Innovator
Nutanix delivers an enterprise cloud platform that integrates virtualization, storage, and networking for hybrid cloud environments. It generates revenue through solutions like Acropolis and Prism Pro, targeting streamlined cloud operations and automation. Nutanix’s 2026 strategy centers on advancing hybrid cloud orchestration and expanding Kubernetes management capabilities.
Strategic Collision: Similarities & Divergences
Both companies compete in infrastructure software but differ fundamentally: Palantir emphasizes data intelligence and AI-driven insights, while Nutanix prioritizes hybrid cloud infrastructure and automation. The battleground is enterprise cloud transformation, where Palantir’s analytics meets Nutanix’s operational platform. Their distinct approaches create contrasting investment profiles—Palantir as a high-beta innovation leader, Nutanix as a steady hybrid cloud enabler.
Income Statement Comparison
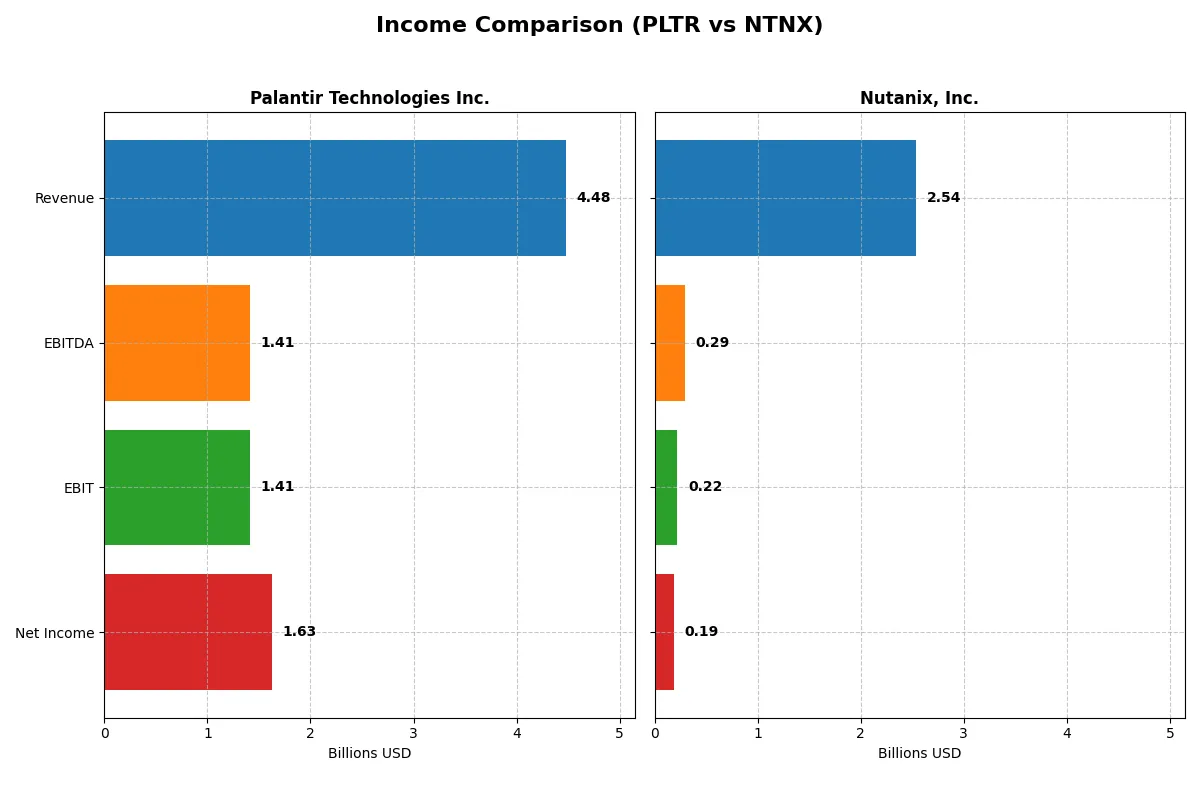
This data dissects the core profitability and scalability of both corporate engines to reveal who dominates the bottom line:
| Metric | Palantir Technologies Inc. (PLTR) | Nutanix, Inc. (NTNX) |
|---|---|---|
| Revenue | 4.48B | 2.54B |
| Cost of Revenue | 789M | 335M |
| Operating Expenses | 2.27B | 2.03B |
| Gross Profit | 3.69B | 2.20B |
| EBITDA | 1.41B | 293M |
| EBIT | 1.41B | 220M |
| Interest Expense | 0 | 20M |
| Net Income | 1.63B | 188M |
| EPS | 0.69 | 0.70 |
| Fiscal Year | 2025 | 2025 |
Income Statement Analysis: The Bottom-Line Duel
This income statement comparison reveals which company runs a more efficient and profitable business engine over recent years.
Palantir Technologies Inc. Analysis
Palantir’s revenue surged from 1.54B in 2021 to 4.48B in 2025, reflecting strong growth momentum. Its gross margin stays robust at 82%, while net margin climbed impressively to 36% in 2025. Palantir’s operating efficiency exploded, with EBIT soaring 355% year-over-year, signaling accelerating profitability and disciplined cost control.
Nutanix, Inc. Analysis
Nutanix’s revenue grew steadily from 1.39B in 2021 to 2.54B in 2025, showing consistent scale expansion. Gross margin is higher than Palantir’s at 87%, but net margin lags at 7% in 2025. EBIT improved markedly by 223% year-over-year, yet overall profitability remains modest, reflecting a longer path to operational leverage.
Margin Muscle vs. Revenue Rocket
Palantir clearly outperforms Nutanix on net margin and EBIT growth, driven by rapid revenue scaling and efficient expense management. Nutanix boasts superior gross margin but struggles to convert scale into bottom-line profits. For investors, Palantir’s profile offers a compelling mix of accelerating profitability and strong growth momentum.
Financial Ratios Comparison
These vital ratios act as a diagnostic tool to expose the underlying fiscal health, valuation premiums, and capital efficiency of the companies compared below:
| Ratios | Palantir Technologies Inc. (PLTR) | Nutanix, Inc. (NTNX) |
|---|---|---|
| ROE | 9.24% | -27.12% |
| ROIC | 5.51% | 8.11% |
| P/E | 368.20 | 106.74 |
| P/B | 34.01 | -28.95 |
| Current Ratio | 5.96 | 1.72 |
| Quick Ratio | 5.96 | 1.72 |
| D/E | 0.048 | -2.14 |
| Debt-to-Assets | 3.77% | 45.16% |
| Interest Coverage | 0 | 8.75 |
| Asset Turnover | 0.45 | 0.77 |
| Fixed Asset Turnover | 11.92 | 9.15 |
| Payout Ratio | 0 | 0 |
| Dividend Yield | 0 | 0 |
| Fiscal Year | 2024 | 2025 |
Efficiency & Valuation Duel: The Vital Signs
Financial ratios act as a company’s DNA, uncovering hidden risks and operational strengths that shape investor decisions.
Palantir Technologies Inc.
Palantir posts a moderate ROE of 9.24% with a strong net margin of 16.13%, signaling decent profitability. However, its valuation appears stretched with a P/E ratio of 368.2 and a P/B of 34.01, indicating high market expectations. It offers no dividends, focusing instead on reinvestment in R&D, which accounts for 17.7% of revenue, supporting growth ambitions.
Nutanix, Inc.
Nutanix shows a weaker net margin at 7.42% and a negative ROE of -27.12%, reflecting profitability challenges. Its P/E of 106.74 remains elevated but less extreme than Palantir’s. The company posts a favorable current ratio of 1.72 and a solid interest coverage of 11.15, indicating liquidity and debt service strength. Like Palantir, it pays no dividends, prioritizing capital reinvestment to drive operational efficiency.
Premium Valuation vs. Operational Safety
Palantir’s high valuation contrasts with Nutanix’s more balanced financial footing and slightly favorable ratio profile. Nutanix offers better liquidity and debt metrics, while Palantir’s superior margins come at a premium price. Investors seeking growth with risk tolerance may lean toward Palantir; those favoring operational stability might prefer Nutanix.
Which one offers the Superior Shareholder Reward?
I see Palantir Technologies Inc. (PLTR) and Nutanix, Inc. (NTNX) both forgo dividends, focusing on reinvestment and buybacks. PLTR shows zero dividend payout and yield, opting to reinvest heavily in growth. Nutanix also pays no dividends but exhibits a more modest free cash flow yield. PLTR’s buyback program remains minimal, while NTNX’s balance sheet reflects higher debt and financial leverage, increasing risk. Historically, I’ve observed that high leverage in tech firms like NTNX can hamper sustainable returns. PLTR’s superior free cash flow coverage and conservative capital structure suggest a more durable shareholder reward. Therefore, I conclude PLTR offers a more attractive total return profile in 2026.
Comparative Score Analysis: The Strategic Profile
The radar chart reveals the fundamental DNA and trade-offs of Palantir Technologies Inc. and Nutanix, Inc., outlining their financial strengths and vulnerabilities:
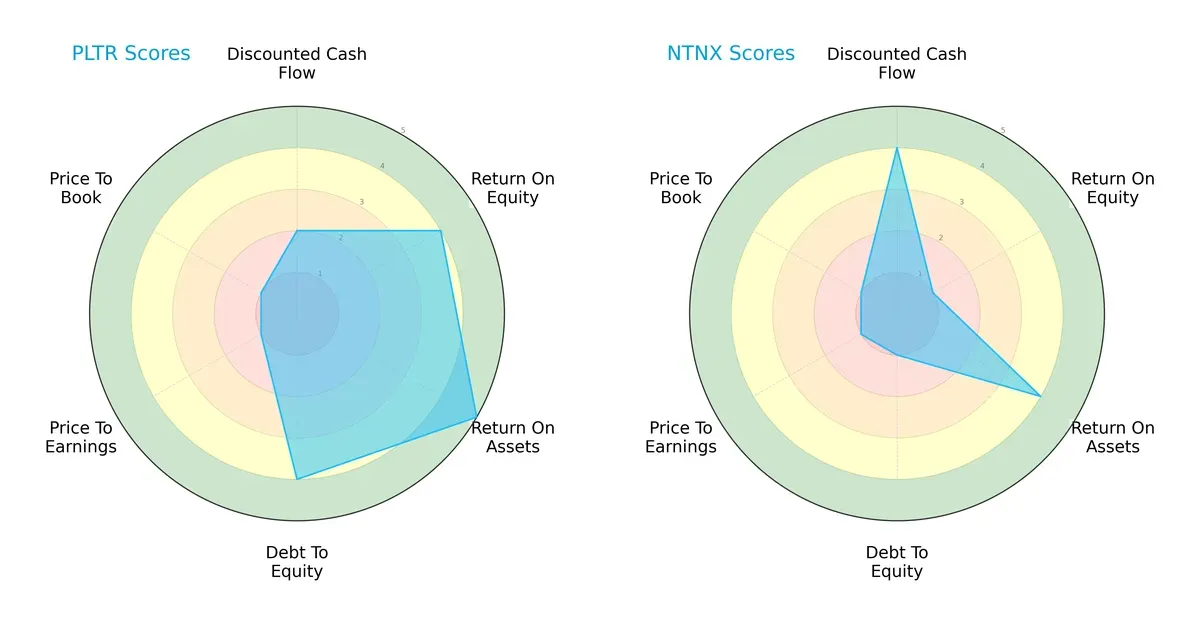
Palantir shows a balanced profile with favorable ROE (4) and ROA (5) scores and solid debt management (4). Its valuation metrics (PE and PB scores at 1) suggest overvaluation risks. Nutanix relies heavily on discounted cash flow strength (4) but struggles with profitability (ROE 1) and high leverage risk (debt/equity 1). Palantir’s diversified strengths trump Nutanix’s uneven edge.
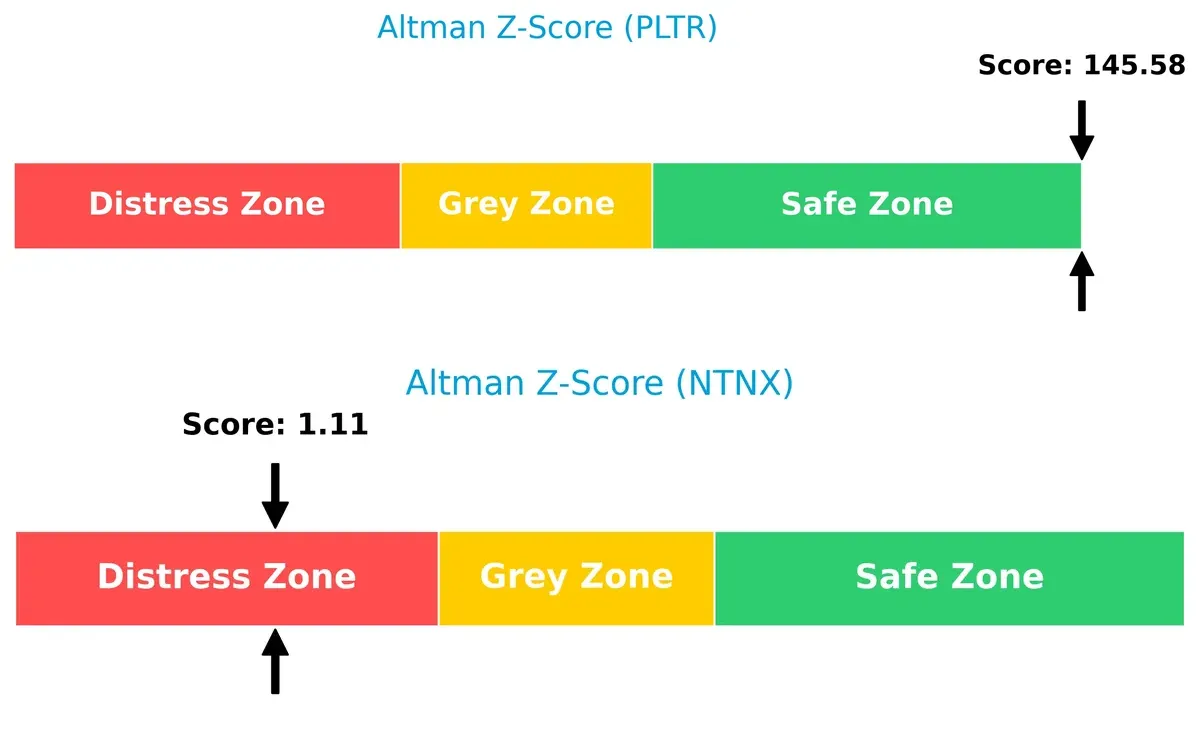
Bankruptcy Risk: Solvency Showdown
Palantir’s Altman Z-Score of 145.6 firmly places it in the safe zone, while Nutanix’s 1.1 signals distress. This stark difference implies Palantir’s superior long-term survival prospects in this cycle:
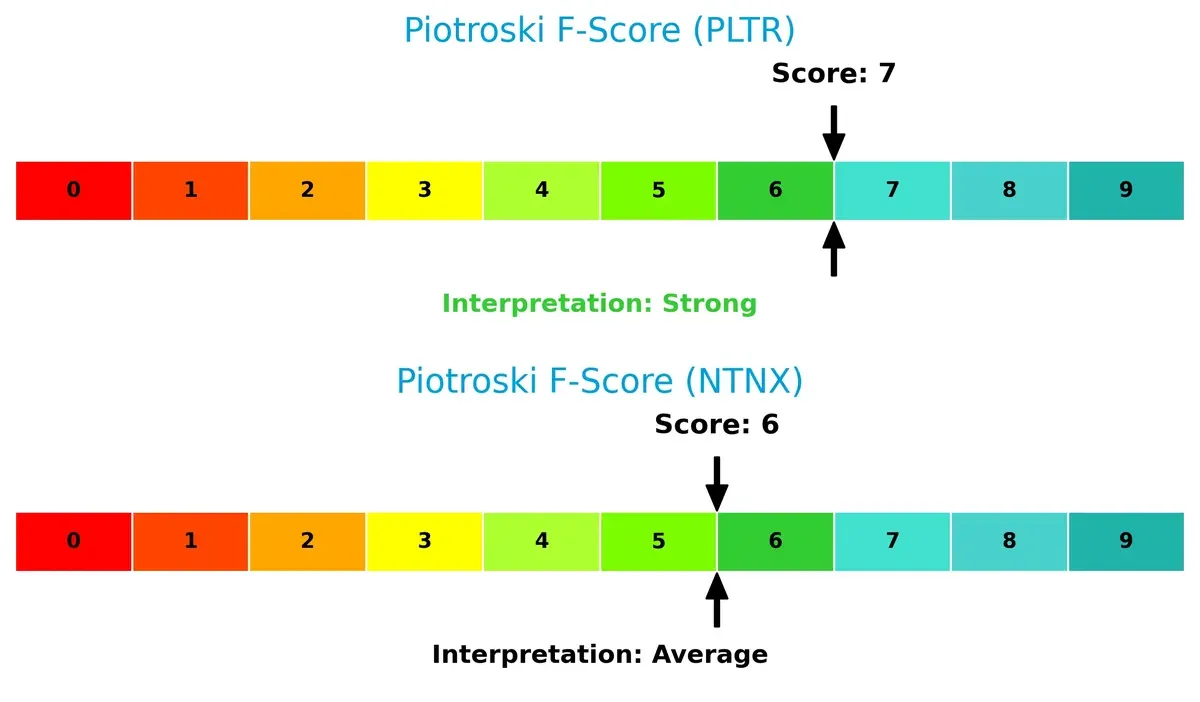
Financial Health: Quality of Operations
Palantir scores 7 on the Piotroski F-Score, indicating strong financial health, whereas Nutanix’s 6 is average. Palantir displays fewer red flags in operational quality and balance sheet strength:
How are the two companies positioned?
This section dissects the operational DNA of Palantir and Nutanix by comparing their revenue distribution and internal strengths and weaknesses. The goal is to confront their economic moats to reveal which model offers the most resilient competitive advantage today.
Revenue Segmentation: The Strategic Mix
This visual comparison dissects how Palantir Technologies and Nutanix diversify their income streams and where their primary sector bets lie:
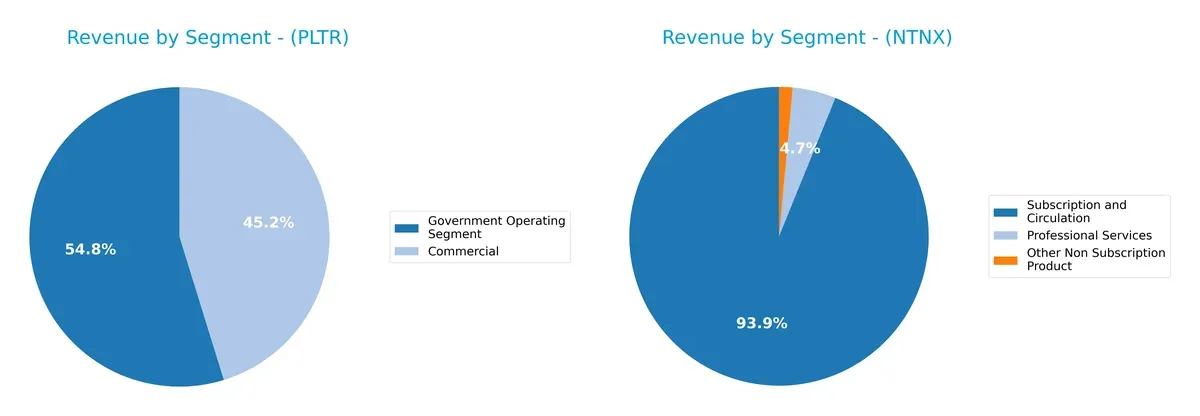
Palantir leans heavily on Government Operating Segment, generating $1.57B in 2024, overshadowing its $1.3B commercial revenue. Nutanix shows a broader mix, with $2.02B from Subscription and Circulation, plus $101M in Professional Services and $31M in Other Non-Subscription Products. Palantir’s focus anchors on government contracts, exposing it to concentration risk. Nutanix’s diversified streams support resilience and ecosystem expansion.
Strengths and Weaknesses Comparison
This table compares the Strengths and Weaknesses of Palantir Technologies Inc. and Nutanix, Inc.:
Palantir Strengths
- Strong government segment revenue of 1.57B USD
- High quick ratio of 5.96 indicates liquidity
- Low debt-to-assets at 3.77% reduces financial risk
- Favorable net margin at 16.13% suggests profitability
- High fixed asset turnover of 11.92 shows efficient asset use
Nutanix Strengths
- Balanced revenue streams with 2.02B USD subscription sales
- Favorable debt-equity ratio and interest coverage ratio
- WACC at 5.81% supports reasonable capital costs
- Quick and current ratios at 1.72 show adequate liquidity
- Favorable fixed asset turnover of 9.15 indicates operational efficiency
Palantir Weaknesses
- Unfavorable price-to-earnings (368.2) and price-to-book (34.01) ratios
- Unfavorable return on equity at 9.24%
- High current ratio flagged as unfavorable, possibly excessive assets
- Low asset turnover at 0.45 suggests underutilized assets
- Zero dividend yield limits income for investors
Nutanix Weaknesses
- Negative return on equity at -27.12% signals poor profitability
- Unfavorable P/E ratio at 106.74 despite some valuation strengths
- Debt-to-assets at 45.16% is neutral, indicating higher leverage risk
- Neutral asset turnover at 0.77 hints at average asset efficiency
- Zero dividend yield offers no dividend income
Both companies show distinct financial profiles. Palantir excels in profitability and conservative leverage but struggles with valuation and asset utilization. Nutanix displays better capital structure management and operational efficiency but suffers from poor equity returns and elevated leverage. These differences shape their strategic financial priorities.
The Moat Duel: Analyzing Competitive Defensibility
A structural moat is the only true barrier shielding long-term profits from relentless competition erosion in tech infrastructure:
Palantir Technologies Inc.: Data Integration & AI-Driven Insights Moat
Palantir leverages intangible assets and advanced AI platforms, reflected in a soaring 36% net margin and 190% revenue growth since 2021. Expansion in AI-powered analytics deepens its moat in 2026.
Nutanix, Inc.: Hybrid Cloud Platform Lock-in
Nutanix’s cost advantage and platform integration create switching costs, evidenced by its positive ROIC vs. WACC and growing profitability. Its hybrid cloud orchestration positions it well for global market expansion in 2026.
Data-Driven AI vs. Platform Lock-in: The Moat Showdown
Palantir’s intangible asset moat drives superior margins and explosive growth, but Nutanix’s proven value creation and platform lock-in present a wider moat. I see Nutanix better equipped to defend market share amid rising cloud competition.
Which stock offers better returns?
Over the past year, Palantir Technologies’ stock soared markedly, while Nutanix’s price declined significantly, reflecting contrasting market dynamics and investor sentiment.
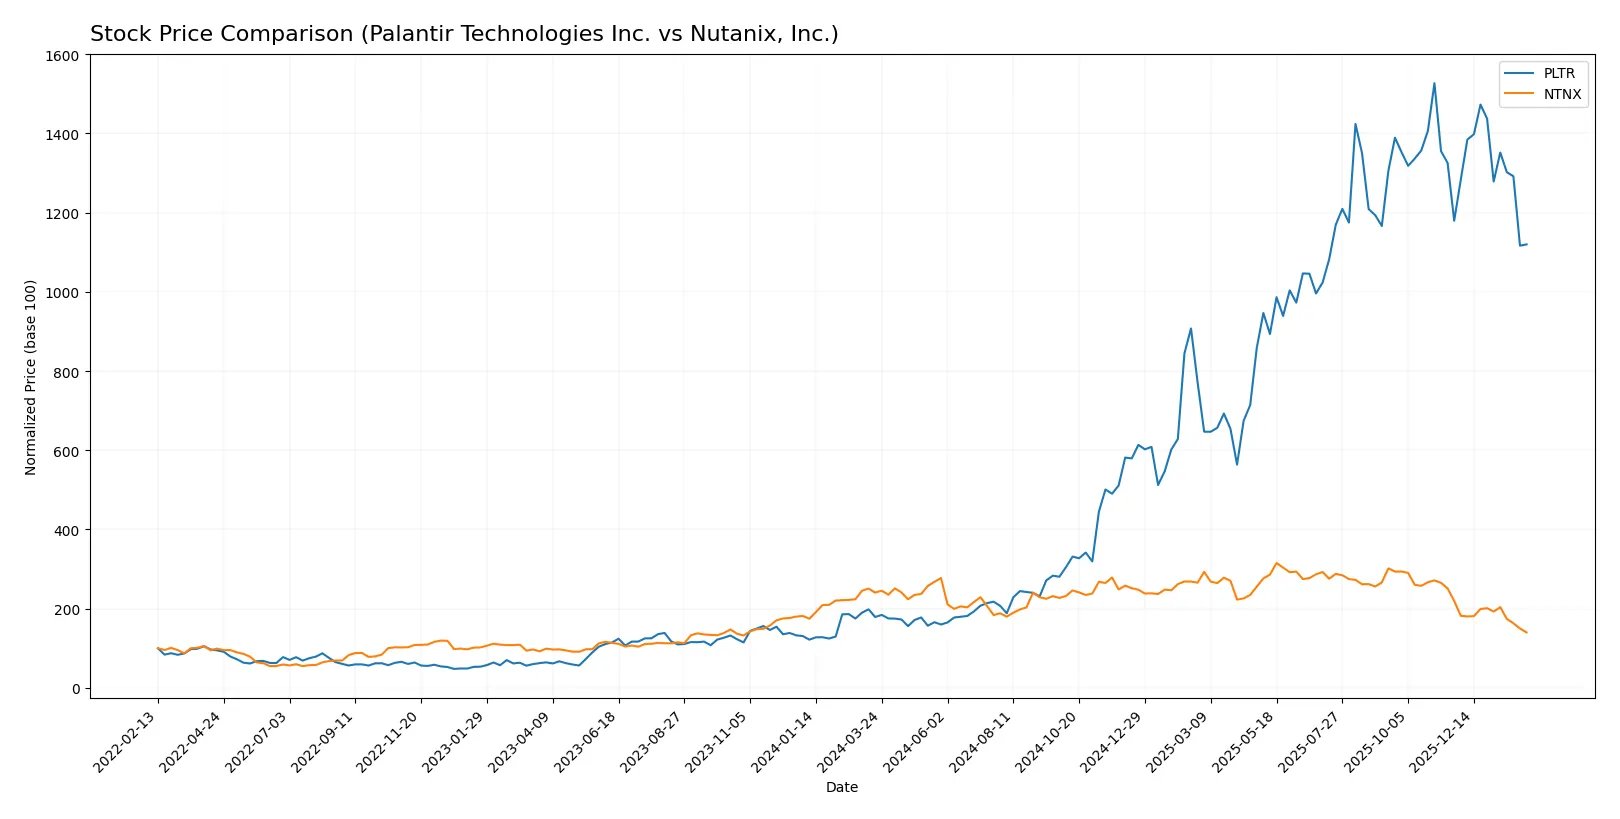
Trend Comparison
Palantir Technologies’ stock rose 526% over the last 12 months, marking a strong bullish trend despite recent deceleration and a 5% dip in the final quarter.
Nutanix’s shares dropped 42% over the same period, confirming a bearish trend with ongoing deceleration and a sharp 36% decline recently, indicating sustained selling pressure.
Palantir outperformed Nutanix decisively, delivering the highest market returns and demonstrating more robust investor demand throughout the year.
Target Prices
Analysts present a moderately bullish consensus for both Palantir Technologies Inc. and Nutanix, Inc.
| Company | Target Low | Target High | Consensus |
|---|---|---|---|
| Palantir Technologies Inc. | 180 | 230 | 198.8 |
| Nutanix, Inc. | 53 | 90 | 64.67 |
The target consensus for Palantir is roughly 37% above the current price of $145, signaling optimism. Nutanix’s consensus implies an 77% upside from its $36.65 price, reflecting strong growth expectations.

Don’t Let Luck Decide Your Entry Point
Optimize your entry points with our advanced ProRealTime indicators. You’ll get efficient buy signals with precise price targets for maximum performance. Start outperforming now!
How do institutions grade them?
Palantir Technologies Inc. Grades
The following table summarizes recent grades and actions by key analysts for Palantir Technologies Inc.:
| Grading Company | Action | New Grade | Date |
|---|---|---|---|
| UBS | Maintain | Neutral | 2026-02-03 |
| DA Davidson | Maintain | Neutral | 2026-02-03 |
| Citigroup | Maintain | Buy | 2026-02-03 |
| Citigroup | Upgrade | Buy | 2026-01-12 |
| Morgan Stanley | Maintain | Equal Weight | 2025-11-04 |
| DA Davidson | Maintain | Neutral | 2025-11-04 |
| Piper Sandler | Maintain | Overweight | 2025-11-04 |
| Cantor Fitzgerald | Maintain | Neutral | 2025-11-04 |
| Baird | Maintain | Neutral | 2025-11-04 |
| B of A Securities | Maintain | Buy | 2025-11-04 |
Nutanix, Inc. Grades
The table below presents recent analyst grades and rating changes for Nutanix, Inc.:
| Grading Company | Action | New Grade | Date |
|---|---|---|---|
| Barclays | Downgrade | Equal Weight | 2026-01-15 |
| Morgan Stanley | Downgrade | Equal Weight | 2026-01-12 |
| RBC Capital | Maintain | Outperform | 2026-01-05 |
| Goldman Sachs | Maintain | Buy | 2025-11-28 |
| B of A Securities | Maintain | Buy | 2025-11-26 |
| Keybanc | Maintain | Overweight | 2025-11-26 |
| Needham | Maintain | Buy | 2025-11-26 |
| Wells Fargo | Maintain | Equal Weight | 2025-11-26 |
| Morgan Stanley | Maintain | Overweight | 2025-11-26 |
| Piper Sandler | Maintain | Overweight | 2025-11-26 |
Which company has the best grades?
Palantir holds a balanced mix of Neutral and Buy ratings, with recent upgrades from Citigroup. Nutanix shows more varied grades, including recent downgrades to Equal Weight. Palantir’s consistent Buy and Overweight ratings suggest stronger analyst conviction, potentially influencing investor confidence more positively.
Risks specific to each company
The following categories identify critical pressure points and systemic threats facing Palantir Technologies Inc. and Nutanix, Inc. in the 2026 market environment:
1. Market & Competition
Palantir Technologies Inc.
- Faces intense competition in software infrastructure with a high P/E ratio indicating growth expectations but valuation risk.
Nutanix, Inc.
- Operates in a competitive cloud platform market with a lower beta, suggesting less sensitivity to market swings.
2. Capital Structure & Debt
Palantir Technologies Inc.
- Maintains a very low debt-to-equity ratio (0.05), signaling conservative leverage and strong balance sheet.
Nutanix, Inc.
- Exhibits negative debt-to-equity ratio and higher debt-to-assets (45%), indicating complex financing and moderate leverage risk.
3. Stock Volatility
Palantir Technologies Inc.
- Beta of 1.687 shows high stock volatility, exposing investors to greater market risk.
Nutanix, Inc.
- Beta of 0.479 implies lower volatility and potentially steadier stock performance.
4. Regulatory & Legal
Palantir Technologies Inc.
- Operates heavily in intelligence and government sectors, increasing exposure to regulatory scrutiny and compliance risks.
Nutanix, Inc.
- Faces standard technology sector regulations but less direct government dependency, lowering regulatory risk.
5. Supply Chain & Operations
Palantir Technologies Inc.
- Software deployment is largely virtual, reducing traditional supply chain risks but reliant on cloud infrastructure stability.
Nutanix, Inc.
- Depends on hybrid cloud and data centers; operational complexity may introduce supply chain vulnerabilities.
6. ESG & Climate Transition
Palantir Technologies Inc.
- Limited disclosure on ESG initiatives; risks arise from increasing investor and regulatory focus on sustainability.
Nutanix, Inc.
- More established global footprint demands stronger ESG compliance; transition risks could impact costs.
7. Geopolitical Exposure
Palantir Technologies Inc.
- Significant international intelligence contracts expose it to geopolitical tensions and export controls.
Nutanix, Inc.
- Global operations face geopolitical risks but less sensitive to national security concerns.
Which company shows a better risk-adjusted profile?
Palantir’s most impactful risk is its high market volatility and dependency on government contracts, which could amplify revenue swings and regulatory hurdles. Nutanix struggles with financial distress signals, highlighted by its Altman Z-score in the distress zone and negative debt metrics, increasing bankruptcy risk. Despite Nutanix’s lower stock volatility, Palantir’s robust balance sheet and strong Altman Z-score place it in a safer financial position. The recent data reveal Nutanix’s financial fragility as a critical concern, making Palantir the better risk-adjusted choice in 2026.
Final Verdict: Which stock to choose?
Palantir Technologies Inc. stands out as a cash-generating powerhouse with a rapidly growing return on invested capital. Its ability to convert revenue into profit at scale is impressive. However, its sky-high valuation ratios signal a point of vigilance. Palantir suits investors chasing aggressive growth and willing to pay a premium for future potential.
Nutanix, Inc. boasts a solid strategic moat grounded in efficient capital use and a sustainable ROIC above its cost of capital. It offers a more balanced risk profile with healthier liquidity metrics compared to Palantir. Nutanix fits well in a GARP portfolio seeking steady growth with a margin of safety.
If you prioritize high-growth momentum and are comfortable with valuation risks, Palantir presents a compelling scenario due to its superior income growth and cash flow generation. However, if you seek better stability and a proven economic moat with moderate valuation, Nutanix offers a stronger safety cushion despite a more subdued price trend.
Disclaimer: Investment carries a risk of loss of initial capital. The past performance is not a reliable indicator of future results. Be sure to understand risks before making an investment decision.
Go Further
I encourage you to read the complete analyses of Palantir Technologies Inc. and Nutanix, Inc. to enhance your investment decisions: