Oracle Corporation and Nutanix, Inc. are two prominent players in the software infrastructure industry, each shaping enterprise cloud solutions with distinct innovation strategies. Oracle, a longstanding giant, combines extensive cloud software and hardware offerings, while Nutanix focuses on hyper-converged infrastructure and hybrid cloud management. Their market overlap and technological advancements make this comparison essential. Let’s explore which company presents the most compelling opportunity for your investment portfolio.
Table of contents
Companies Overview
I will begin the comparison between Oracle Corporation and Nutanix, Inc. by providing an overview of these two companies and their main differences.
Oracle Overview
Oracle Corporation operates globally in enterprise IT environments, focusing on cloud software applications such as ERP, performance management, and supply chain solutions. It also offers cloud infrastructure products, databases, middleware, and hardware systems. Founded in 1977 and headquartered in Austin, Texas, Oracle is a major player in software infrastructure with a market cap of 549B USD and employs 159K people.
Nutanix Overview
Nutanix, Inc. delivers an enterprise cloud platform with products in virtualization, storage, security, and hybrid cloud management. It offers automation tools for cloud-native environments and database services targeted at multiple industries worldwide. Incorporated in 2009 and based in San Jose, California, Nutanix has a market cap of 12.4B USD and employs around 7.2K people.
Key similarities and differences
Both Oracle and Nutanix operate in the software infrastructure sector, providing cloud and virtualization solutions. Oracle’s business is broader, including cloud applications, infrastructure, middleware, and hardware, with a significantly larger scale and workforce. Nutanix focuses on cloud platform services and hybrid cloud orchestration, catering to a diverse range of industries but at a smaller scale and market capitalization.
Income Statement Comparison
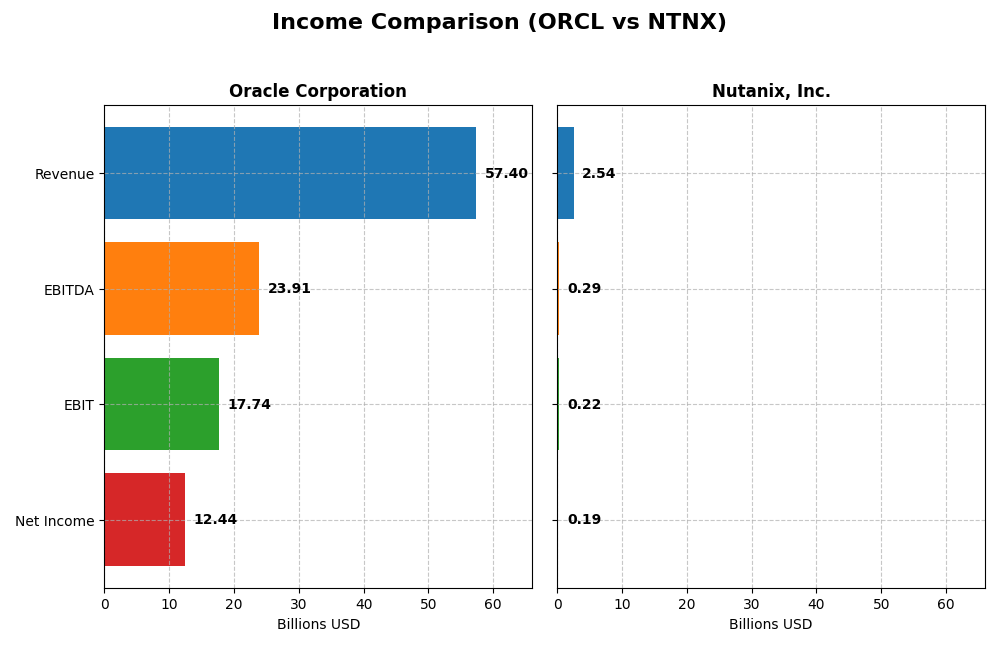
The table below compares key income statement metrics for Oracle Corporation and Nutanix, Inc. for the most recent fiscal year available, illustrating their financial performance side by side.
| Metric | Oracle Corporation | Nutanix, Inc. |
|---|---|---|
| Market Cap | 549B | 12.4B |
| Revenue | 57.4B | 2.54B |
| EBITDA | 23.9B | 293M |
| EBIT | 17.7B | 220M |
| Net Income | 12.4B | 188M |
| EPS | 4.46 | 0.70 |
| Fiscal Year | 2025 | 2025 |
Income Statement Interpretations
Oracle Corporation
Oracle’s revenue steadily increased from $40.5B in 2021 to $57.4B in 2025, reflecting an overall growth trend. Net income showed variability, peaking in 2021 at $13.7B and declining to $12.4B in 2025. Margins remained largely favorable, with a gross margin above 70% and net margin near 22%. The 2025 fiscal year saw solid revenue and EBIT growth, signaling improved profitability despite some margin contraction over the long term.
Nutanix, Inc.
Nutanix experienced strong revenue growth from $1.39B in 2021 to $2.54B in 2025, accompanied by a turnaround from a net loss of $1.03B to a net income of $188M. Gross margin remained high near 87%, while EBIT margin improved to 8.7%, reflecting better operational efficiency. The most recent year showed significant margin and EPS gains, highlighting a positive trajectory in profitability and sustained growth momentum.
Which one has the stronger fundamentals?
Oracle exhibits consistent revenue growth with strong gross and EBIT margins, though its net income and margin have seen some long-term decline. Nutanix shows more rapid revenue and profitability improvements, transforming losses into positive net income with favorable margins. Overall, Nutanix’s fundamentals reflect a robust growth and margin expansion profile, while Oracle maintains strength in scale and margin stability.
Financial Ratios Comparison
The table below presents the most recent fiscal year-end financial ratios for Oracle Corporation and Nutanix, Inc., providing a side-by-side comparison of key performance and liquidity metrics.
| Ratios | Oracle Corporation (2025) | Nutanix, Inc. (2025) |
|---|---|---|
| ROE | 60.8% | -27.1% |
| ROIC | 10.9% | 8.1% |
| P/E | 37.1 | 106.7 |
| P/B | 22.6 | -29.0 |
| Current Ratio | 0.75 | 1.72 |
| Quick Ratio | 0.75 | 1.72 |
| D/E (Debt to Equity) | 5.09 | -2.14 |
| Debt-to-Assets | 61.8% | 45.2% |
| Interest Coverage | 4.94 | 8.75 |
| Asset Turnover | 0.34 | 0.77 |
| Fixed Asset Turnover | 1.32 | 9.15 |
| Payout ratio | 38.1% | 0% |
| Dividend yield | 1.03% | 0% |
Interpretation of the Ratios
Oracle Corporation
Oracle shows strong profitability with a favorable 21.68% net margin, 60.84% return on equity, and 10.86% return on invested capital. However, liquidity ratios are weak, with a current ratio of 0.75 and high debt levels (debt-to-assets 61.83%). The company pays dividends with a 1.03% yield, supported by stable payouts but risks stem from elevated leverage and valuation multiples.
Nutanix, Inc.
Nutanix displays mixed ratios: moderate net margin (7.42%) and return on invested capital (8.11%) are neutral, while return on equity is unfavorable at -27.12%. Liquidity is strong with a current ratio of 1.72. It does not pay dividends, reflecting its growth phase and reinvestment strategy. Favorable debt and coverage ratios suggest manageable financial risk despite high valuation.
Which one has the best ratios?
Nutanix has a slightly favorable overall ratio profile, balancing solid liquidity and manageable debt against weak profitability. Oracle’s profitability is superior, but its high leverage and weak liquidity raise concerns, leading to an unfavorable global assessment. Thus, Nutanix holds an edge in financial ratio favorability based on the 2025 data.
Strategic Positioning
This section compares the strategic positioning of Oracle Corporation and Nutanix, Inc., focusing on market position, key segments, and exposure to technological disruption:
Oracle Corporation
- Large market cap of 549B with significant competitive pressure in software infrastructure.
- Diverse revenue streams: cloud and license (49.2B), hardware (2.9B), and services (5.2B).
- Exposure includes autonomous databases, cloud computing, IoT, blockchain, and middleware technologies.
Nutanix, Inc.
- Smaller market cap of 12.4B, competing in enterprise cloud platforms.
- Focused on cloud platform subscriptions (2.0B) and professional services (101M).
- Exposure centers on hybrid cloud orchestration, virtualization, Kubernetes, and cloud governance.
Oracle Corporation vs Nutanix, Inc. Positioning
Oracle presents a diversified business model with multiple revenue streams across cloud, hardware, and services, offering broad market coverage. Nutanix concentrates on enterprise cloud platforms and hybrid cloud management, reflecting a more focused but narrower approach.
Which has the best competitive advantage?
Nutanix shows a very favorable MOAT with growing ROIC and clear value creation, indicating a durable competitive advantage. Oracle’s slightly unfavorable MOAT with declining ROIC suggests challenges in sustaining profitability and competitive edge.
Stock Comparison
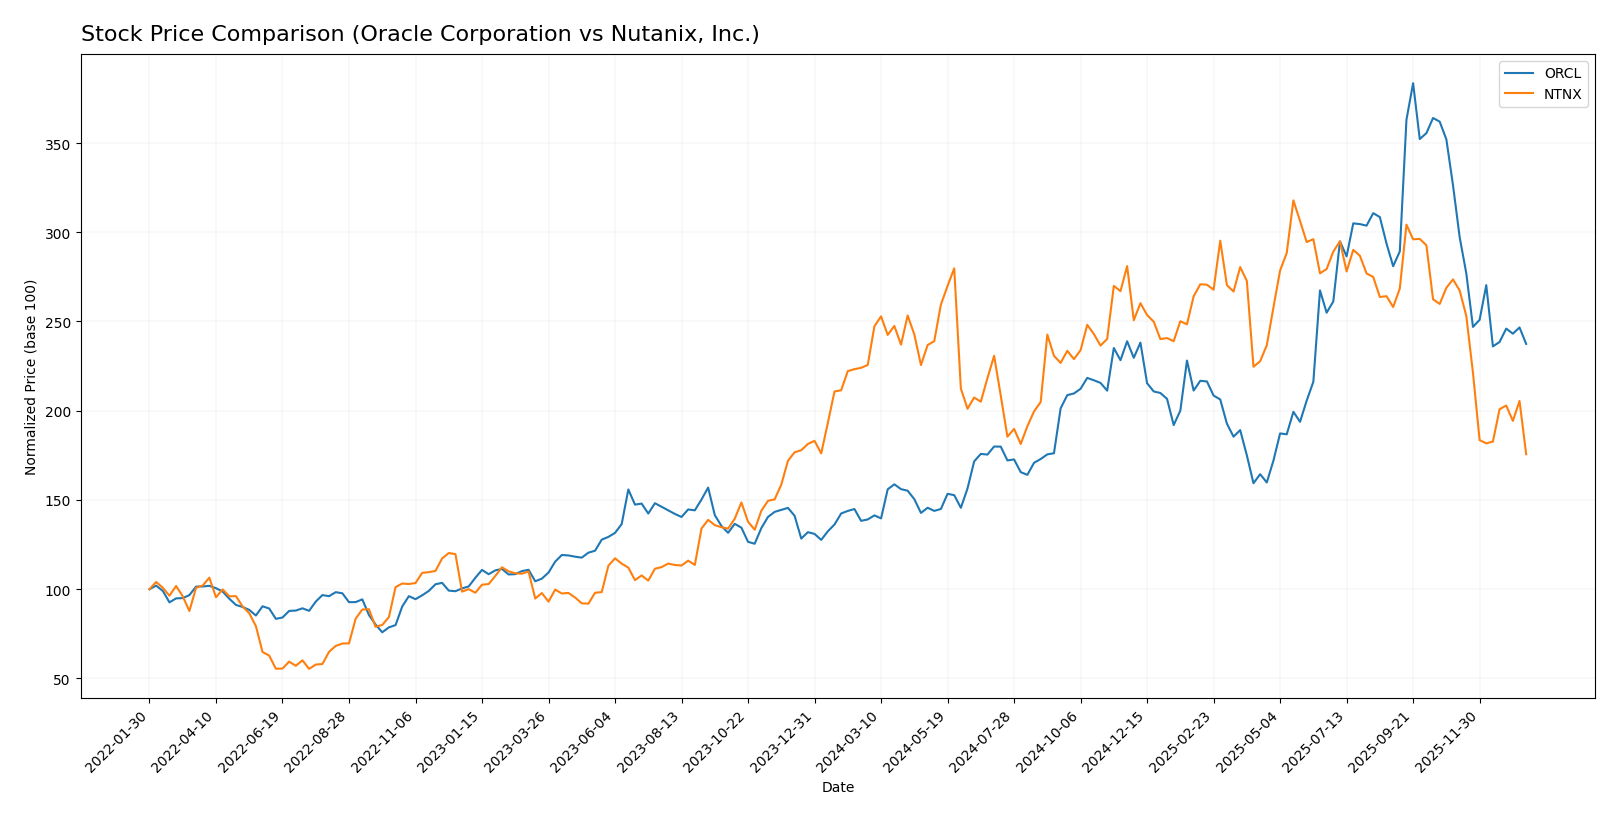
The stock price dynamics over the past 12 months reveal a significant bullish trend for Oracle Corporation, contrasted by a bearish trend for Nutanix, Inc., with recent periods showing increased selling pressure for both.
Trend Analysis
Oracle Corporation’s stock showed a strong bullish trend with a 70.69% increase over the past year, though the trend shows deceleration. The price ranged between 111.95 and 308.66, with high volatility at 49.0 std deviation.
Nutanix, Inc. experienced a bearish trend, declining 22.16% over the same period with deceleration. Its price fluctuated between 45.74 and 82.77, exhibiting moderate volatility with an 8.67 std deviation.
Comparing both stocks, Oracle delivered the highest market performance with a notable positive return, while Nutanix showed a consistent negative trend throughout the year.
Target Prices
The current analyst target price consensus suggests moderate to strong upside potential for both Oracle Corporation and Nutanix, Inc.
| Company | Target High | Target Low | Consensus |
|---|---|---|---|
| Oracle Corporation | 400 | 175 | 314.08 |
| Nutanix, Inc. | 90 | 53 | 64.67 |
Oracle’s consensus target of 314.08 USD is significantly above its current price of 191.09 USD, indicating positive analyst expectations. Nutanix’s target consensus of 64.67 USD also suggests potential upside compared to its current price of 45.74 USD.
Analyst Opinions Comparison
This section compares analysts’ ratings and grades for Oracle Corporation and Nutanix, Inc.:
Rating Comparison
Oracle Corporation Rating
- Rating: B, classified as Very Favorable
- Discounted Cash Flow Score: 3, Moderate
- ROE Score: 5, Very Favorable
- ROA Score: 4, Favorable
- Debt To Equity Score: 1, Very Unfavorable
- Overall Score: 3, Moderate
Nutanix, Inc. Rating
- Rating: C+, classified as Very Favorable
- Discounted Cash Flow Score: 4, Favorable
- ROE Score: 1, Very Unfavorable
- ROA Score: 4, Favorable
- Debt To Equity Score: 1, Very Unfavorable
- Overall Score: 2, Moderate
Which one is the best rated?
Oracle Corporation holds a better overall rating (B vs. C+) and outperforms Nutanix notably in ROE, while both share similar challenges in debt levels. Oracle’s scores indicate a stronger financial standing based on the provided data.
Scores Comparison
Here is a comparison of the Altman Z-Score and Piotroski Score for Oracle Corporation and Nutanix, Inc.:
ORCL Scores
- Altman Z-Score: 2.43, indicating a grey zone risk level
- Piotroski Score: 5, categorized as average financial strength
NTNX Scores
- Altman Z-Score: 1.48, indicating distress zone risk level
- Piotroski Score: 6, categorized as average financial strength
Which company has the best scores?
Based strictly on the provided data, Oracle has a higher Altman Z-Score, placing it in a grey zone versus Nutanix’s distress zone, while Nutanix has a slightly better Piotroski Score. Overall, the scores reflect differing risk and financial strength profiles.
Grades Comparison
Here is a detailed comparison of the recent grades for Oracle Corporation and Nutanix, Inc.:
Oracle Corporation Grades
The table below summarizes recent grading actions from reputable financial institutions for Oracle Corporation:
| Grading Company | Action | New Grade | Date |
|---|---|---|---|
| UBS | Maintain | Buy | 2026-01-05 |
| RBC Capital | Maintain | Sector Perform | 2026-01-05 |
| Jefferies | Maintain | Buy | 2026-01-05 |
| Goldman Sachs | Maintain | Neutral | 2025-12-12 |
| Keybanc | Maintain | Overweight | 2025-12-11 |
| UBS | Maintain | Buy | 2025-12-11 |
| Citigroup | Maintain | Buy | 2025-12-11 |
| JP Morgan | Maintain | Neutral | 2025-12-11 |
| DA Davidson | Maintain | Neutral | 2025-12-11 |
| Scotiabank | Maintain | Sector Outperform | 2025-12-11 |
Oracle’s grades show a consistent pattern of Buy and Neutral ratings, with several institutions maintaining positive outlooks such as Buy and Overweight, indicating stable confidence.
Nutanix, Inc. Grades
The table below lists recent grades and rating changes for Nutanix, Inc.:
| Grading Company | Action | New Grade | Date |
|---|---|---|---|
| Barclays | Downgrade | Equal Weight | 2026-01-15 |
| Morgan Stanley | Downgrade | Equal Weight | 2026-01-12 |
| RBC Capital | Maintain | Outperform | 2026-01-05 |
| Goldman Sachs | Maintain | Buy | 2025-11-28 |
| JP Morgan | Maintain | Overweight | 2025-11-26 |
| Needham | Maintain | Buy | 2025-11-26 |
| Wells Fargo | Maintain | Equal Weight | 2025-11-26 |
| Morgan Stanley | Maintain | Overweight | 2025-11-26 |
| Keybanc | Maintain | Overweight | 2025-11-26 |
| Piper Sandler | Maintain | Overweight | 2025-11-26 |
Nutanix exhibits a mix of ratings including Buy and Overweight, but recent downgrades to Equal Weight by Barclays and Morgan Stanley suggest some caution among analysts.
Which company has the best grades?
Oracle Corporation holds a stronger consensus with numerous Buy and Neutral ratings and no recent downgrades, reflecting steadier analyst confidence. Nutanix, while also showing positive ratings, has experienced recent downgrades, which may signal increased uncertainty for investors.
Strengths and Weaknesses
Below is a comparison of key strengths and weaknesses for Oracle Corporation (ORCL) and Nutanix, Inc. (NTNX) based on recent financial and operational data:
| Criterion | Oracle Corporation (ORCL) | Nutanix, Inc. (NTNX) |
|---|---|---|
| Diversification | Highly diversified with Cloud & License (49.2B), Services (5.2B), and Hardware (2.9B) segments | Moderate diversification: Subscription & Circulation (2.0B), Services (~100M), and Products (~31M) |
| Profitability | Strong profitability: Net margin 21.7%, ROIC 10.9%, ROE 60.8% | Lower profitability: Net margin 7.4%, ROIC 8.1%, negative ROE -27.1% |
| Innovation | Established product suite with steady cloud growth but declining ROIC trend | Growing ROIC (+117%), showing innovation and improving profitability |
| Global presence | Extensive global reach as a mature tech giant | Growing global presence but smaller scale than Oracle |
| Market Share | Large market share in database and enterprise software | Smaller market share but expanding in cloud infrastructure |
Key takeaways: Oracle offers strong profitability and diversification but faces a declining ROIC trend, indicating challenges in sustaining growth. Nutanix shows promising innovation and improving value creation with a growing ROIC, though profitability remains modest. Investors should weigh Oracle’s stability against Nutanix’s growth potential while managing risk carefully.
Risk Analysis
Below is a comparative table summarizing key risks for Oracle Corporation and Nutanix, Inc. as of 2025, to aid investors in understanding their risk profiles.
| Metric | Oracle Corporation (ORCL) | Nutanix, Inc. (NTNX) |
|---|---|---|
| Market Risk | High beta (1.65) indicates higher market volatility exposure | Low beta (0.49) suggests lower market sensitivity |
| Debt level | High debt-to-equity ratio (5.09) and debt-to-assets (61.83%) pose leverage risks | Negative debt-to-equity (-2.14) suggests net cash position, moderate leverage (45.16% debt-to-assets) |
| Regulatory Risk | Moderate; operates globally in complex IT and cloud sectors | Moderate; cloud infrastructure sector with evolving regulations |
| Operational Risk | Large scale operations with 159K employees; risks in integration and innovation | Smaller scale (7.15K employees); risks in scaling and technology adoption |
| Environmental Risk | Moderate; hardware manufacturing and data centers contribute to footprint | Moderate; primarily software/cloud services with lower direct environmental impact |
| Geopolitical Risk | Exposure due to global presence and supply chains | Exposure in multiple international markets, but smaller scale |
In synthesis, Oracle faces significant market and financial leverage risks, with a beta of 1.65 and a high debt burden, raising caution for risk-averse investors. Nutanix shows lower market risk and better liquidity but struggles with profitability and a distress-level Altman Z-score, indicating a higher bankruptcy risk. The most impactful risks lie in Oracle’s financial leverage and Nutanix’s financial distress status, warranting close monitoring.
Which Stock to Choose?
Oracle Corporation (ORCL) shows a generally favorable income evolution with strong revenue growth and profitability, but its financial ratios reveal several unfavorable aspects including high debt levels and low liquidity. The company holds a very favorable overall rating of B, despite a slightly unfavorable moat due to declining ROIC versus WACC.
Nutanix, Inc. (NTNX) presents a favorable income statement growth with strong improvements over the period and a very favorable moat reflecting increasing profitability. Its financial ratios are slightly favorable overall, benefiting from strong liquidity and lower financial risk, though some profitability ratios are less positive. The company’s rating is also very favorable at C+.
Investors focused on stable profitability and established earnings might find Oracle’s profile indicative of consistent income but with financial risks related to debt. Those prioritizing growth and improving competitive advantage may see Nutanix’s expanding income and strong moat as a positive sign. The choice could therefore depend on whether an investor prefers established scale or growth potential combined with improving returns.
Disclaimer: Investment carries a risk of loss of initial capital. The past performance is not a reliable indicator of future results. Be sure to understand risks before making an investment decision.
Go Further
I encourage you to read the complete analyses of Oracle Corporation and Nutanix, Inc. to enhance your investment decisions: