In today’s fast-evolving tech landscape, choosing the right software infrastructure company can significantly impact your investment portfolio. Okta, Inc. and Nutanix, Inc. both operate in the software infrastructure sector, offering innovative cloud-based solutions that address enterprise security and cloud management needs. Their market overlap and distinct innovation strategies make them natural competitors. This article will help you decide which company presents the most compelling opportunity for your investment wallet.
Table of contents
Companies Overview
I will begin the comparison between Okta and Nutanix by providing an overview of these two companies and their main differences.
Okta Overview
Okta, Inc. specializes in identity solutions for enterprises, SMBs, universities, non-profits, and government agencies globally. Its Okta Identity Cloud platform includes products like Single Sign-On, Adaptive Multi-Factor Authentication, and Lifecycle Management designed to secure user access across cloud and on-premise applications. Founded in 2009 and headquartered in San Francisco, Okta is a key player in the software infrastructure industry with a market cap of $15.2B.
Nutanix Overview
Nutanix, Inc. offers an enterprise cloud platform providing virtualization, storage, networking, and automation services worldwide. Its solutions include Acropolis virtualization, Kubernetes management, database automation, and desktop-as-a-service products to support hybrid and multi-cloud environments. Established in 2009 and based in San Jose, Nutanix operates in the software infrastructure sector with a market cap of $12.4B.
Key similarities and differences
Both companies focus on software infrastructure and serve enterprise customers globally, emphasizing cloud and virtualization technologies. Okta concentrates on identity and access management, delivering security-focused cloud solutions, while Nutanix provides a broader hybrid cloud platform including virtualization, storage, and application lifecycle management. Okta has a slightly higher market capitalization, whereas Nutanix employs more staff and offers a wider range of cloud infrastructure services.
Income Statement Comparison
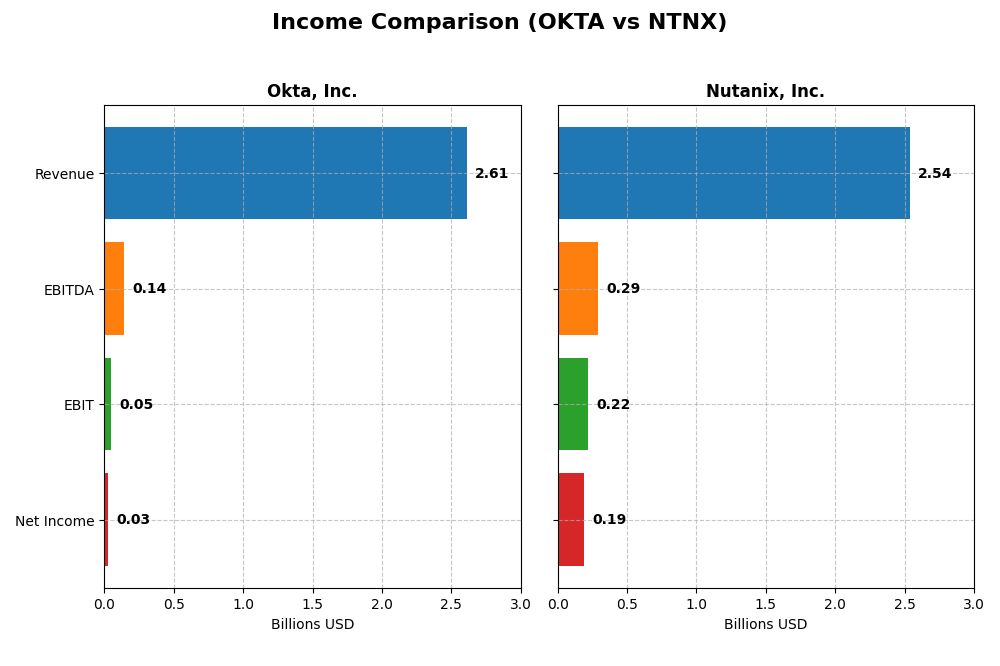
The table below compares the key income statement metrics for Okta, Inc. and Nutanix, Inc. for their most recent fiscal years.
| Metric | Okta, Inc. (OKTA) | Nutanix, Inc. (NTNX) |
|---|---|---|
| Market Cap | 15.2B | 12.4B |
| Revenue | 2.61B | 2.54B |
| EBITDA | 139M | 293M |
| EBIT | 51M | 220M |
| Net Income | 28M | 188M |
| EPS | 0.17 | 0.70 |
| Fiscal Year | 2025 | 2025 |
Income Statement Interpretations
Okta, Inc.
Okta has shown strong revenue growth from 2021 to 2025, increasing from $835M to $2.61B, with net income turning positive in 2025 at $28M after years of losses. Gross margins remained favorable around 76%, while net margins improved to a neutral but positive 1.07% in 2025. The most recent year saw healthy growth in both revenue and net income, with margins stabilizing and EBITDA turning positive.
Nutanix, Inc.
Nutanix’s revenue grew steadily from $1.39B in 2021 to $2.54B in 2025, with net income recovering from a loss of over $1B in 2021 to a positive $188M in 2025. The company maintained strong gross margins near 87%, with net margins improving to a favorable 7.42%. The latest year demonstrated accelerated profitability gains and strong growth in earnings per share, supported by expanding operating margins.
Which one has the stronger fundamentals?
Both companies exhibit favorable income statement trends, with Nutanix showing higher gross and net margins and stronger profitability improvements. Okta’s revenue and net income growth are impressive but margins remain more modest. Nutanix’s superior margin profile and larger net income suggest relatively stronger fundamentals, though both have made significant progress in recent years.
Financial Ratios Comparison
Below is a comparison of key financial ratios for Okta, Inc. and Nutanix, Inc. based on their most recent fiscal year data available in 2025.
| Ratios | Okta, Inc. (OKTA) | Nutanix, Inc. (NTNX) |
|---|---|---|
| ROE | 0.44% | -27.12% |
| ROIC | -0.61% | 8.11% |
| P/E | 570.6 | 106.7 |
| P/B | 2.49 | -28.95 |
| Current Ratio | 1.35 | 1.72 |
| Quick Ratio | 1.35 | 1.72 |
| D/E (Debt-to-Equity) | 0.15 | -2.14 |
| Debt-to-Assets | 10.1% | 45.2% |
| Interest Coverage | -14.8 | 8.75 |
| Asset Turnover | 0.28 | 0.77 |
| Fixed Asset Turnover | 22.31 | 9.15 |
| Payout Ratio | 0 | 0 |
| Dividend Yield | 0% | 0% |
Interpretation of the Ratios
Okta, Inc.
Okta shows mixed financial ratios with nearly equal favorable and unfavorable marks. Its net margin and return on equity are low, indicating weak profitability, while its quick ratio and debt metrics are favorable, suggesting solid liquidity and conservative leverage. The company does not pay dividends, reflecting a reinvestment focus likely due to ongoing growth and R&D priorities.
Nutanix, Inc.
Nutanix exhibits generally stronger liquidity and leverage ratios, with a favorable quick ratio and low debt-to-equity ratio despite a higher debt-to-assets percentage. However, its negative return on equity and a high P/E ratio highlight profitability challenges. Nutanix also does not distribute dividends, consistent with a strategy focused on reinvestment and growth.
Which one has the best ratios?
Nutanix presents a slightly more favorable ratio profile overall, supported by better liquidity and leverage metrics, despite some profitability weaknesses. Okta’s ratios are more balanced between strengths and weaknesses but show more concerns with profitability and valuation. Both companies do not pay dividends, emphasizing growth and reinvestment strategies.
Strategic Positioning
This section compares the strategic positioning of Okta and Nutanix, including market position, key segments, and exposure to technological disruption:
Okta, Inc.
- Leading identity solutions provider with competitive pressure in cloud security markets.
- Focuses on identity cloud services and API security, driving subscription revenues above $2.5B in 2025.
- Positioned in software infrastructure with advanced identity and passwordless authentication technologies.
Nutanix, Inc.
- Enterprise cloud platform provider facing competition in hybrid and multi-cloud environments.
- Offers diverse enterprise cloud products and services, including virtualization and cloud management.
- Invests in hybrid cloud orchestration and automation, integrating Kubernetes and desktop-as-a-service.
Okta vs Nutanix Positioning
Okta’s strategy concentrates on identity and access management with strong subscription growth, while Nutanix pursues a more diversified enterprise cloud platform approach. Okta’s focus offers specialization, whereas Nutanix benefits from broader product and geographic diversity.
Which has the best competitive advantage?
Nutanix shows a very favorable moat with ROIC above WACC and growing profitability, indicating durable competitive advantage. Okta’s moat is slightly unfavorable despite growing ROIC, reflecting current value destruction but improving profitability.
Stock Comparison
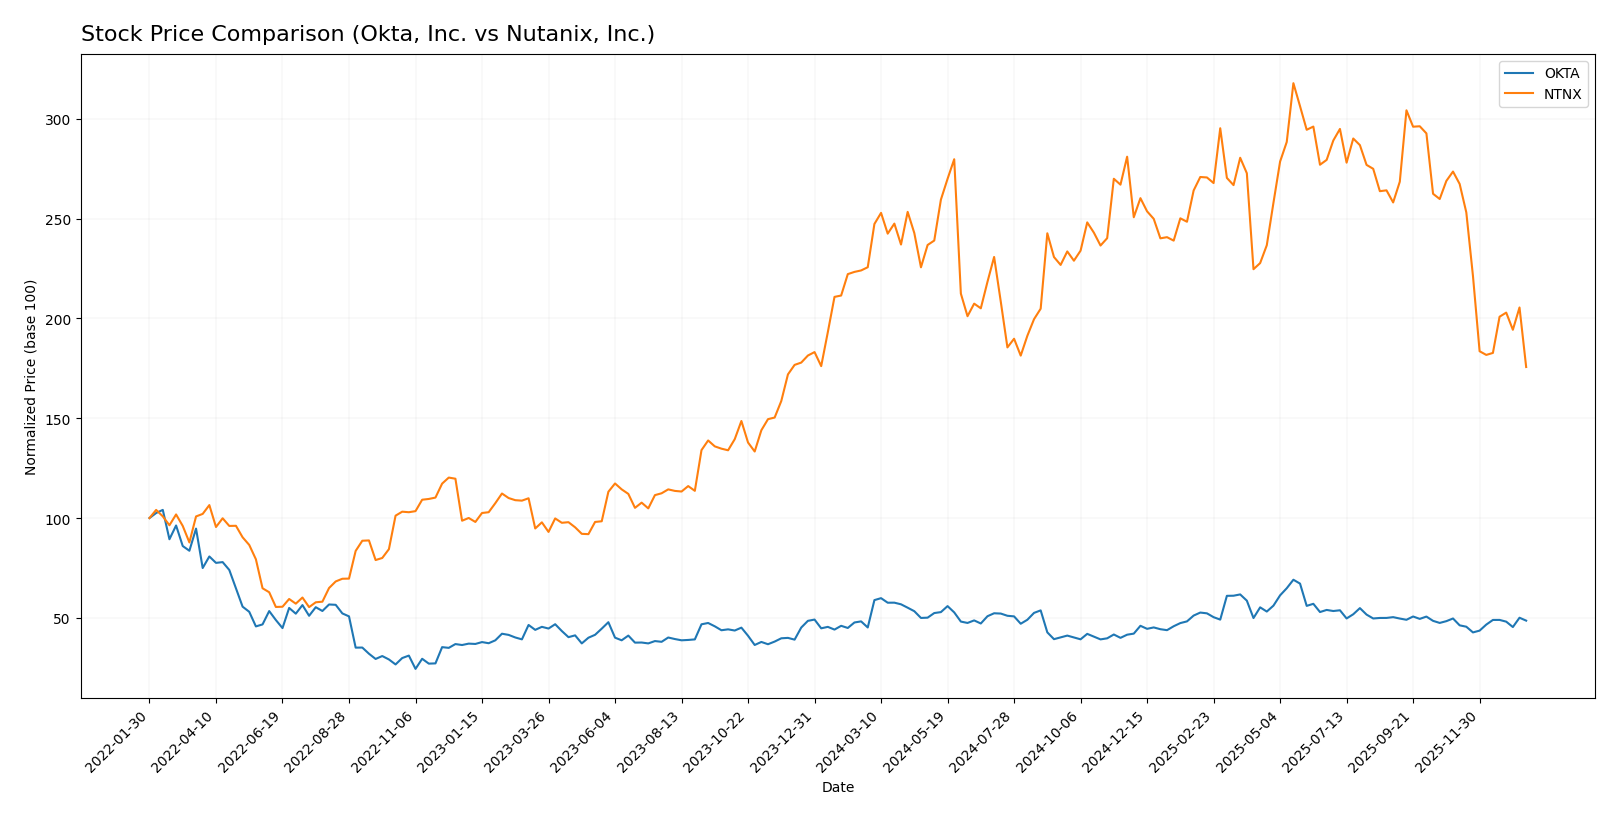
The stock prices of Okta, Inc. and Nutanix, Inc. have shown contrasting dynamics over the past year, with Okta experiencing a notable bullish trend and Nutanix facing a significant bearish trajectory.
Trend Analysis
Okta, Inc. posted a 7.58% price increase over the past 12 months, indicating a bullish trend with acceleration. Its price fluctuated between 72.24 and 127.3, showing substantial volatility with an 11.38 standard deviation.
Nutanix, Inc. recorded a -22.16% price change over the same period, marking a bearish trend with deceleration. Its highest and lowest prices were 82.77 and 45.74, respectively, with moderate volatility at an 8.67 standard deviation.
Comparing the two, Okta, Inc. delivered the highest market performance with a positive price change, while Nutanix, Inc. trended downward significantly over the past year.
Target Prices
Analysts present a solid target price consensus for both Okta, Inc. and Nutanix, Inc.
| Company | Target High | Target Low | Consensus |
|---|---|---|---|
| Okta, Inc. | 140 | 60 | 110.67 |
| Nutanix, Inc. | 90 | 53 | 64.67 |
The target consensus for Okta suggests a significant upside from its current price of $89.55, while Nutanix’s consensus target price also indicates potential growth from $45.74, reflecting positive analyst expectations.
Analyst Opinions Comparison
This section compares analysts’ ratings and grades for Okta, Inc. and Nutanix, Inc.:
Rating Comparison
Okta Rating
- Rated B, considered very favorable overall.
- Discounted Cash Flow Score: 4, indicating a favorable valuation based on cash flow projections.
- Return on Equity Score: 2, showing moderate efficiency in generating profit from equity.
- Return on Assets Score: 3, reflecting moderate effectiveness in asset utilization.
- Debt To Equity Score: 4, favorable, indicating low financial risk from debt.
- Overall Score: 3, moderate financial standing.
Nutanix Rating
- Rated C+, also considered very favorable overall.
- Discounted Cash Flow Score: 4, also favorable on valuation grounds.
- Return on Equity Score: 1, indicating very unfavorable efficiency.
- Return on Assets Score: 4, showing favorable utilization of assets.
- Debt To Equity Score: 1, very unfavorable, suggesting higher financial risk.
- Overall Score: 2, moderate but lower than Okta’s.
Which one is the best rated?
Based on the provided data, Okta is better rated overall, with higher scores in return on equity, debt to equity, and overall financial standing. Nutanix scores better only in return on assets but has lower marks in key risk and profitability metrics.
Scores Comparison
Here is a comparison of the Altman Z-Score and Piotroski Score for Okta, Inc. and Nutanix, Inc.:
Okta Scores
- Altman Z-Score: 4.15, in the safe zone indicating low bankruptcy risk.
- Piotroski Score: 8, very strong financial health and value potential.
Nutanix Scores
- Altman Z-Score: 1.48, in the distress zone indicating high bankruptcy risk.
- Piotroski Score: 6, average financial strength and investment quality.
Which company has the best scores?
Okta shows a clearly stronger financial position with a safe zone Altman Z-Score and very strong Piotroski Score. Nutanix has a distress zone Altman Z-Score and a lower, average Piotroski Score, indicating comparatively weaker financial health.
Grades Comparison
Here is a detailed comparison of the recent grades assigned to Okta, Inc. and Nutanix, Inc.:
Okta, Inc. Grades
The table below summarizes recent grades given by recognized financial institutions for Okta, Inc.:
| Grading Company | Action | New Grade | Date |
|---|---|---|---|
| Stephens & Co. | Upgrade | Overweight | 2026-01-14 |
| Piper Sandler | Maintain | Neutral | 2026-01-05 |
| RBC Capital | Maintain | Outperform | 2026-01-05 |
| Jefferies | Upgrade | Buy | 2025-12-16 |
| Needham | Maintain | Buy | 2025-12-12 |
| BTIG | Maintain | Buy | 2025-12-04 |
| Susquehanna | Maintain | Neutral | 2025-12-03 |
| Cantor Fitzgerald | Maintain | Overweight | 2025-12-03 |
| Canaccord Genuity | Maintain | Buy | 2025-12-03 |
| Scotiabank | Maintain | Sector Perform | 2025-12-03 |
Okta shows a generally positive trend with multiple buy and overweight ratings, supported by recent upgrades.
Nutanix, Inc. Grades
Below are the latest grades for Nutanix, Inc. from reputable financial firms:
| Grading Company | Action | New Grade | Date |
|---|---|---|---|
| Barclays | Downgrade | Equal Weight | 2026-01-15 |
| Morgan Stanley | Downgrade | Equal Weight | 2026-01-12 |
| RBC Capital | Maintain | Outperform | 2026-01-05 |
| Goldman Sachs | Maintain | Buy | 2025-11-28 |
| JP Morgan | Maintain | Overweight | 2025-11-26 |
| Needham | Maintain | Buy | 2025-11-26 |
| Wells Fargo | Maintain | Equal Weight | 2025-11-26 |
| Morgan Stanley | Maintain | Overweight | 2025-11-26 |
| Keybanc | Maintain | Overweight | 2025-11-26 |
| Piper Sandler | Maintain | Overweight | 2025-11-26 |
Nutanix’s recent downgrades to equal weight contrast with earlier overweight and buy ratings, indicating some caution among analysts.
Which company has the best grades?
Okta, Inc. has received more upgrades and consistent buy or overweight ratings recently, while Nutanix, Inc. faced some downgrades to equal weight despite earlier positive grades. This divergence suggests varying analyst confidence levels, potentially influencing investor sentiment and portfolio allocation decisions.
Strengths and Weaknesses
Below is a comparison of key strengths and weaknesses of Okta, Inc. and Nutanix, Inc. based on recent financial and operational data.
| Criterion | Okta, Inc. | Nutanix, Inc. |
|---|---|---|
| Diversification | Primarily subscription-based (2.56B USD in 2025), limited product variety | Balanced revenue from subscriptions (2.02B USD) and professional services |
| Profitability | Low net margin (1.07%, unfavorable), ROIC negative (-0.61%, unfavorable) | Moderate net margin (7.42%, neutral), ROIC positive (8.11%, neutral) |
| Innovation | Growing ROIC trend despite value destruction, high P/E ratio (570.6, unfavorable) | Strong ROIC growth, durable competitive advantage, more favorable innovation outlook |
| Global presence | Moderate global reach, stable financial ratios with favorable liquidity | Strong liquidity and interest coverage, but higher debt-to-assets ratio (45.16%, neutral) |
| Market Share | Significant growth in subscription revenue, but value destruction signals caution | Steady revenue growth with value creation and slightly favorable financial ratios |
Key takeaways: Nutanix demonstrates a stronger economic moat with value creation and improving profitability, while Okta shows growth potential but is currently shedding value. Investors should weigh Nutanix’s balanced revenue streams and stronger financial health against Okta’s rapid subscription growth but challenging profitability.
Risk Analysis
Below is a summary table of key risks for Okta, Inc. and Nutanix, Inc. based on the most recent fiscal year 2025 data:
| Metric | Okta, Inc. (OKTA) | Nutanix, Inc. (NTNX) |
|---|---|---|
| Market Risk | Moderate (beta 0.76) | Lower (beta 0.49) |
| Debt level | Low (debt-to-assets 10.1%) | Moderate (debt-to-assets 45.2%) |
| Regulatory Risk | Moderate (tech sector scrutiny) | Moderate (cloud compliance requirements) |
| Operational Risk | Moderate (platform complexity) | Moderate (diverse cloud services) |
| Environmental Risk | Low (software focus) | Low (software focus) |
| Geopolitical Risk | Moderate (global operations) | Moderate (global operations) |
The most likely and impactful risks stem from market volatility and operational complexities inherent to software infrastructure firms. Okta shows a healthier debt profile and stronger financial stability, while Nutanix faces higher leverage and a concerning Altman Z-score indicating financial distress risk. Both companies operate globally, exposing them to regulatory and geopolitical uncertainties. Investors should weigh Okta’s moderate valuation risks against Nutanix’s financial vulnerabilities carefully.
Which Stock to Choose?
Okta, Inc. shows a favorable income evolution with strong revenue and profit growth. Its financial ratios are balanced, with several favorable metrics including a solid current ratio and low debt. However, profitability remains low and debt-to-EBITDA is relatively high. The company receives a very favorable rating overall, supported by a safe zone Altman Z-Score and a strong Piotroski Score, despite a slightly unfavorable MOAT due to ROIC below WACC.
Nutanix, Inc. exhibits favorable income growth and a higher gross margin than Okta. Its financial ratios are slightly more favorable overall, with strong liquidity and value creation indicated by ROIC exceeding WACC. Nevertheless, the company faces challenges in return on equity and some leverage metrics. Its rating is very favorable, but it shows distress zone in Altman Z-Score and an average Piotroski Score. The stock price trend recently has been bearish with deceleration.
Which stock appears most favorable depends on the investor’s profile. Those focused on stability and financial strength might find Okta’s safer financial footing and strong scores more appealing. Conversely, investors with a tolerance for risk and an interest in growth potential could view Nutanix’s value creation and income growth as attractive, despite some financial distress signals.
Disclaimer: Investment carries a risk of loss of initial capital. The past performance is not a reliable indicator of future results. Be sure to understand risks before making an investment decision.
Go Further
I encourage you to read the complete analyses of Okta, Inc. and Nutanix, Inc. to enhance your investment decisions: