In the fast-evolving technology sector, Nutanix, Inc. and Oddity Tech Ltd. stand out as intriguing contenders, both listed on NASDAQ but operating in distinct niches within software infrastructure. Nutanix leads with enterprise cloud solutions, while Oddity innovates in consumer tech for beauty and wellness. Their contrasting approaches to innovation and market focus make this comparison essential. Join me as we explore which company offers the most compelling investment opportunity in 2026.
Table of contents
Companies Overview
I will begin the comparison between Nutanix and Oddity Tech by providing an overview of these two companies and their main differences.
Nutanix Overview
Nutanix, Inc. is a U.S.-based technology company specializing in enterprise cloud platforms. Founded in 2009 and headquartered in San Jose, California, it serves a global market across North America, Europe, Asia Pacific, the Middle East, Latin America, and Africa. Nutanix focuses on infrastructure software, offering virtualization, cloud-native management, and hybrid cloud orchestration solutions to a wide range of industries including automotive, healthcare, and telecommunications.
Oddity Tech Overview
Oddity Tech Ltd. is an Israeli consumer-tech firm founded in 2013 and headquartered in Tel Aviv-Jaffa. It operates globally in the beauty and wellness sector, leveraging its proprietary PowerMatch technology to build digital-first brands. Oddity’s product lines include skincare, cosmetics, and hair care under brands like IL MAKIAGE and SpoiledChild, aiming to disrupt the traditionally offline beauty industry with innovative software-enabled solutions.
Key similarities and differences
Both Nutanix and Oddity Tech operate in the technology sector and are publicly traded on NASDAQ, but they serve distinct markets and industries. Nutanix focuses on software infrastructure and enterprise cloud solutions, while Oddity Tech targets consumer products in beauty and wellness. Nutanix has a much larger market capitalization (about 12.4B USD) and workforce (7,150 employees) compared to Oddity’s 2B USD market cap and 489 employees, reflecting their different scale and business models.
Income Statement Comparison
This table presents a side-by-side comparison of key income statement metrics for Nutanix, Inc. and Oddity Tech Ltd. for their most recent fiscal years.

| Metric | Nutanix, Inc. (NTNX) | Oddity Tech Ltd. (ODD) |
|---|---|---|
| Market Cap | 12.37B | 2.01B |
| Revenue | 2.54B | 647M |
| EBITDA | 293M | 125M |
| EBIT | 220M | 116M |
| Net Income | 188M | 101M |
| EPS | 0.70 | 1.78 |
| Fiscal Year | 2025 | 2024 |
Income Statement Interpretations
Nutanix, Inc.
Nutanix has shown consistent revenue growth from $1.39B in 2021 to $2.54B in 2025, with net income swinging from a significant loss in 2021 (-$1.03B) to positive $188M in 2025. Its gross margin remained strong around 87%, while net margin improved markedly to 7.42% in 2025. The latest year indicates a robust recovery with 18.1% revenue growth and a favorable 228% net margin increase.
Oddity Tech Ltd.
Oddity Tech demonstrated rapid expansion, with revenue rising from $110.6M in 2020 to $647M in 2024. Net income improved substantially from $11.7M to $101.5M over this period. Margins are favorable, with a gross margin of 72.4% and net margin at 15.7% in 2024. The company posted strong one-year revenue growth of 27.2% and a 36.3% increase in net margin, signaling accelerating profitability.
Which one has the stronger fundamentals?
Both companies exhibit favorable income statement trends, but Oddity Tech’s higher net margin (15.7% vs. Nutanix’s 7.4%) and more pronounced revenue and net income growth over the period stand out. Nutanix shows a strong margin recovery and scale with larger revenue, while Oddity Tech’s rapid growth and profitability improvements reflect solid fundamentals. Both maintain favorable financial health without unfavorable indicators.
Financial Ratios Comparison
The table below presents the most recent financial ratios for Nutanix, Inc. and Oddity Tech Ltd., highlighting key performance and financial health metrics for fiscal year 2025 and 2024 respectively.
| Ratios | Nutanix, Inc. (2025) | Oddity Tech Ltd. (2024) |
|---|---|---|
| ROE | -27.1% | 36.0% |
| ROIC | 8.1% | 28.6% |
| P/E | 106.7 | 23.7 |
| P/B | -29.0 | 8.54 |
| Current Ratio | 1.72 | 1.79 |
| Quick Ratio | 1.72 | 0.99 |
| D/E (Debt to Equity) | -2.14 | 0.08 |
| Debt-to-Assets | 45.2% | 5.17% |
| Interest Coverage | 8.75 | 1521 |
| Asset Turnover | 0.77 | 1.47 |
| Fixed Asset Turnover | 9.15 | 19.4 |
| Payout ratio | 0% | 0% |
| Dividend yield | 0% | 0% |
Interpretation of the Ratios
Nutanix, Inc.
Nutanix shows a mixed ratio profile: half of its key ratios are favorable, including a strong current and quick ratio at 1.72, and a good interest coverage of 11.15, indicating solid liquidity and debt servicing ability. However, the company faces concerns with an unfavorable return on equity at -27.12% and a very high price-to-earnings ratio of 106.74, which may suggest valuation risks. Nutanix does not pay dividends, likely reflecting a reinvestment strategy or growth phase focus.
Oddity Tech Ltd.
Oddity Tech’s financial ratios are generally favorable, with 64.29% positive indicators including a robust return on equity of 35.95%, strong operating returns, and excellent interest coverage at 1521.05. The company also maintains low debt levels with a debt-to-assets ratio of 5.17%. Despite this, its weighted average cost of capital at 18.68% and price-to-book ratio of 8.54 are less attractive. Oddity Tech does not distribute dividends, consistent with prioritizing growth and reinvestment.
Which one has the best ratios?
Oddity Tech demonstrates a more favorable overall ratio profile with higher returns on equity and invested capital, stronger liquidity, and better asset turnover compared to Nutanix. Nutanix’s weaker profitability and high valuation ratios weigh against it, despite solid liquidity and coverage ratios. Thus, Oddity Tech holds the edge on ratio strength and financial health in this comparison.
Strategic Positioning
This section compares the strategic positioning of Nutanix, Inc. and Oddity Tech Ltd., including their market position, key segments, and exposure to technological disruption:
Nutanix, Inc.
- Leading enterprise cloud platform provider with broad global presence and moderate competitive pressure.
- Primarily serves enterprise infrastructure with subscription products and professional services as key drivers.
- Positioned in software infrastructure with evolving cloud-native solutions, facing moderate technological disruption.
Oddity Tech Ltd.
- Consumer-tech disruptor in beauty and wellness with niche market focus and high competitive pressure.
- Focuses on digital-first beauty and wellness products using proprietary PowerMatch technology.
- Operates in consumer tech with digital innovation disrupting traditional offline beauty markets.
Nutanix, Inc. vs Oddity Tech Ltd. Positioning
Nutanix has a diversified enterprise cloud platform approach spanning multiple industries, while Oddity concentrates on consumer beauty technology brands. Nutanix benefits from scale and subscription revenues; Oddity leverages digital disruption in niche sectors but with smaller scale and higher market volatility.
Which has the best competitive advantage?
Both companies demonstrate very favorable MOAT evaluations with growing ROIC above WACC. Nutanix shows durable advantage through enterprise cloud solutions, while Oddity exhibits strong value creation via digital-first consumer tech innovation.
Stock Comparison
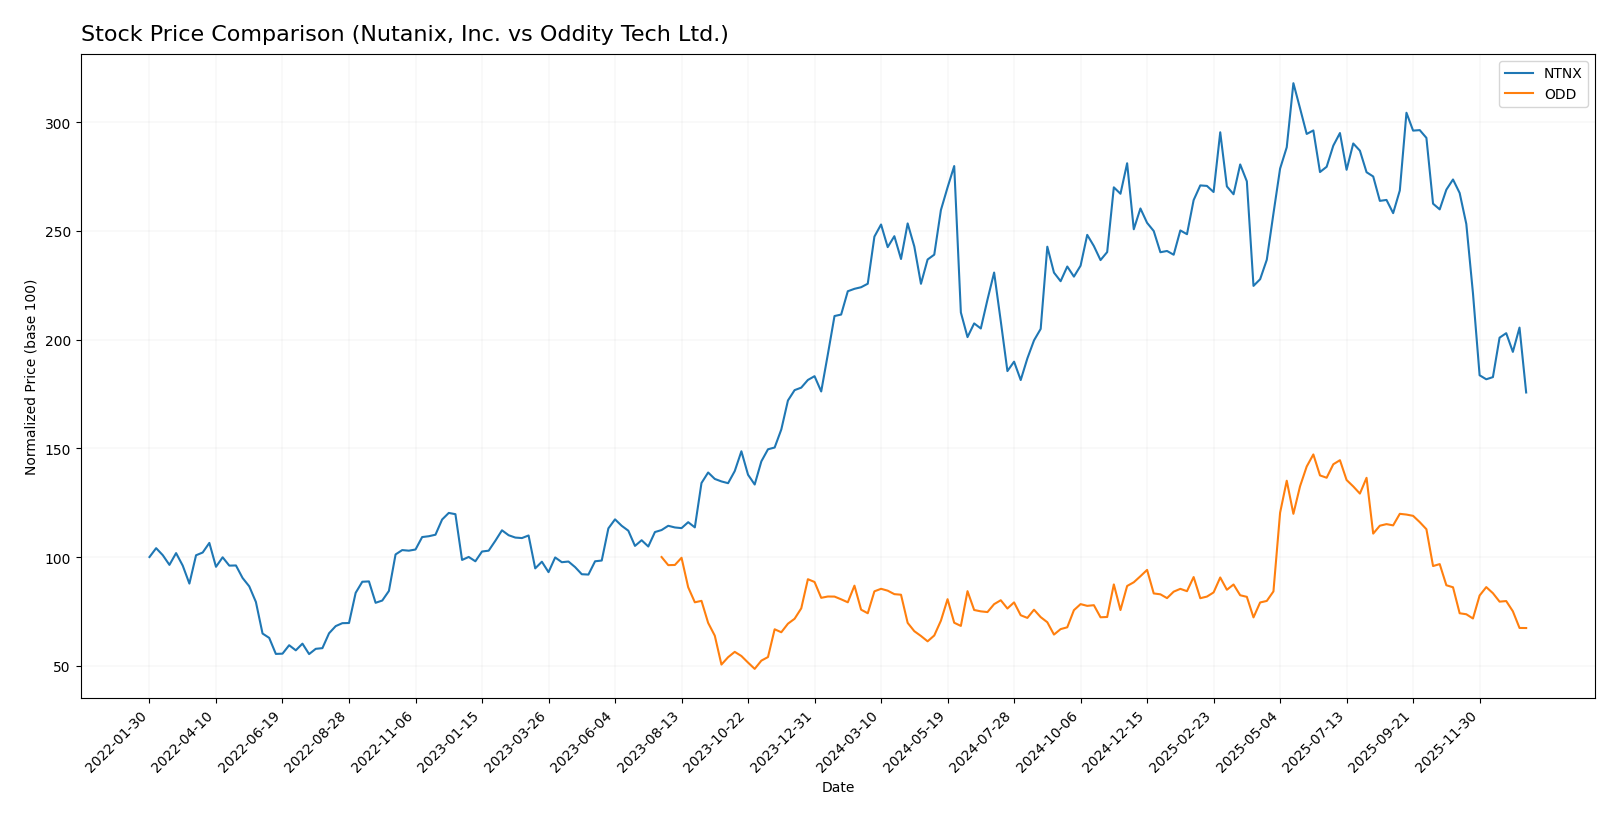
The stock prices of Nutanix, Inc. (NTNX) and Oddity Tech Ltd. (ODD) have shown notable bearish trends over the past year, reflecting deceleration in price movements and shifts in trading volumes.
Trend Analysis
Nutanix, Inc. (NTNX) recorded a -22.16% price change over the last 12 months, indicating a bearish trend with deceleration. The stock experienced a high of 82.77 and a low of 45.74, with volatility measured by an 8.67 standard deviation.
Oddity Tech Ltd. (ODD) also faced a bearish trend, with a -9.16% price decline over the same period and deceleration in trend. Its price ranged between 77.35 and 32.19, showing higher volatility with a standard deviation of 11.75.
Comparing both stocks, Nutanix has delivered the largest negative price change, reflecting weaker market performance relative to Oddity Tech during the analyzed timeframe.
Target Prices
The current analyst consensus suggests moderately optimistic target prices for Nutanix, Inc. and Oddity Tech Ltd.
| Company | Target High | Target Low | Consensus |
|---|---|---|---|
| Nutanix, Inc. | 90 | 53 | 64.67 |
| Oddity Tech Ltd. | 80 | 40 | 66.33 |
Analysts expect both stocks to appreciate significantly from current prices, with Nutanix at $45.74 and Oddity at $35.40, indicating potential upside opportunities in each case.
Analyst Opinions Comparison
This section compares analysts’ ratings and grades for Nutanix, Inc. and Oddity Tech Ltd.:
Rating Comparison
Nutanix, Inc. Rating
- Rating: C+ with a “Very Favorable” status
- Discounted Cash Flow Score: 4, indicating favorable valuation
- ROE Score: 1, classified as very unfavorable performance
- ROA Score: 4, showing favorable asset utilization
- Debt To Equity Score: 1, indicating very unfavorable balance sheet
- Overall Score: 2, reflecting a moderate overall financial standing
Oddity Tech Ltd. Rating
- Rating: B+ with a “Very Favorable” status
- Discounted Cash Flow Score: 4, indicating favorable valuation
- ROE Score: 5, classified as very favorable performance
- ROA Score: 4, showing favorable asset utilization
- Debt To Equity Score: 3, indicating moderate financial risk
- Overall Score: 3, reflecting a moderate overall financial standing
Which one is the best rated?
Based solely on the provided data, Oddity Tech Ltd. holds a better overall rating (B+) and scores higher on ROE and debt-to-equity metrics, suggesting comparatively stronger financial health than Nutanix, Inc.
Scores Comparison
Here is a comparison of the Altman Z-Score and Piotroski Score for Nutanix, Inc. and Oddity Tech Ltd.:
NTNX Scores
- Altman Z-Score: 1.48, in the distress zone indicating higher bankruptcy risk.
- Piotroski Score: 6, considered average financial strength.
ODD Scores
- Altman Z-Score: 3.78, in the safe zone indicating low bankruptcy risk.
- Piotroski Score: 6, considered average financial strength.
Which company has the best scores?
Oddity Tech Ltd. has a better Altman Z-Score, placing it in the safe zone versus Nutanix’s distress zone. Both companies share the same average Piotroski Score of 6.
Grades Comparison
The following is a comparison of the recent grades assigned to Nutanix, Inc. and Oddity Tech Ltd. by recognized grading companies:
Nutanix, Inc. Grades
This table presents recent rating changes and maintenances from major financial institutions for Nutanix, Inc.
| Grading Company | Action | New Grade | Date |
|---|---|---|---|
| Barclays | Downgrade | Equal Weight | 2026-01-15 |
| Morgan Stanley | Downgrade | Equal Weight | 2026-01-12 |
| RBC Capital | Maintain | Outperform | 2026-01-05 |
| Goldman Sachs | Maintain | Buy | 2025-11-28 |
| JP Morgan | Maintain | Overweight | 2025-11-26 |
| Needham | Maintain | Buy | 2025-11-26 |
| Wells Fargo | Maintain | Equal Weight | 2025-11-26 |
| Morgan Stanley | Maintain | Overweight | 2025-11-26 |
| Keybanc | Maintain | Overweight | 2025-11-26 |
| Piper Sandler | Maintain | Overweight | 2025-11-26 |
Nutanix shows a mixed trend, with recent downgrades from Overweight to Equal Weight by Barclays and Morgan Stanley, while other firms maintain buy or overweight ratings.
Oddity Tech Ltd. Grades
This table lists the ongoing ratings maintained by respected financial firms for Oddity Tech Ltd.
| Grading Company | Action | New Grade | Date |
|---|---|---|---|
| Keybanc | Maintain | Overweight | 2026-01-08 |
| JP Morgan | Maintain | Overweight | 2025-12-12 |
| JP Morgan | Maintain | Overweight | 2025-11-21 |
| Barclays | Maintain | Equal Weight | 2025-11-21 |
| Morgan Stanley | Maintain | Equal Weight | 2025-11-21 |
| Needham | Maintain | Buy | 2025-11-20 |
| Keybanc | Maintain | Overweight | 2025-10-08 |
| JMP Securities | Maintain | Market Outperform | 2025-09-23 |
| Morgan Stanley | Maintain | Equal Weight | 2025-08-06 |
| JMP Securities | Maintain | Market Outperform | 2025-08-05 |
Oddity Tech’s grades consistently show maintenance of overweight, equal weight, and buy ratings with no recent downgrades.
Which company has the best grades?
Nutanix has experienced recent downgrades by major firms, while Oddity Tech’s ratings remain stable and consistently positive. Investors may perceive Oddity Tech’s steadier grading trend as indicative of lower near-term risk compared to Nutanix’s recent rating adjustments.
Strengths and Weaknesses
Below is a comparison of key strengths and weaknesses of Nutanix, Inc. (NTNX) and Oddity Tech Ltd. (ODD) based on recent financial and operational data.
| Criterion | Nutanix, Inc. (NTNX) | Oddity Tech Ltd. (ODD) |
|---|---|---|
| Diversification | Moderate: Revenue mainly from subscription (2B USD in 2024) and professional services | Limited data on product segmentation; appears more focused |
| Profitability | Moderate: Net margin 7.42% (neutral), ROIC 8.11% (neutral), ROE negative -27.12% (unfavorable) | Strong: Net margin 15.69%, ROIC 28.56%, ROE 35.95% (all favorable) |
| Innovation | Proven competitive advantage with growing ROIC (+117%), favorable WACC (5.89%) | Also strong moat with growing ROIC (+34%), but higher WACC (18.68%) |
| Global presence | Established global footprint with steady subscription growth | Smaller scale, limited public info on global reach |
| Market Share | Solid presence in cloud software; market share growth implied by rising profitability | Emerging player with rapid profitability gains but less data on market share |
Key takeaways: Both companies demonstrate durable competitive advantages with growing profitability. Nutanix shows stability and efficient capital use but moderate profitability metrics, while Oddity Tech exhibits stronger margins and returns but operates with higher capital costs and less diversification. Investors should weigh Nutanix’s steady growth against Oddity’s higher risk-reward profile.
Risk Analysis
Below is a comparative table of key risks for Nutanix, Inc. (NTNX) and Oddity Tech Ltd. (ODD) based on the most recent data from 2025 and 2024 respectively:
| Metric | Nutanix, Inc. (NTNX) | Oddity Tech Ltd. (ODD) |
|---|---|---|
| Market Risk | Moderate (Beta 0.49, lower volatility) | High (Beta 3.18, very volatile) |
| Debt level | Moderate (Debt-to-assets 45%, favorable debt/equity score) | Low (Debt-to-assets 5.17%, strong balance sheet) |
| Regulatory Risk | Moderate (US-based tech sector, subject to data/privacy regulations) | Moderate (Israel-based, global consumer tech with regulatory scrutiny) |
| Operational Risk | Moderate (Large enterprise cloud platform, complex product suite) | Moderate (Smaller scale, reliance on innovative product adoption) |
| Environmental Risk | Low (Tech industry, limited direct impact) | Low (Consumer wellness products, minimal environmental footprint) |
| Geopolitical Risk | Moderate (Global presence including sensitive regions) | Moderate-High (Based in Israel, geopolitical tensions possible) |
Synthesis: Nutanix’s most impactful risk is its moderate debt level and operational complexity, with a moderate market risk due to its low beta. Oddity Tech faces higher market volatility and geopolitical risks due to its location and sector but benefits from a low debt burden and strong profitability metrics. Investors should weigh Nutanix’s financial distress signals against Oddity’s higher volatility.
Which Stock to Choose?
Nutanix, Inc. (NTNX) has shown favorable income growth with an 18.11% revenue increase in 2025 and strong profitability metrics, including a 7.42% net margin. Its financial ratios are slightly favorable overall, despite an unfavorable ROE of -27.12%, supported by a very favorable economic moat and a C+ rating. The company carries moderate debt with a net debt to EBITDA of 2.44 and a current ratio of 1.72, indicating good liquidity but some leverage concerns.
Oddity Tech Ltd. (ODD) demonstrates robust income growth, with a 27.2% revenue increase in 2024 and consistently favorable profitability ratios, including a 15.69% net margin and a strong ROE of 35.95%. Its financial ratios are globally favorable, supported by a very favorable economic moat and a B+ rating. The company features low debt levels, with a net debt to EBITDA of -0.22, strong liquidity at a current ratio of 1.79, and a safe Altman Z-Score, reflecting solid financial health.
Considering the ratings and comprehensive evaluation of income statements and financial ratios, NTNX might appeal to investors seeking growth opportunities with a durable competitive advantage despite some risk in equity returns. Conversely, ODD could be more attractive for those prioritizing financial stability, profitability, and lower leverage, as it presents a more favorable risk profile and consistent value creation.
Disclaimer: Investment carries a risk of loss of initial capital. The past performance is not a reliable indicator of future results. Be sure to understand risks before making an investment decision.
Go Further
I encourage you to read the complete analyses of Nutanix, Inc. and Oddity Tech Ltd. to enhance your investment decisions: