Home > Comparison > Basic Materials > NUE vs STLD
The strategic rivalry between Nucor Corporation and Steel Dynamics, Inc. shapes the steel industry’s evolution in North America. Nucor operates as a diversified steel manufacturer with integrated raw materials production, while Steel Dynamics focuses on efficient steel production combined with metal recycling and fabrication. This analysis pits Nucor’s scale and vertical integration against Steel Dynamics’ operational agility, aiming to identify which path offers superior risk-adjusted returns for a well-diversified portfolio.
Table of contents
Companies Overview
Nucor Corporation and Steel Dynamics, Inc. both exert significant influence in the competitive U.S. steel industry.
Nucor Corporation: Industry-Leading Steel Producer
Nucor Corporation stands as a major steel manufacturer in North America. It generates revenue primarily through its Steel Mills and Steel Products segments, offering a broad range of rolled, structural, and fabricated steel products. In 2026, Nucor emphasizes supply chain integration and expanding its raw materials segment to enhance cost control and product diversification.
Steel Dynamics, Inc.: Integrated Steel and Recycling Specialist
Steel Dynamics, Inc. operates as a vertically integrated steel producer and recycler. It earns revenue via Steel Operations, Metals Recycling, and Steel Fabrication segments, serving construction, automotive, and manufacturing sectors. The company’s 2026 focus remains on boosting operational efficiency and expanding its steel fabrication capabilities to serve non-residential construction markets.
Strategic Collision: Similarities & Divergences
Both firms prioritize steel production and value-added fabrication, yet Nucor leans into raw material control while Steel Dynamics integrates extensive recycling operations. Their primary battleground lies in serving diversified industrial markets with innovative steel solutions. This contrast defines distinct investment profiles: Nucor as a scale-driven cost leader, and Steel Dynamics as a nimble recycler and fabricator.
Income Statement Comparison
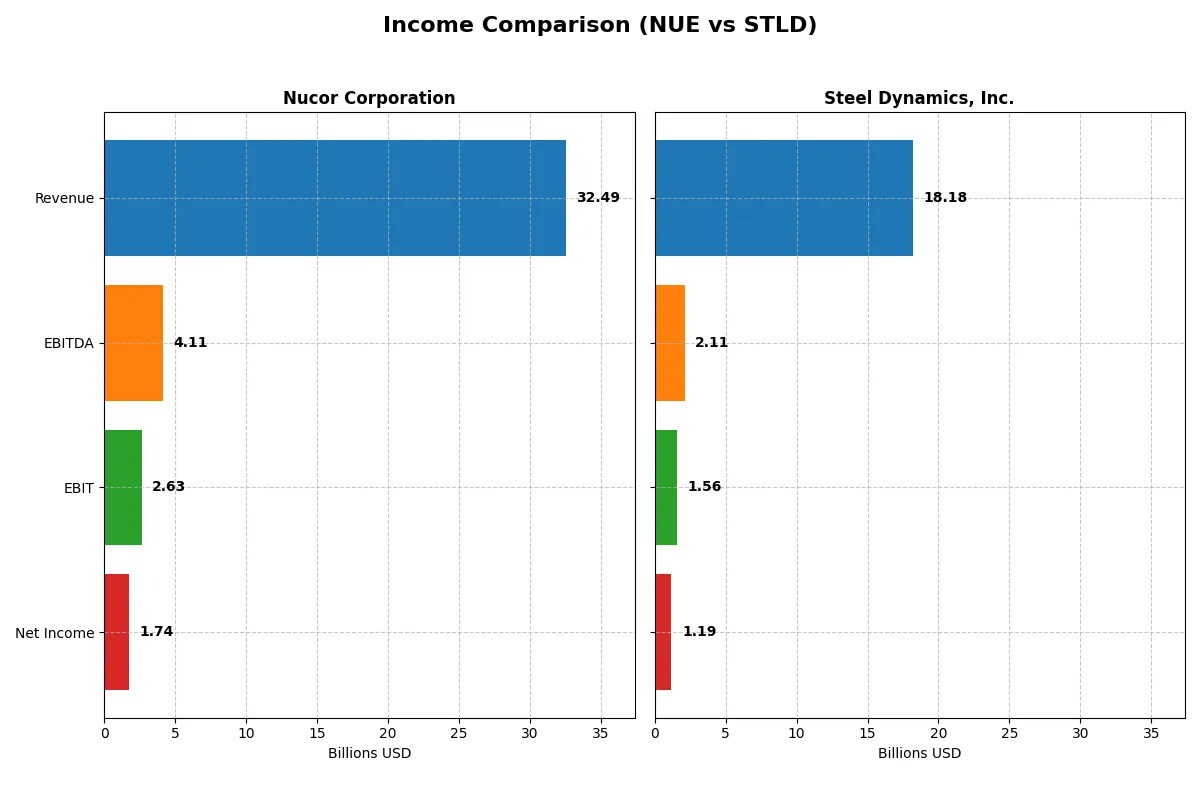
This data dissects the core profitability and scalability of both corporate engines to reveal who dominates the bottom line:
| Metric | Nucor Corporation (NUE) | Steel Dynamics, Inc. (STLD) |
|---|---|---|
| Revenue | 32.5B | 18.2B |
| Cost of Revenue | 28.6B | 15.8B |
| Operating Expenses | 1.2B | 888M |
| Gross Profit | 3.9B | 2.4B |
| EBITDA | 4.1B | 2.1B |
| EBIT | 2.6B | 1.6B |
| Interest Expense | 59M | 70M |
| Net Income | 1.7B | 0 |
| EPS | 7.53 | 8.02 |
| Fiscal Year | 2025 | 2025 |
Income Statement Analysis: The Bottom-Line Duel
The following income statement comparison uncovers which steelmaker runs a more efficient and resilient financial engine in 2025.
Nucor Corporation Analysis
Nucor’s revenue dipped 10.9% over five years, closing at $32.5B in 2025, while net income plunged 74.5% to $1.74B. Gross margin slid to 11.9%, with net margin at a modest 5.4%. The latest year shows weakening profitability, with EBIT down 16% and net margin contracting sharply, signaling mounting efficiency challenges.
Steel Dynamics, Inc. Analysis
Steel Dynamics reported a smaller revenue decline of 1.3% over five years, reaching $18.2B in 2025, and net income fell 63.1% to $1.19B. Its gross margin of 13.0% and net margin of 6.5% outpace Nucor slightly. Despite a 23% EBIT drop last year, STLD maintains relatively steadier margin profiles and controls operating expenses better than Nucor.
Margin Resilience vs. Scale Pressure
Steel Dynamics sustains healthier margin percentages amid revenue pressure, while Nucor grapples with sharper profitability erosion despite its larger scale. STLD’s efficiency in cost management offers a sturdier bottom line. For investors, Steel Dynamics’ profile suggests a more resilient earnings engine, whereas Nucor faces tougher margin headwinds.
Financial Ratios Comparison
These vital ratios act as a diagnostic tool to expose the underlying fiscal health, valuation premiums, and capital efficiency of each company:
| Ratios | Nucor Corporation (NUE) | Steel Dynamics, Inc. (STLD) |
|---|---|---|
| ROE | 8.33% | 13.24% |
| ROIC | 6.74% | 8.19% |
| P/E | 21.58 | 21.13 |
| P/B | 1.80 | 2.80 |
| Current Ratio | 2.94 | 3.06 |
| Quick Ratio | 1.57 | 1.29 |
| D/E | 0.34 | 0.47 |
| Debt-to-Assets | 20.29% | 25.66% |
| Interest Coverage | 45.07 | 21.07 |
| Asset Turnover | 0.93 | 1.11 |
| Fixed Asset Turnover | 2.12 | 2.12 |
| Payout ratio | 29.36% | 24.56% |
| Dividend yield | 1.36% | 1.16% |
| Fiscal Year | 2025 | 2025 |
Efficiency & Valuation Duel: The Vital Signs
Ratios act as a company’s DNA, revealing hidden risks and operational excellence critical to understanding its true financial health.
Nucor Corporation
Nucor exhibits modest profitability with an 8.33% ROE and neutral net margin at 5.37%. Its valuation appears balanced, with a P/E of 21.58 and P/B of 1.8, signaling it is neither cheap nor stretched. The 1.36% dividend yield suggests moderate shareholder returns alongside a prudent reinvestment approach.
Steel Dynamics, Inc.
Steel Dynamics shows stronger profitability, boasting a 13.24% ROE and a slightly higher net margin of 6.52%. Its P/E of 21.13 and P/B of 2.8 indicate a fair but relatively more premium valuation. The 1.16% dividend yield complements steady shareholder returns, supported by efficient asset turnover of 1.11.
Balanced Valuation Meets Operational Efficiency
Both companies present slightly favorable ratios, but Steel Dynamics offers a better return on equity and asset efficiency at a comparable valuation. Nucor’s more conservative leverage and dividend profile suit risk-averse investors, while Steel Dynamics aligns with those seeking higher operational productivity and growth potential.
Which one offers the Superior Shareholder Reward?
I compare Nucor Corporation (NUE) and Steel Dynamics, Inc. (STLD) on dividend yields, payout ratios, and buybacks to gauge shareholder returns. NUE yields 1.36% with a 29% payout ratio, balancing dividends and modest buybacks despite recent negative free cash flow. STLD offers a slightly lower yield at 1.16% and a 25% payout, but its buyback intensity is higher, supporting total returns. NUE’s more conservative payout and stronger free cash flow coverage suggest greater sustainability. I conclude NUE delivers a superior total shareholder reward in 2026 due to balanced capital allocation and sustainable distributions.
Comparative Score Analysis: The Strategic Profile
The radar chart reveals the fundamental DNA and trade-offs of Nucor Corporation and Steel Dynamics, Inc., highlighting their core financial strengths and weaknesses:
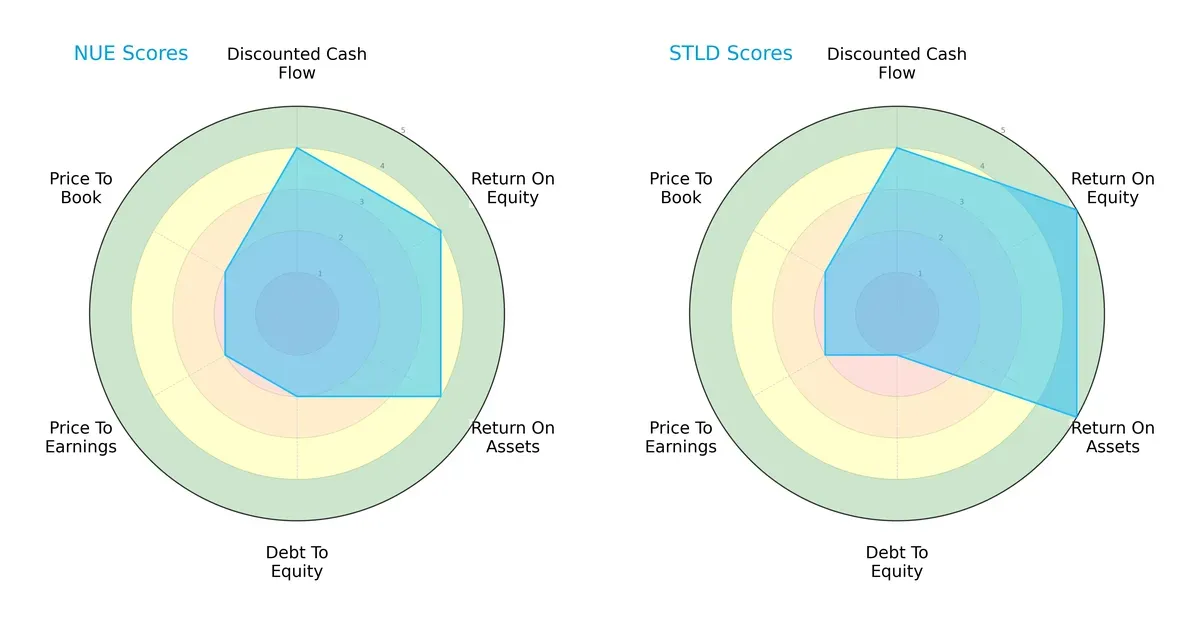
Both companies share a balanced overall score of 3, with strong DCF metrics (score 4). Steel Dynamics leads on profitability, scoring 5 in ROE and ROA versus Nucor’s 4, indicating superior asset efficiency and equity returns. However, Nucor holds an advantage in financial stability, with a better debt-to-equity score (2 vs. 1), signaling a more conservative leverage profile. Valuation metrics (PE/PB) are equally moderate for both, showing no clear bargain.
—
Bankruptcy Risk: Solvency Showdown
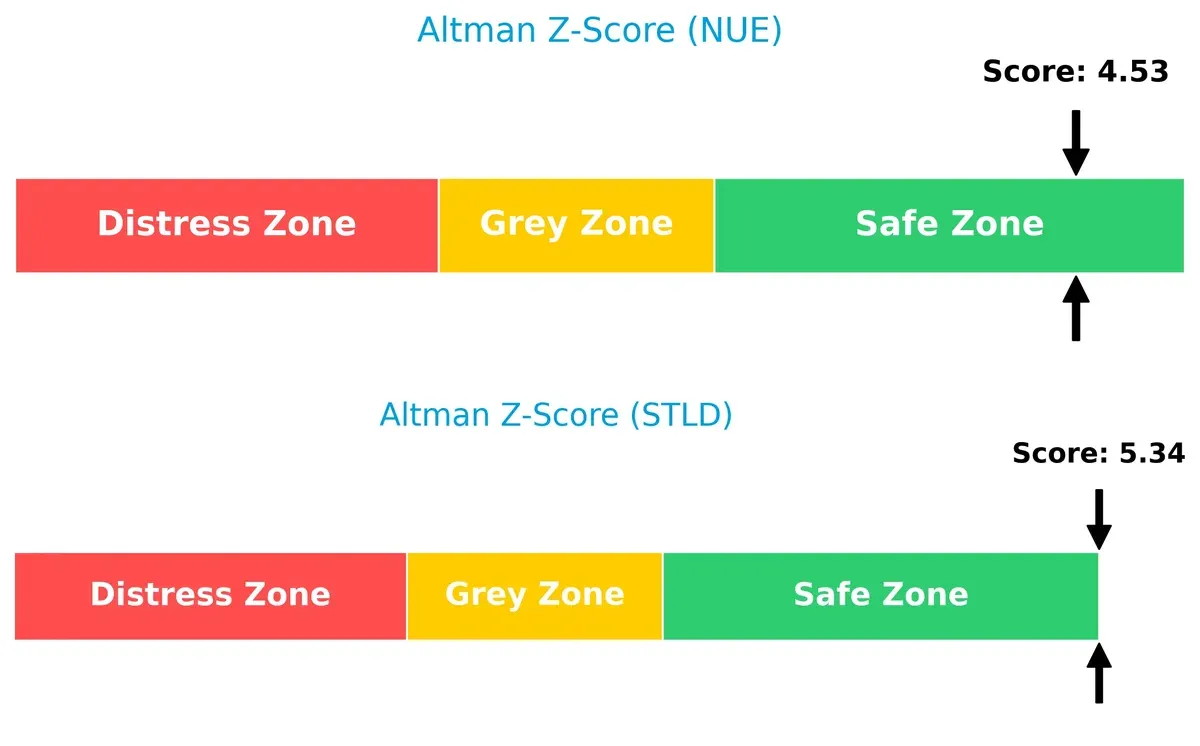
The Altman Z-Score gap favors Steel Dynamics, with a 5.34 score compared to Nucor’s 4.53, both comfortably in the safe zone, implying solid long-term solvency in this cycle:
—
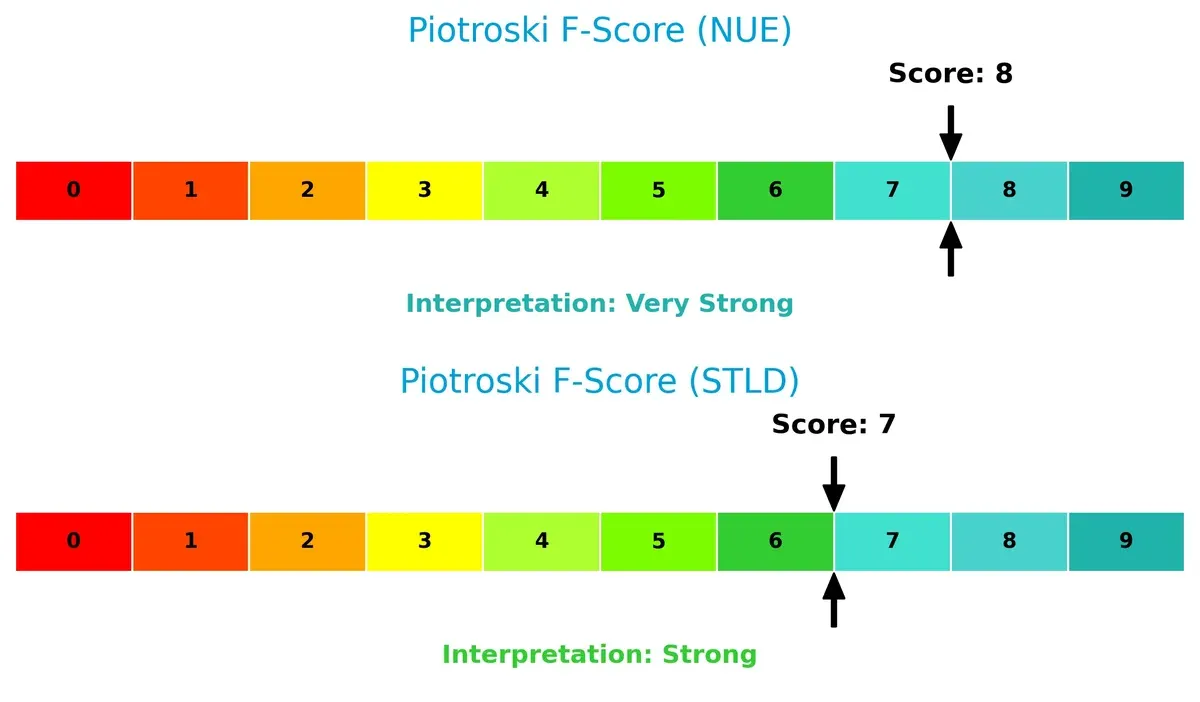
Financial Health: Quality of Operations
Nucor edges out Steel Dynamics with a Piotroski F-Score of 8 versus 7, signaling very strong financial health and operational quality. Steel Dynamics remains strong but shows slightly more internal risk factors:
How are the two companies positioned?
This section dissects the operational DNA of Nucor and Steel Dynamics by comparing their revenue distribution and internal strengths and weaknesses. The goal is to confront their economic moats to reveal which model offers the most resilient competitive advantage today.
Revenue Segmentation: The Strategic Mix
This visual comparison dissects how Nucor Corporation and Steel Dynamics, Inc. diversify their income streams and where their primary sector bets lie:
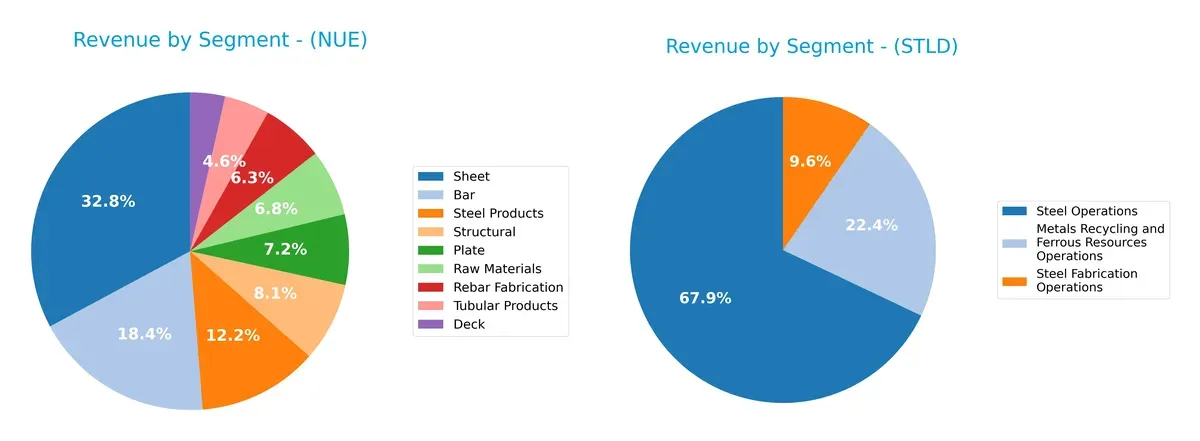
Nucor spreads revenue across multiple steel-related segments, with Sheet leading at $9.25B and significant contributions from Plate ($2.02B) and Structural ($2.28B). Steel Dynamics leans heavily on Steel Operations at $12.53B, overshadowing Metals Recycling ($4.14B) and Steel Fabrication ($1.77B). Nucor’s diversified mix reduces concentration risk, while Steel Dynamics pivots on steel production dominance, risking sector cyclicality but reinforcing operational scale.
Strengths and Weaknesses Comparison
This table compares the Strengths and Weaknesses of Nucor Corporation and Steel Dynamics, Inc.:
Nucor Corporation Strengths
- Favorable liquidity ratios with current ratio at 2.94 and quick ratio at 1.57
- Low debt-to-equity of 0.34 indicates conservative leverage
- Interest coverage strong at 44.53 times
- Diversified steel product segments including bar, plate, and sheet
Steel Dynamics, Inc. Strengths
- Favorable debt metrics with debt-to-equity at 0.47 and debt-to-assets at 25.66%
- Asset turnover of 1.11 shows efficient use of assets
- Favorable interest coverage at 22.32 times
- Significant revenue from metals recycling and steel fabrication segments
Nucor Corporation Weaknesses
- Return on equity at 8.33% below cost of capital at 11.16%, indicating value destruction
- ROIC at 6.74% lags WACC, showing suboptimal capital allocation
- Neutral net margin at 5.37%, limiting profitability leverage
- Price-to-book at 1.8 is moderate but no clear valuation edge
Steel Dynamics, Inc. Weaknesses
- Current ratio of 3.06 flagged unfavorable, possibly indicating inefficient working capital management
- Lower quick ratio at 1.29 compared to Nucor may signal liquidity risk
- ROE at 13.24% is neutral, not strongly outperforming peers
- Price-to-book ratio at 2.8 higher, suggesting premium valuation without clear margin advantage
Nucor displays strong balance sheet health and product diversification but faces challenges in profitability relative to capital costs. Steel Dynamics shows operational efficiency and revenue diversity but must address working capital concerns and valuation premiums. Both companies reveal slightly favorable financial standing with distinct strategic focus areas.
The Moat Duel: Analyzing Competitive Defensibility
A structural moat is the only true shield protecting long-term profits from relentless competitive erosion. Let’s examine these steel titans’ moats:
Nucor Corporation: Cost Leadership Powerhouse
Nucor’s moat stems from its cost advantage through electric arc furnace efficiency. This yields high margin stability despite recent profit declines. New markets in green steel could deepen its moat.
Steel Dynamics, Inc.: Integrated Recycling Edge
Steel Dynamics relies on vertical integration and scrap recycling, contrasting Nucor’s scale focus. Its margins remain resilient, but declining ROIC signals pressure. Expansion into fabrication may offset challenges.
Verdict: Cost Leadership vs. Vertical Integration
Both firms face shrinking ROIC, signaling value destruction. Yet, Nucor’s entrenched cost leadership offers a wider moat. It stands better positioned to defend market share amid steel industry headwinds.
Which stock offers better returns?
Over the past 12 months, both Nucor Corporation and Steel Dynamics, Inc. exhibited strong bullish trends with accelerating price gains and rising trading volumes.
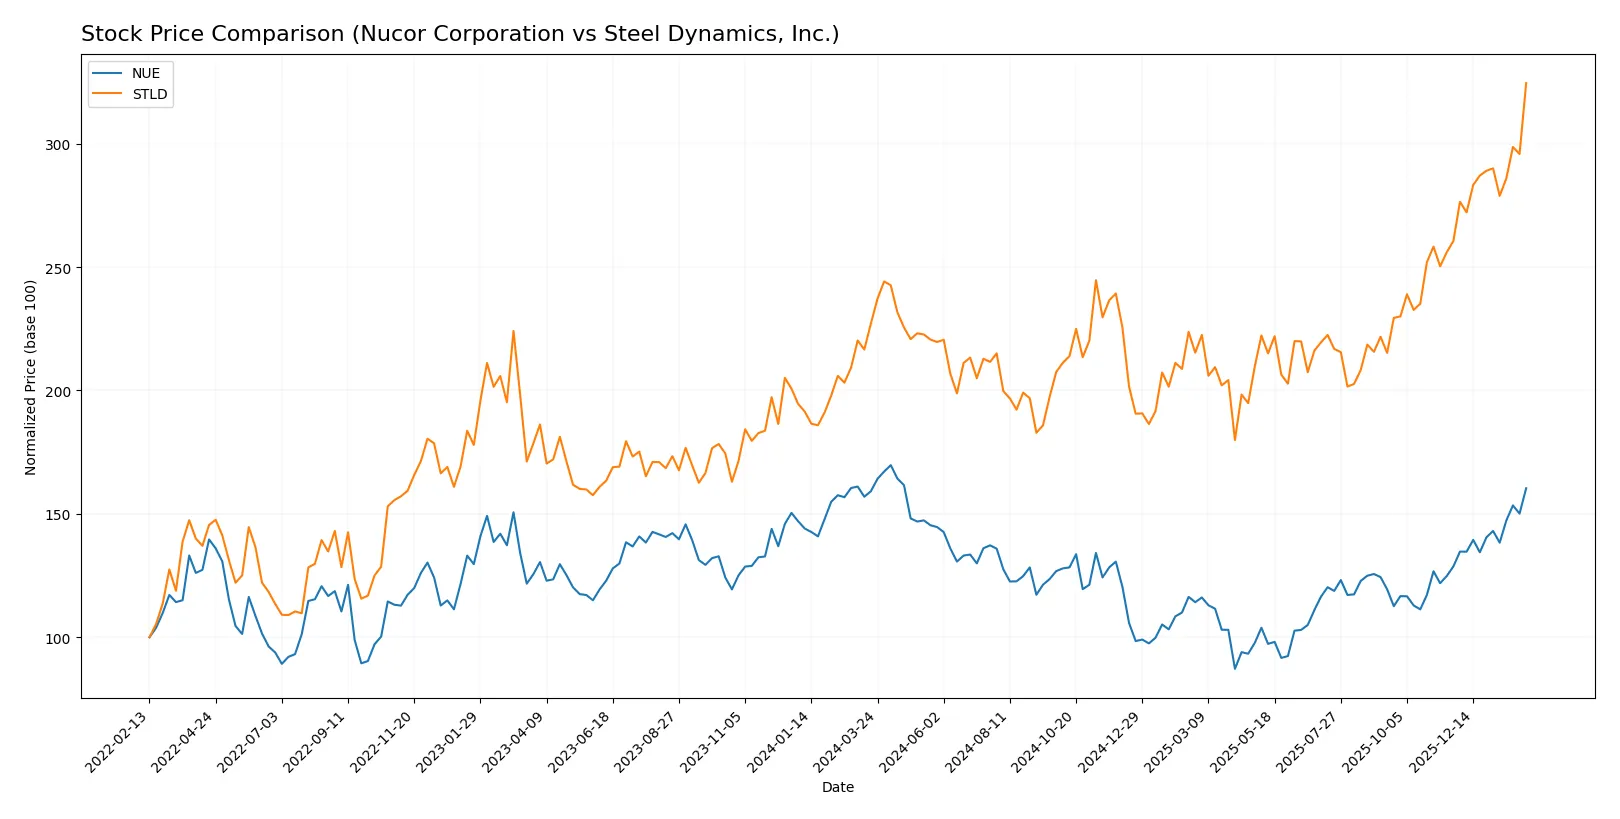
Trend Comparison
Nucor Corporation’s stock rose 0.74% overall in the past year, showing a bullish trend with accelerating momentum. Prices ranged from 103.22 to 200.97, supported by buyer dominance and increasing volume.
Steel Dynamics, Inc. outperformed with a 42.86% price increase over 12 months, also exhibiting acceleration. Its price fluctuated between 109.21 and 197.00, with stronger buyer dominance and rising volumes.
Comparatively, Steel Dynamics delivered the highest market performance, outpacing Nucor by a wide margin in total price appreciation.
Target Prices
Analysts present a bullish consensus for Nucor Corporation and Steel Dynamics, Inc., with target prices reflecting moderate upside potential.
| Company | Target Low | Target High | Consensus |
|---|---|---|---|
| Nucor Corporation | 176 | 183 | 179.67 |
| Steel Dynamics, Inc. | 165 | 194 | 179.67 |
Both stocks trade slightly above consensus targets, signaling cautious optimism but potential valuation pressure if momentum fades.

Don’t Let Luck Decide Your Entry Point
Optimize your entry points with our advanced ProRealTime indicators. You’ll get efficient buy signals with precise price targets for maximum performance. Start outperforming now!
How do institutions grade them?
This section compares recent institutional grades for Nucor Corporation and Steel Dynamics, Inc.:
Nucor Corporation Grades
The following table shows recent grades and actions from reputable grading firms for Nucor Corporation.
| Grading Company | Action | New Grade | Date |
|---|---|---|---|
| Wells Fargo | Maintain | Overweight | 2026-01-28 |
| Morgan Stanley | Downgrade | Equal Weight | 2026-01-09 |
| Wells Fargo | Maintain | Overweight | 2025-12-18 |
| Wells Fargo | Maintain | Overweight | 2025-12-15 |
| Jefferies | Maintain | Buy | 2025-12-10 |
| JP Morgan | Maintain | Overweight | 2025-12-05 |
| Wells Fargo | Upgrade | Overweight | 2025-11-14 |
| Citigroup | Maintain | Buy | 2025-10-30 |
| Wells Fargo | Maintain | Equal Weight | 2025-10-29 |
| JP Morgan | Maintain | Overweight | 2025-10-29 |
Steel Dynamics, Inc. Grades
The table below summarizes recent grades and actions from recognized grading companies for Steel Dynamics, Inc.
| Grading Company | Action | New Grade | Date |
|---|---|---|---|
| Morgan Stanley | Downgrade | Equal Weight | 2026-01-09 |
| Wells Fargo | Maintain | Overweight | 2025-12-15 |
| Jefferies | Maintain | Buy | 2025-12-10 |
| JP Morgan | Maintain | Neutral | 2025-12-05 |
| Wells Fargo | Maintain | Overweight | 2025-11-14 |
| UBS | Downgrade | Neutral | 2025-11-04 |
| Citigroup | Maintain | Buy | 2025-10-29 |
| Keybanc | Maintain | Overweight | 2025-10-27 |
| Morgan Stanley | Maintain | Overweight | 2025-10-24 |
| Wells Fargo | Maintain | Overweight | 2025-10-22 |
Which company has the best grades?
Nucor Corporation generally holds stronger grades, including multiple “Overweight” and “Buy” ratings. Steel Dynamics shows mixed grades with more “Neutral” ratings. This difference may influence investor confidence and portfolio positioning.
Risks specific to each company
The following categories identify critical pressure points and systemic threats facing Nucor Corporation and Steel Dynamics, Inc. in the 2026 market environment:
1. Market & Competition
Nucor Corporation
- Larger market cap at $43.4B supports scale advantages but faces intense competition within the US steel sector.
Steel Dynamics, Inc.
- Smaller $28.8B market cap limits scale but benefits from diversified steel fabrication and recycling operations.
2. Capital Structure & Debt
Nucor Corporation
- Low debt-to-equity ratio (0.34) and strong interest coverage (44.53) signal conservative leverage and financial stability.
Steel Dynamics, Inc.
- Higher debt-to-equity (0.47) and lower interest coverage (22.32) increase financial risk despite still manageable levels.
3. Stock Volatility
Nucor Corporation
- Beta of 1.84 indicates higher stock volatility and sensitivity to market swings compared to peers.
Steel Dynamics, Inc.
- Lower beta of 1.45 suggests more moderate stock volatility and less risk from market fluctuations.
4. Regulatory & Legal
Nucor Corporation
- Operating mostly in North America with exposure to US regulatory environment; potential risks from environmental regulations.
Steel Dynamics, Inc.
- Similar US regulatory exposure with added complexity from export activities, increasing compliance risk.
5. Supply Chain & Operations
Nucor Corporation
- Integrated steel production with direct reduced iron and scrap metal processing reduces supply chain risks.
Steel Dynamics, Inc.
- Diverse operations including metals recycling and fabrication increase complexity and operational risks.
6. ESG & Climate Transition
Nucor Corporation
- Direct reduced iron production offers advantage in lower carbon footprint relative to traditional steelmaking.
Steel Dynamics, Inc.
- Recycling focus supports ESG goals but overall carbon impact depends on manufacturing scale and processes.
7. Geopolitical Exposure
Nucor Corporation
- Primarily North American focus limits geopolitical risks but exposes company to US trade policies.
Steel Dynamics, Inc.
- Export activities increase exposure to global trade tensions and tariffs beyond North America.
Which company shows a better risk-adjusted profile?
Nucor’s most impactful risk is its high stock volatility, which may unsettle investors in turbulent markets. Steel Dynamics faces greater financial risk from higher leverage but benefits from more stable stock behavior. Given this, Nucor presents a slightly better risk-adjusted profile due to stronger capital structure and operational integration. Notably, Nucor’s superior interest coverage ratio (44.53 vs. 22.32) underpins its financial resilience amid industry cyclicality, justifying my cautious optimism.
Final Verdict: Which stock to choose?
Nucor Corporation’s superpower lies in its robust liquidity and conservative leverage, providing a solid financial cushion in volatile steel markets. However, its declining profitability signals a point of vigilance. It suits investors with an appetite for cyclical exposure but a preference for balance sheet strength.
Steel Dynamics, Inc. commands a strategic moat with its higher asset turnover and operational efficiency, delivering better returns relative to its cost of capital. Though it carries higher leverage risk than Nucor, its stronger growth profile fits well within a GARP (Growth at a Reasonable Price) framework seeking both stability and upside.
If you prioritize financial resilience and a defensive stance in cyclical sectors, Nucor’s conservative balance sheet outshines Steel Dynamics. However, if you seek growth with operational efficiency and can tolerate higher leverage, Steel Dynamics offers better stability and growth potential, albeit with increased risk.
Disclaimer: Investment carries a risk of loss of initial capital. The past performance is not a reliable indicator of future results. Be sure to understand risks before making an investment decision.
Go Further
I encourage you to read the complete analyses of Nucor Corporation and Steel Dynamics, Inc. to enhance your investment decisions: