Unilever PLC and Nu Skin Enterprises, Inc. are two prominent players in the Household & Personal Products industry, each with distinct approaches to innovation and market reach. Unilever, a global consumer goods giant, offers a broad portfolio spanning beauty, food, and home care, while Nu Skin focuses on cutting-edge beauty and wellness products with a direct sales model. This comparison aims to help investors identify which company presents the most compelling opportunity for their portfolio in 2026.
Table of contents
Companies Overview
I will begin the comparison between Unilever PLC and Nu Skin Enterprises, Inc. by providing an overview of these two companies and their main differences.
Unilever PLC Overview
Unilever PLC is a leading fast-moving consumer goods company headquartered in London, United Kingdom. It operates through three main segments: Beauty & Personal Care, Foods & Refreshment, and Home Care. The company offers a broad portfolio of well-known brands, including Dove, Knorr, and Ben & Jerry’s, focusing on household and personal products with a market capitalization of approximately 140.6B USD.
Nu Skin Enterprises, Inc. Overview
Nu Skin Enterprises, Inc., based in Provo, Utah, specializes in beauty and wellness products globally. It develops and distributes skin care systems, nutritional supplements, and weight management products under brands like Nu Skin, Pharmanex, and ageLOC. Operating with around 3,100 employees, Nu Skin focuses on direct sales through distributors and online platforms, holding a market cap near 518M USD.
Key similarities and differences
Both companies operate within the household and personal products industry, emphasizing beauty and wellness. Unilever has a diversified product range across food and home care, while Nu Skin concentrates on skin care and nutritional supplements. Unilever’s business model relies on broad market penetration and brand diversity, contrasting with Nu Skin’s direct sales and distributor-driven approach, reflected in their differing scales and market capitalizations.
Income Statement Comparison
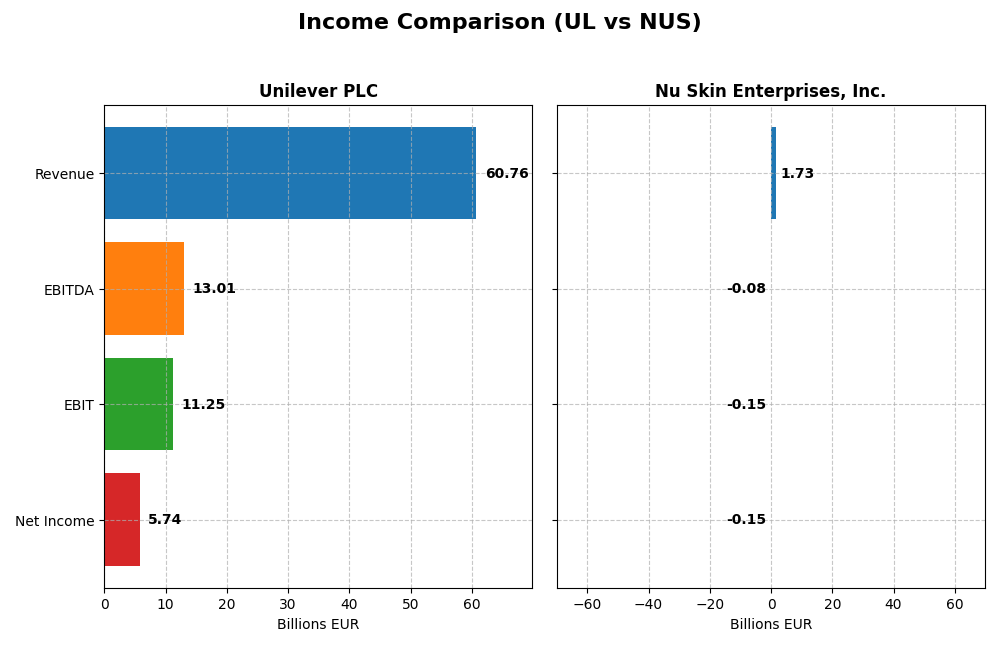
Below is a side-by-side comparison of key income statement metrics for Unilever PLC and Nu Skin Enterprises, Inc. for the fiscal year 2024.
| Metric | Unilever PLC (UL) | Nu Skin Enterprises, Inc. (NUS) |
|---|---|---|
| Market Cap | 140.6B EUR | 518.1M USD |
| Revenue | 60.8B EUR | 1.73B USD |
| EBITDA | 13.0B EUR | -78.8M USD |
| EBIT | 11.3B EUR | -149M USD |
| Net Income | 5.74B EUR | -147M USD |
| EPS | 2.30 EUR | -2.95 USD |
| Fiscal Year | 2024 | 2024 |
Income Statement Interpretations
Unilever PLC
Unilever PLC’s revenue showed a steady increase over the 2020-2024 period, growing by 19.79%, while net income experienced a modest 2.92% rise. Margins remained generally favorable, with a gross margin at 100% and an EBIT margin of 18.52% in 2024. However, the latest year saw a slowdown in revenue growth (1.94%) and a decline in net margin (-13.14%), indicating margin pressure despite improved EBIT growth.
Nu Skin Enterprises, Inc.
Nu Skin Enterprises experienced declining revenue and net income from 2020 to 2024, with overall revenue dropping by 32.92% and net income plunging by 176.61%. Gross margin remained favorable at 68.23%, but EBIT and net margins were negative and unfavorable in 2024, reflecting a loss. The most recent fiscal year saw a sharp contraction in revenue (-12.04%) and worsening profitability, with EBITDA and net margin declining significantly.
Which one has the stronger fundamentals?
Unilever displays stronger fundamentals, supported by consistent revenue growth, positive EBIT, and favorable margin metrics despite some recent margin erosion. In contrast, Nu Skin faces unfavorable trends across revenue, profitability, and margin growth, compounded by losses in the latest year. Thus, Unilever’s overall income statement profile is more robust and stable compared to Nu Skin’s deteriorating financial performance.
Financial Ratios Comparison
The table below presents the key financial ratios for Unilever PLC and Nu Skin Enterprises, Inc. based on their most recent fiscal year data for 2024.
| Ratios | Unilever PLC (UL) | Nu Skin Enterprises, Inc. (NUS) |
|---|---|---|
| ROE | 28.7% | -22.5% |
| ROIC | 11.1% | -10.4% |
| P/E | 23.9 | -2.33 |
| P/B | 6.87 | 0.53 |
| Current Ratio | 0.76 | 1.82 |
| Quick Ratio | 0.56 | 1.17 |
| D/E | 1.53 | 0.73 |
| Debt-to-Assets | 38.4% | 32.6% |
| Interest Coverage | 8.41 | -5.74 |
| Asset Turnover | 0.76 | 1.18 |
| Fixed Asset Turnover | 5.21 | 3.71 |
| Payout ratio | 75.2% | -8.1% |
| Dividend yield | 3.14% | 3.49% |
Interpretation of the Ratios
Unilever PLC
Unilever demonstrates a slightly favorable ratio profile with strong return on equity (28.73%) and return on invested capital (11.12%), supported by a low weighted average cost of capital (4.42%). However, its liquidity ratios like current ratio (0.76) and debt to equity (1.53) are unfavorable, indicating potential short-term financial stress. The dividend yield of 3.14% is well covered, suggesting stable shareholder returns.
Nu Skin Enterprises, Inc.
Nu Skin’s ratios show a mixed picture with favorable liquidity and valuation metrics, including a current ratio of 1.82 and price-to-book ratio of 0.53. However, profitability ratios such as net margin (-8.46%) and return on equity (-22.5%) are unfavorable, reflecting operational challenges. The company pays dividends with a yield of 3.49%, but negative earnings raise concerns about sustainability.
Which one has the best ratios?
Nu Skin exhibits a more favorable overall ratio profile in terms of liquidity and valuation, yet suffers from negative profitability metrics. Unilever offers stronger profitability and stable returns but faces weaker liquidity and leverage ratios. The assessment depends on prioritizing either profitability strength or liquidity and valuation metrics.
Strategic Positioning
This section compares the strategic positioning of Unilever PLC and Nu Skin Enterprises, Inc. regarding market position, key segments, and exposure to technological disruption:
Unilever PLC
- Leading global FMCG player with strong brand portfolio; faces moderate competitive pressure in consumer goods.
- Operates in Beauty & Personal Care, Foods & Refreshment, Home Care segments with diverse product offerings.
- Limited explicit exposure to tech disruption; product innovation in skin care and nutritional supplements.
Nu Skin Enterprises, Inc.
- Smaller market cap with direct selling model; faces competition in beauty and wellness sectors, including retail stores.
- Focuses on beauty, wellness, nutritional supplements, and skin care devices; sales via distributors and direct channels.
- Product development includes advanced skin care systems and nutritional supplements, reflecting some tech-driven innovation.
Unilever PLC vs Nu Skin Enterprises, Inc. Positioning
Unilever exhibits a diversified portfolio across several consumer goods segments, providing broad market exposure. Nu Skin has a more concentrated focus on beauty and wellness products, relying heavily on direct sales and product innovation. Diversification may reduce risk, while concentration might increase dependence on niche markets.
Which has the best competitive advantage?
Unilever shows a slightly favorable moat with value creation despite declining profitability, indicating some competitive advantage. Nu Skin’s very unfavorable moat with value destruction suggests weaker competitive positioning and profitability challenges.
Stock Comparison
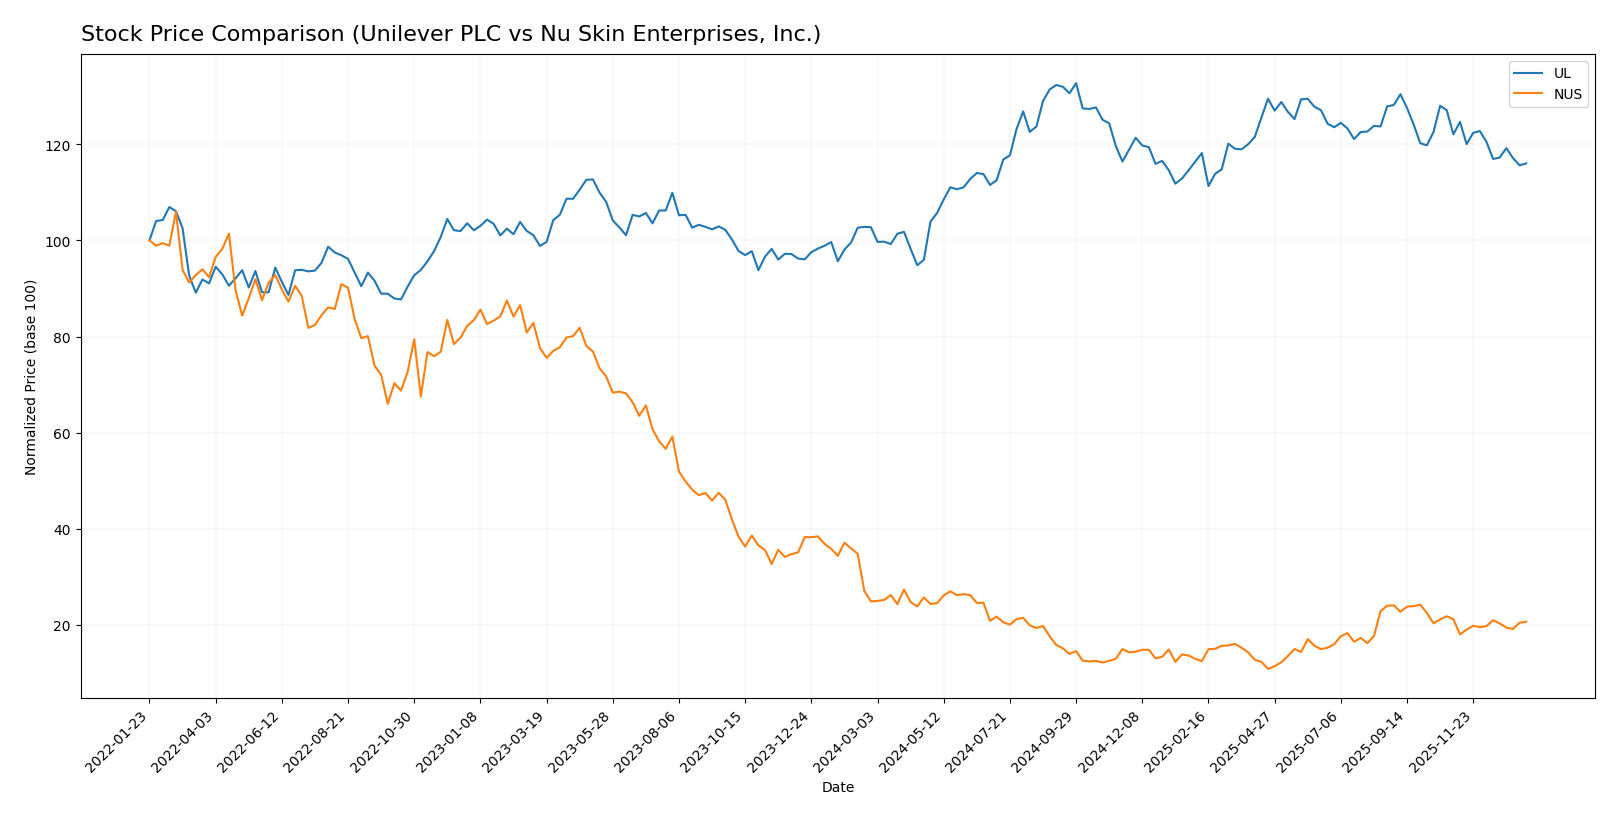
The past year revealed contrasting dynamics between Unilever PLC and Nu Skin Enterprises, Inc., with Unilever showing a strong bullish trend despite recent deceleration, while Nu Skin faced a sustained bearish trajectory with accelerating losses.
Trend Analysis
Unilever PLC experienced a bullish trend over the past 12 months with a 12.92% price increase, although the upward momentum has decelerated recently, marked by a -4.96% decline in the last two and a half months.
Nu Skin Enterprises, Inc. endured a bearish trend with a -16.93% price decline over the year, accelerating losses despite a slight recent stabilization showing a marginal positive slope but still a -2.52% drop in the recent period.
Comparing both stocks, Unilever delivered the highest market performance over the past 12 months with a positive 12.92% gain against Nu Skin’s -16.93% loss, reflecting stronger investor demand and overall growth.
Target Prices
The current analyst consensus shows moderate upside potential for these consumer defensive stocks.
| Company | Target High | Target Low | Consensus |
|---|---|---|---|
| Unilever PLC | 71 | 60.1 | 65.55 |
| Nu Skin Enterprises, Inc. | 11 | 11 | 11 |
Analysts expect Unilever’s price to trade slightly above its current 64.42 USD level, indicating modest growth potential. Nu Skin’s consensus target of 11 USD suggests a moderate upside from its present 10.45 USD price.
Analyst Opinions Comparison
This section compares analysts’ ratings and grades for Unilever PLC and Nu Skin Enterprises, Inc.:
Rating Comparison
Unilever PLC Rating
- Rating: B+, classified as Very Favorable.
- Discounted Cash Flow Score: 5, Very Favorable valuation.
- ROE Score: 5, Very Favorable efficiency in equity usage.
- ROA Score: 4, Favorable asset utilization.
- Debt To Equity Score: 1, Very Unfavorable high leverage.
- Overall Score: 3, Moderate overall financial standing.
Nu Skin Enterprises, Inc. Rating
- Rating: A, classified as Very Favorable.
- Discounted Cash Flow Score: 4, Favorable valuation.
- ROE Score: 4, Favorable efficiency in equity usage.
- ROA Score: 4, Favorable asset utilization.
- Debt To Equity Score: 3, Moderate leverage risk.
- Overall Score: 4, Favorable overall financial standing.
Which one is the best rated?
Based strictly on the data, Nu Skin Enterprises holds a higher overall rating (A vs. B+) and better overall score (4 vs. 3) than Unilever. Nu Skin’s more balanced scores across financial metrics position it as the better-rated company.
Scores Comparison
Here is a comparison of the Altman Z-Score and Piotroski Score for Unilever PLC and Nu Skin Enterprises, Inc.:
Unilever PLC Scores
- Altman Z-Score: 4.85, indicating a safe zone for bankruptcy risk.
- Piotroski Score: 6, reflecting average financial strength.
Nu Skin Enterprises Scores
- Altman Z-Score: 3.94, also in the safe zone for bankruptcy risk.
- Piotroski Score: 8, reflecting very strong financial strength.
Which company has the best scores?
Nu Skin shows a slightly lower bankruptcy risk with a 3.94 Altman Z-Score and a stronger Piotroski Score of 8, compared to Unilever’s 4.85 and 6 respectively. This suggests Nu Skin has stronger financial health based on these metrics.
Grades Comparison
The following presents a comparison of recent grades assigned to Unilever PLC and Nu Skin Enterprises, Inc.:
Unilever PLC Grades
This table shows recent grading updates from recognized financial institutions for Unilever PLC:
| Grading Company | Action | New Grade | Date |
|---|---|---|---|
| Erste Group | Downgrade | Hold | 2024-11-19 |
| B of A Securities | Upgrade | Buy | 2024-08-22 |
| JP Morgan | Upgrade | Overweight | 2024-05-23 |
| Argus Research | Maintain | Buy | 2024-05-08 |
| Morgan Stanley | Downgrade | Underweight | 2024-02-27 |
| Bernstein | Upgrade | Market Perform | 2022-03-14 |
| Bernstein | Upgrade | Market Perform | 2022-03-13 |
| Bernstein | Upgrade | Market Perform | 2021-11-01 |
| Bernstein | Upgrade | Market Perform | 2021-10-31 |
| Deutsche Bank | Downgrade | Hold | 2021-09-16 |
Overall, grades for Unilever PLC show a mix of upgrades and downgrades, with a general consensus leaning toward a Hold rating.
Nu Skin Enterprises, Inc. Grades
This table displays the latest grades from verified graders for Nu Skin Enterprises, Inc.:
| Grading Company | Action | New Grade | Date |
|---|---|---|---|
| DA Davidson | Maintain | Neutral | 2024-12-20 |
| Citigroup | Maintain | Neutral | 2024-10-22 |
| DA Davidson | Maintain | Neutral | 2024-08-12 |
| Citigroup | Maintain | Neutral | 2024-08-09 |
| DA Davidson | Maintain | Neutral | 2024-05-09 |
| DA Davidson | Maintain | Neutral | 2024-01-05 |
| Stifel | Maintain | Hold | 2023-10-16 |
| Stifel | Maintain | Hold | 2023-10-15 |
| Citigroup | Maintain | Neutral | 2023-09-29 |
| Citigroup | Maintain | Neutral | 2023-09-28 |
Grades for Nu Skin Enterprises consistently reflect a Neutral or Hold stance, with no recent upgrades or downgrades.
Which company has the best grades?
Unilever PLC has received a broader range of grades including Buy and Overweight ratings, whereas Nu Skin Enterprises’ grades have remained steady at Neutral or Hold. Investors might interpret Unilever’s mixed but occasionally stronger grades as signals of varied analyst confidence compared to Nu Skin’s stable but less optimistic outlook.
Strengths and Weaknesses
Below is a comparison table highlighting the key strengths and weaknesses of Unilever PLC (UL) and Nu Skin Enterprises, Inc. (NUS) based on their most recent financial and strategic data.
| Criterion | Unilever PLC (UL) | Nu Skin Enterprises, Inc. (NUS) |
|---|---|---|
| Diversification | Highly diversified global consumer goods portfolio, reducing risk exposure | Less diversified, mainly focused on personal care and wellness products |
| Profitability | Favorable ROIC of 11.12%, ROE at 28.73%, consistent value creation but with slight declining trend | Negative profitability metrics (ROIC -10.4%, ROE -22.5%), value destruction and declining profitability |
| Innovation | Moderate innovation with steady product updates in consumer segments | Innovation focused on wellness products but challenged by profitability issues |
| Global presence | Strong global footprint with well-established brands across many markets | More limited global presence, mostly reliant on select markets |
| Market Share | Large market share in consumer goods with strong brand recognition | Smaller market share, niche in personal care and wellness sectors |
Key takeaways: Unilever demonstrates solid profitability and diversification with a broad global presence, despite a slight decline in profitability trends. Nu Skin shows favorable liquidity and asset turnover but faces significant challenges with negative profitability and value destruction, raising caution for investors.
Risk Analysis
Below is a table summarizing the key risk factors for Unilever PLC and Nu Skin Enterprises, Inc. based on their latest financial and operational data for 2024:
| Metric | Unilever PLC (UL) | Nu Skin Enterprises, Inc. (NUS) |
|---|---|---|
| Market Risk | Low beta at 0.22, stable consumer defensive sector | Higher beta at 0.98, more volatile market exposure |
| Debt level | Moderate leverage, Debt/Equity 1.53 (unfavorable) | Moderate leverage, Debt/Equity 0.73 (neutral) |
| Regulatory Risk | Moderate; operates globally with complex regulations | Moderate; direct selling model faces scrutiny in some regions |
| Operational Risk | Large scale, diverse product lines mitigate risks | Smaller scale, reliance on distributor network |
| Environmental Risk | Increasing focus on sustainability, risks from supply chain | Moderate; less emphasis on environmental initiatives |
| Geopolitical Risk | Exposure to global markets, sensitive to trade policies | US and China operations, geopolitical tensions impact |
Unilever’s main risks revolve around moderate debt levels and supply chain complexities in a global regulatory environment, though its low market volatility and strong brand portfolio provide resilience. Nu Skin faces higher market volatility and operational risks due to its smaller size and direct selling model, but benefits from a strong liquidity position and favorable financial scores. Investors should weigh Unilever’s leverage concerns against Nu Skin’s profitability challenges and market sensitivity.
Which Stock to Choose?
Unilever PLC (UL) shows a favorable income evolution marked by strong gross and EBIT margins, despite modest revenue growth. Its financial ratios are slightly favorable overall, with high ROE and ROIC but some concerns around liquidity and debt levels. The company maintains a solid B+ rating and demonstrates value creation, though with a declining ROIC trend.
Nu Skin Enterprises, Inc. (NUS) faces an unfavorable income evolution with negative net margin and declining revenue and profit metrics. However, its financial ratios reveal several strengths, including favorable valuation multiples and liquidity ratios. NUS holds an A rating and a very strong Piotroski score but is currently destroying value with a declining ROIC.
For investors, UL might appear more suitable for those prioritizing stable profitability and value creation, while NUS could appeal to those with a higher risk tolerance focused on potential turnaround or undervalued assets. The contrasting ratings and income profiles suggest different investment interpretations based on individual risk and strategy preferences.
Disclaimer: Investment carries a risk of loss of initial capital. The past performance is not a reliable indicator of future results. Be sure to understand risks before making an investment decision.
Go Further
I encourage you to read the complete analyses of Unilever PLC and Nu Skin Enterprises, Inc. to enhance your investment decisions: