Home > Comparison > Consumer Defensive > PG vs NUS
The strategic rivalry between The Procter & Gamble Company and Nu Skin Enterprises defines the current trajectory of the consumer defensive sector. Procter & Gamble operates as a capital-intensive giant with a broad portfolio in household and personal products, while Nu Skin focuses on high-margin, direct-selling beauty and wellness products. This analysis explores their contrasting growth and value dynamics to identify which trajectory offers superior risk-adjusted returns for a diversified portfolio.
Table of contents
Companies Overview
The Procter & Gamble Company and Nu Skin Enterprises, Inc. are key players in the global household and personal products market. Both command unique consumer bases while navigating evolving industry demands.
The Procter & Gamble Company: Global Consumer Goods Powerhouse
P&G dominates the consumer packaged goods sector with a diverse portfolio spanning beauty, grooming, health care, fabric care, and family care. Its core revenue arises from iconic brands like Gillette, Tide, and Pampers sold worldwide through mass retail and e-commerce. In 2026, P&G’s strategic focus remains on innovation and expanding digital sales channels to strengthen its consumer reach.
Nu Skin Enterprises, Inc.: Specialized Beauty and Wellness Innovator
Nu Skin leads in beauty and wellness with an emphasis on anti-aging skincare and nutritional supplements, marketed under brands such as ageLOC and Pharmanex. The company’s revenue engine centers on direct sales and distributor networks, alongside retail operations in China. Its latest strategy prioritizes product research and international expansion to capture niche health-conscious consumers.
Strategic Collision: Similarities & Divergences
Both companies operate within the consumer defensive sector but differ sharply in approach. P&G pursues a broad portfolio diversification and mass market penetration, while Nu Skin opts for a focused, direct selling model targeting wellness trends. Their primary battleground is the personal care segment, where brand loyalty and innovation drive market share. These strategic contrasts create distinctly different risk and growth profiles for investors.
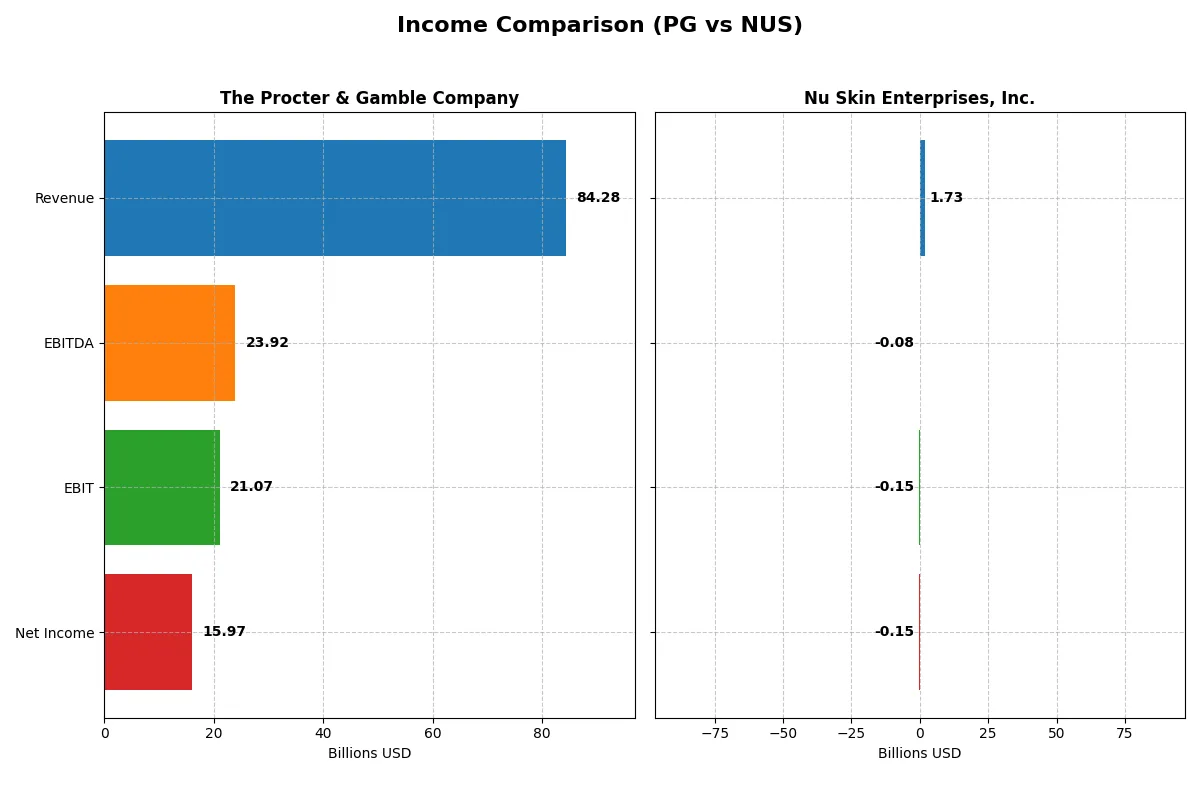
Income Statement Comparison
This data dissects the core profitability and scalability of both corporate engines to reveal who dominates the bottom line:
| Metric | The Procter & Gamble Company (PG) | Nu Skin Enterprises, Inc. (NUS) |
|---|---|---|
| Revenue | 84.3B | 1.73B |
| Cost of Revenue | 41.2B | 550M |
| Operating Expenses | 22.7B | 1.33B |
| Gross Profit | 43.1B | 1.18B |
| EBITDA | 23.9B | -79M |
| EBIT | 21.1B | -149M |
| Interest Expense | 907M | 26M |
| Net Income | 16.0B | -147M |
| EPS | 6.67 | -2.95 |
| Fiscal Year | 2025 | 2024 |
Income Statement Analysis: The Bottom-Line Duel
The following income statement comparison reveals which company converts revenue into profit most efficiently under current market conditions.
The Procter & Gamble Company Analysis
P&G’s revenue modestly grew by 0.3% to 84.3B in 2025, with net income rising 7.5% to 15.97B, reflecting strong earnings momentum. The gross margin remains healthy at 51.2%, while the net margin improved to 19%. Operating efficiency drives steady EBIT growth, signaling robust profitability despite slight revenue stagnation.
Nu Skin Enterprises, Inc. Analysis
Nu Skin’s revenue declined 12% to 1.73B in 2024, with a net loss of 147M, reversing prior profitability. Though the gross margin stays high at 68.2%, negative EBIT margin (-8.6%) reveals operational struggles. The sharp contraction in revenue and earnings signals deteriorating business momentum and rising cost pressures.
Margin Strength vs. Revenue Stability
P&G clearly outperforms Nu Skin by maintaining solid revenue growth and expanding net margins. Nu Skin’s shrinking top line and escalating losses highlight significant operational challenges. For investors, P&G’s profile offers dependable profitability and margin resilience, while Nu Skin’s volatility presents elevated risk without clear recovery signs.
Financial Ratios Comparison
These vital ratios act as a diagnostic tool to expose the underlying fiscal health, valuation premiums, and capital efficiency of the companies compared below:
| Ratios | The Procter & Gamble Company (PG) | Nu Skin Enterprises, Inc. (NUS) |
|---|---|---|
| ROE | 30.7% | -22.5% |
| ROIC | 16.5% | -10.4% |
| P/E | 24.5 | -2.33 |
| P/B | 7.52 | 0.53 |
| Current Ratio | 0.70 | 1.82 |
| Quick Ratio | 0.49 | 1.17 |
| D/E | 0.68 | 0.73 |
| Debt-to-Assets | 28.3% | 32.6% |
| Interest Coverage | 22.5 | -5.74 |
| Asset Turnover | 0.67 | 1.18 |
| Fixed Asset Turnover | 3.53 | 3.71 |
| Payout ratio | 61.8% | -8.14% |
| Dividend yield | 2.52% | 3.49% |
| Fiscal Year | 2025 | 2024 |
Efficiency & Valuation Duel: The Vital Signs
Financial ratios serve as a company’s DNA, exposing operational strengths and hidden risks critical for informed investment decisions.
The Procter & Gamble Company
P&G displays robust profitability with a 30.7% ROE and 18.95% net margin, signaling strong operational efficiency. Its P/E ratio at 24.5 suggests a fairly valued stock, though the high P/B of 7.5 is stretched. The company returns value via a 2.5% dividend yield, reflecting shareholder-friendly discipline amid solid capital allocation.
Nu Skin Enterprises, Inc.
Nu Skin reports negative profitability with a -22.5% ROE and -8.5% net margin, indicating operational challenges. Its P/E ratio is negative, but low P/B at 0.53 hints at undervaluation. The firm maintains a 3.5% dividend yield despite weak earnings, possibly signaling a defensive income strategy amid reinvestment constraints.
Profitability Strength vs. Valuation Risk
P&G balances strong profitability with moderate valuation risk, offering operational safety and steady dividends. Nu Skin’s undervalued stock masks significant profitability weakness and negative returns, posing higher risk. Investors seeking stable income and efficiency should gravitate toward P&G’s profile, while risk-tolerant income seekers might consider Nu Skin.
Which one offers the Superior Shareholder Reward?
I see Procter & Gamble (PG) delivers a steady 2.5% dividend yield with a payout ratio around 62%, backed by strong FCF coverage near 80%. PG also sustains meaningful buybacks, enhancing total return. Nu Skin (NUS) offers a higher 3.5% yield but suffers negative net margins and volatile earnings. Its payout ratio exceeds 700% recently, signaling dividend risk. NUS’s buyback activity is modest and less consistent. PG’s disciplined distribution, robust cash flow, and balanced capital allocation ensure sustainable long-term value. I judge PG superior for reliable total shareholder reward in 2026.
Comparative Score Analysis: The Strategic Profile
The radar chart reveals the fundamental DNA and trade-offs of The Procter & Gamble Company and Nu Skin Enterprises, highlighting their distinct financial strengths and valuation profiles:
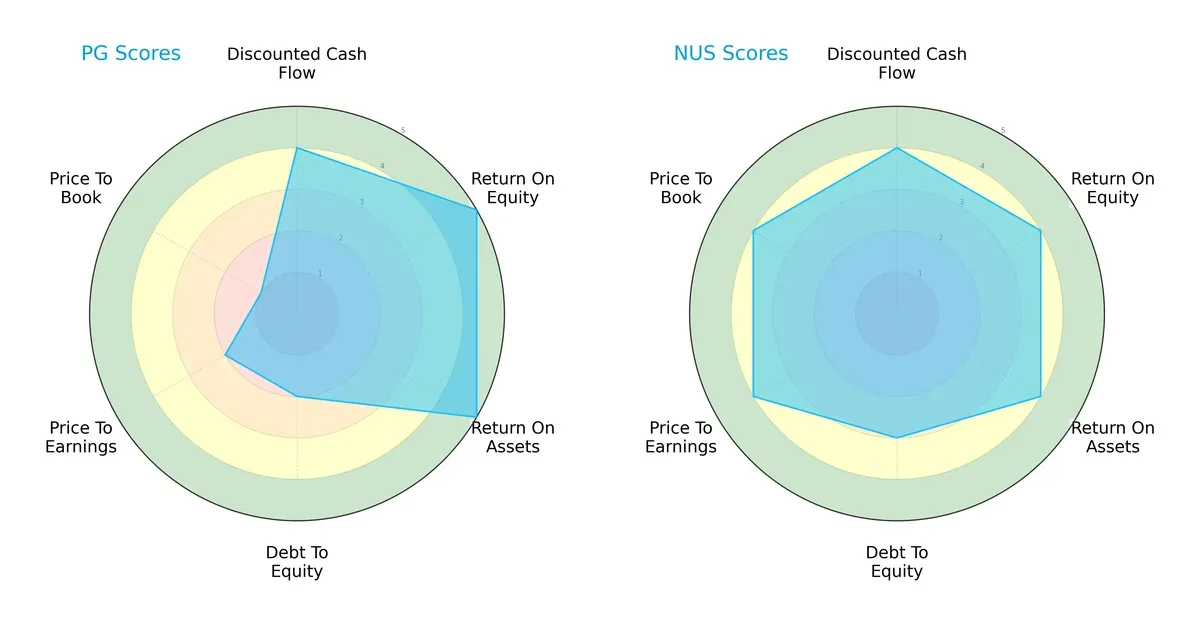
Procter & Gamble scores higher on profitability metrics with a 5 in ROE and ROA, signaling efficient asset and equity use. Nu Skin holds an edge in valuation and overall balance, scoring 4 in PE, PB, and debt-to-equity. P&G’s low price-to-book score (1) flags potential overvaluation or intangible assets risk, while Nu Skin offers a more balanced and favorable profile, reflecting growth and value investing appeal.
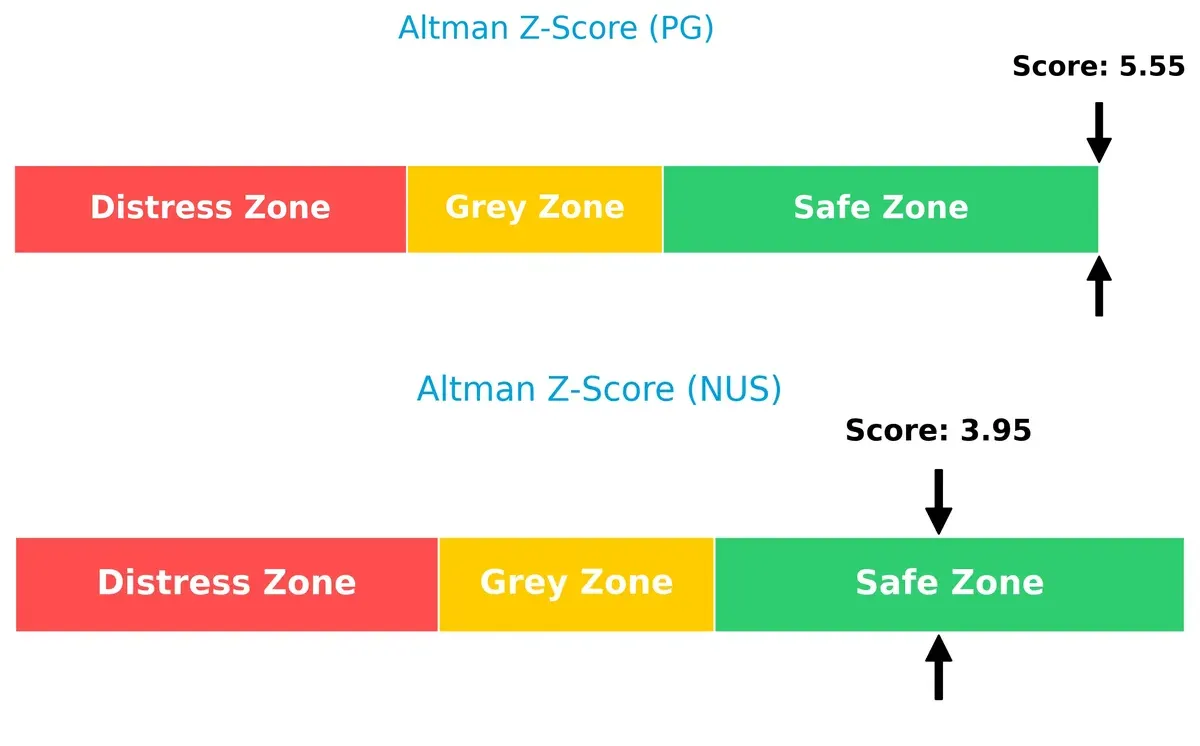
Bankruptcy Risk: Solvency Showdown
The Procter & Gamble Company’s Altman Z-Score of 5.55 surpasses Nu Skin’s 3.95, both residing in the safe zone, indicating strong solvency and low bankruptcy risk in this cycle:
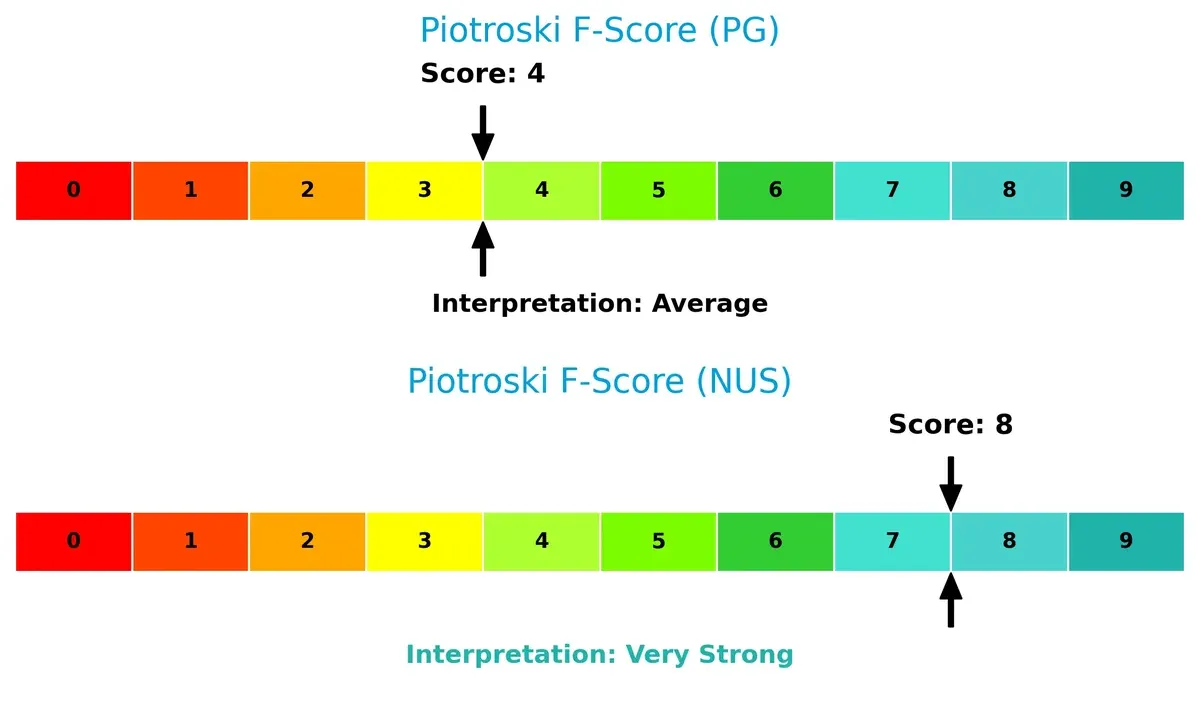
Financial Health: Quality of Operations
Nu Skin’s Piotroski F-Score of 8 signals very strong financial health, outperforming Procter & Gamble’s average score of 4, which suggests caution regarding internal operational metrics:
How are the two companies positioned?
This section dissects the operational DNA of PG and NUS by comparing their revenue distribution by segment and internal dynamics—strengths and weaknesses. The final objective confronts their economic moats to reveal which business model offers the most resilient, sustainable competitive advantage in today’s market.
Revenue Segmentation: The Strategic Mix
This visual comparison dissects how The Procter & Gamble Company and Nu Skin Enterprises diversify their income streams and where their primary sector bets lie:
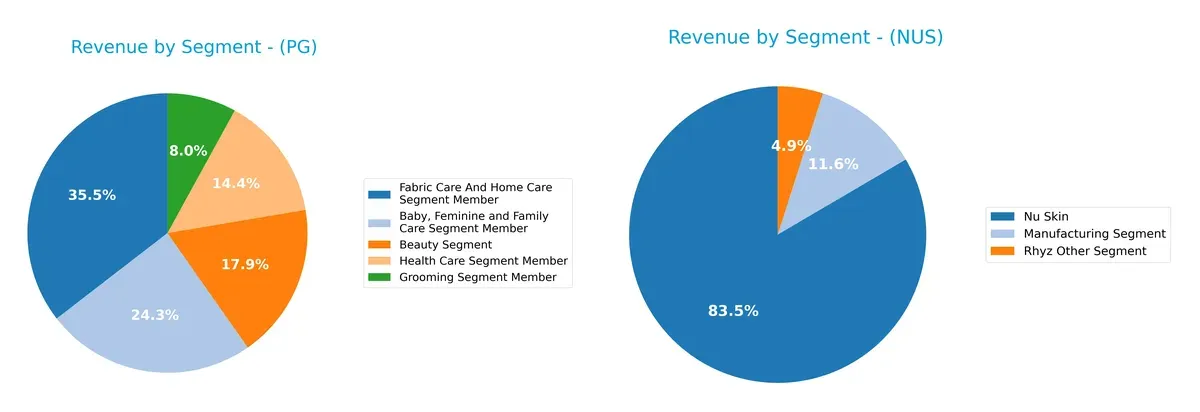
Procter & Gamble displays a balanced revenue mix with its largest segment, Fabric Care and Home Care, at $29.6B, supported by Baby, Feminine & Family Care at $20.2B and Beauty at $14.9B. Nu Skin, however, pivots heavily on its Nu Skin segment, which dwarfs others at $1.45B, while Manufacturing and smaller segments contribute modestly. P&G’s diversification reduces concentration risk; Nu Skin’s reliance signals vulnerability but also focused brand strength.
Strengths and Weaknesses Comparison
This table compares the strengths and weaknesses of The Procter & Gamble Company (PG) and Nu Skin Enterprises, Inc. (NUS):
PG Strengths
- Diverse product segments with strong revenues across five categories
- Favorable profitability ratios with 18.95% net margin and 30.71% ROE
- Strong global presence with roughly equal US and Non-US revenue
- Favorable capital structure with 16.47% ROIC exceeding 5.41% WACC
- Solid dividend yield at 2.52%
NUS Strengths
- Favorable liquidity with current ratio 1.82 and quick ratio 1.17
- Favorable valuation metrics including low P/E and P/B ratios
- Diverse geographic revenue across Americas, Europe, Asia Pacific
- Favorable asset turnover and fixed asset turnover ratios
- Higher dividend yield at 3.49%
PG Weaknesses
- Low liquidity ratios with current ratio 0.7 and quick ratio 0.49
- Unfavorable high price-to-book ratio of 7.52
- Moderate debt level with D/E neutral at 0.68
- Neutral P/E ratio indicating limited growth expectations
- Market concentration with large revenue dependence on few segments
NUS Weaknesses
- Negative profitability with -8.46% net margin and -22.5% ROE
- Negative interest coverage ratio at -5.63 indicating financial stress
- Unfavorable returns with -10.4% ROIC below 6.36% WACC
- Smaller scale and narrower product diversification
- Higher debt-to-assets ratio at 32.56% with neutral status
Both companies show favorable overall financial profiles but differ sharply in profitability and liquidity. PG’s strengths lie in stable profits and global diversification, while NUS benefits from better liquidity and valuation. Each faces distinct challenges affecting strategic priorities.
The Moat Duel: Analyzing Competitive Defensibility
A structural moat is the only true shield against competition eroding long-term profits. Let’s dissect the moats of these two players:
The Procter & Gamble Company: Brand Power and Scale Moat
I see P&G’s moat rooted in strong brand intangible assets and economies of scale. Its 25% EBIT margin and 11% ROIC premium over WACC show efficient capital use. New product innovations and geographic diversification in 2026 will likely reinforce this moat.
Nu Skin Enterprises, Inc.: Niche Innovation with Fragile Moat
Nu Skin relies on product innovation and direct selling, but its negative EBIT margin and sharply declining ROIC reveal a weakening moat. Unlike P&G, it struggles to sustain profitability. Expansion into Asia-Pacific markets offers some upside, yet risks remain high.
Moat Showdown: Brand Dominance vs. Innovation Fragility
P&G commands a wider, deeper moat with stable margins and growing ROIC, reflecting enduring competitive advantages. Nu Skin’s shrinking profitability and negative ROIC mark a fragile position. P&G stands far better poised to defend market share in 2026.
Which stock offers better returns?
The past year saw The Procter & Gamble Company’s stock decline overall but gain momentum recently, while Nu Skin Enterprises, Inc. experienced a steeper decline with modest late-stage recovery.
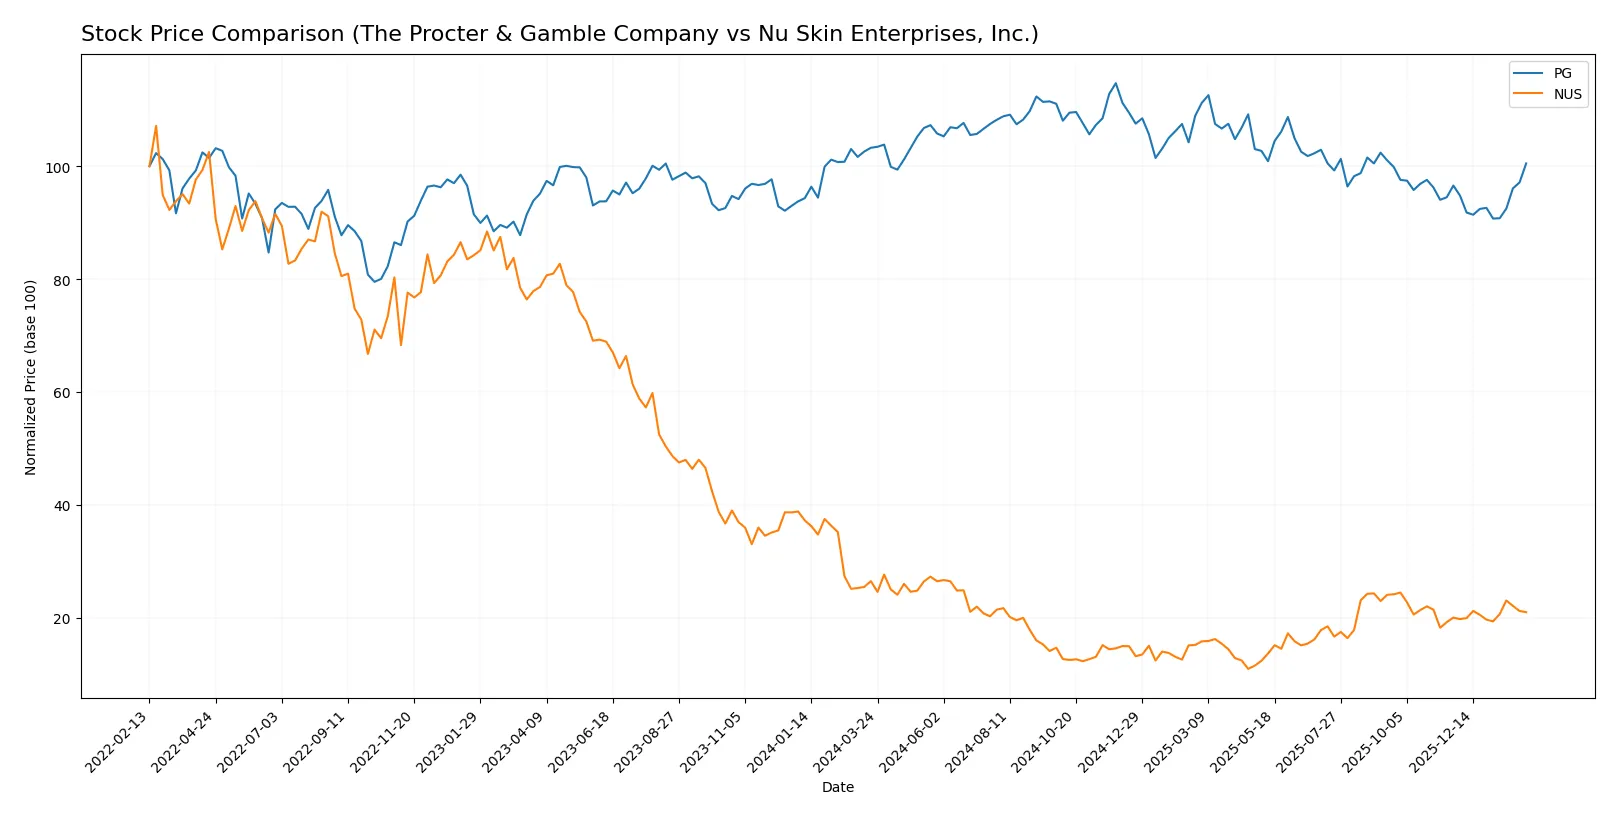
Trend Comparison
The Procter & Gamble Company’s stock fell 2.69% over the past 12 months, marking a bearish trend with accelerating decline. It ranged between 141.79 and 179.26, showing volatility with an 8.86 standard deviation.
Nu Skin Enterprises, Inc. dropped sharply by 20.75% over the same period, reflecting a bearish trend with accelerating loss. Its price fluctuated between 5.48 and 13.83, but volatility remained low at 2.29 standard deviation.
Comparing both, Procter & Gamble’s smaller decline and stronger recent rebound outperform Nu Skin’s deeper losses, delivering relatively higher market performance over the year.
Target Prices
Analysts present a clear target consensus for Procter & Gamble and Nu Skin Enterprises.
| Company | Target Low | Target High | Consensus |
|---|---|---|---|
| The Procter & Gamble Company | 150 | 179 | 165.67 |
| Nu Skin Enterprises, Inc. | 11 | 11 | 11 |
The consensus target for Procter & Gamble sits about 5% above its current price of $157.37, signaling modest upside potential. Nu Skin’s target matches its $10.50 price, indicating a neutral outlook from analysts.

Don’t Let Luck Decide Your Entry Point
Optimize your entry points with our advanced ProRealTime indicators. You’ll get efficient buy signals with precise price targets for maximum performance. Start outperforming now!
How do institutions grade them?
The following tables summarize recent institutional grades for The Procter & Gamble Company and Nu Skin Enterprises, Inc.:
The Procter & Gamble Company Grades
Below are the latest grades from established financial institutions for Procter & Gamble:
| Grading Company | Action | New Grade | Date |
|---|---|---|---|
| TD Cowen | Downgrade | Hold | 2026-01-27 |
| Wells Fargo | Maintain | Overweight | 2026-01-23 |
| UBS | Maintain | Buy | 2026-01-23 |
| JP Morgan | Upgrade | Overweight | 2026-01-23 |
| UBS | Maintain | Buy | 2026-01-14 |
| TD Cowen | Maintain | Buy | 2026-01-08 |
| Wells Fargo | Maintain | Overweight | 2026-01-05 |
| JP Morgan | Maintain | Neutral | 2025-12-18 |
| Jefferies | Upgrade | Buy | 2025-12-17 |
| JP Morgan | Maintain | Neutral | 2025-10-27 |
Nu Skin Enterprises, Inc. Grades
Below are the most recent grades from recognized institutions for Nu Skin Enterprises:
| Grading Company | Action | New Grade | Date |
|---|---|---|---|
| DA Davidson | Maintain | Neutral | 2024-12-20 |
| Citigroup | Maintain | Neutral | 2024-10-22 |
| DA Davidson | Maintain | Neutral | 2024-08-12 |
| Citigroup | Maintain | Neutral | 2024-08-09 |
| DA Davidson | Maintain | Neutral | 2024-05-09 |
| DA Davidson | Maintain | Neutral | 2024-01-05 |
| Stifel | Maintain | Hold | 2023-10-16 |
| Stifel | Maintain | Hold | 2023-10-15 |
| Citigroup | Maintain | Neutral | 2023-09-29 |
| Citigroup | Maintain | Neutral | 2023-09-28 |
Which company has the best grades?
Procter & Gamble consistently earns Buy and Overweight ratings from top firms, signaling relatively strong confidence. Nu Skin’s grades remain Neutral or Hold, showing less enthusiasm. Investors may perceive P&G as a stronger candidate for growth or stability based on these assessments.
Risks specific to each company
In the challenging 2026 market environment, the following categories identify critical pressure points and systemic threats facing both The Procter & Gamble Company and Nu Skin Enterprises, Inc.:
1. Market & Competition
The Procter & Gamble Company
- Dominates with strong brand portfolio but faces fierce competition in mature markets.
Nu Skin Enterprises, Inc.
- Faces intense competition in direct sales and niche wellness segments, impacting margins.
2. Capital Structure & Debt
The Procter & Gamble Company
- Maintains moderate leverage with favorable interest coverage (23.23x), signaling strong debt management.
Nu Skin Enterprises, Inc.
- Slightly higher leverage with negative interest coverage (-5.63x), indicating financial stress.
3. Stock Volatility
The Procter & Gamble Company
- Low beta (0.38) shows defensive stock with lower volatility than the market.
Nu Skin Enterprises, Inc.
- Beta around 1.01 suggests market-level volatility, increasing risk for investors.
4. Regulatory & Legal
The Procter & Gamble Company
- Operates globally with exposure to complex regulations but has robust compliance systems.
Nu Skin Enterprises, Inc.
- Smaller scale and international presence increase vulnerability to regulatory changes, especially in China.
5. Supply Chain & Operations
The Procter & Gamble Company
- Large, diversified supply chain with some risks from raw material inflation and logistics disruptions.
Nu Skin Enterprises, Inc.
- More concentrated supply chain and reliance on distributors heighten operational risks.
6. ESG & Climate Transition
The Procter & Gamble Company
- Invests heavily in sustainability initiatives, aligning with investor expectations and regulatory trends.
Nu Skin Enterprises, Inc.
- ESG efforts less mature, exposing the company to reputational and transition risks.
7. Geopolitical Exposure
The Procter & Gamble Company
- Broad global footprint buffers geopolitical shocks but still vulnerable to trade tensions.
Nu Skin Enterprises, Inc.
- Significant exposure to China retail market increases geopolitical risk.
Which company shows a better risk-adjusted profile?
The Procter & Gamble Company’s dominant market presence, strong debt coverage, and low stock volatility provide a more stable risk-adjusted profile. Nu Skin faces acute risks from financial stress, higher volatility, and geopolitical exposure. P&G’s robust interest coverage and safer liquidity ratios contrast sharply with Nu Skin’s negative interest coverage and higher leverage, underscoring P&G’s superior risk resilience in 2026.
Final Verdict: Which stock to choose?
The Procter & Gamble Company (PG) shines with a robust economic moat characterized by strong capital efficiency and consistent value creation. Its core superpower lies in sustainable profitability and a resilient brand portfolio. The main point of vigilance remains its stretched liquidity ratios, which could pressure short-term flexibility. PG fits well in a conservative or dividend-growth portfolio.
Nu Skin Enterprises, Inc. (NUS) offers a strategic moat rooted in a lean asset base and attractive valuation multiples, appealing for value seekers. Its safety profile, however, is notably weaker with declining profitability and a troubling negative ROIC trend. NUS might suit a speculative or turnaround-focused portfolio willing to accept elevated operational risks.
If you prioritize durable competitive advantage and stable cash flow, PG outshines with its proven value creation and financial resilience. However, if you seek a deep value opportunity with potential for recovery, NUS offers a lower valuation and a compelling risk-reward profile despite its current challenges. Both scenarios require careful risk management aligned with your investment horizon.
Disclaimer: Investment carries a risk of loss of initial capital. The past performance is not a reliable indicator of future results. Be sure to understand risks before making an investment decision.
Go Further
I encourage you to read the complete analyses of The Procter & Gamble Company and Nu Skin Enterprises, Inc. to enhance your investment decisions: