In the dynamic world of household and personal products, The Estée Lauder Companies Inc. (EL) and Nu Skin Enterprises, Inc. (NUS) stand out as key players with distinct approaches to beauty and wellness. Both companies compete in overlapping markets, leveraging innovation to attract a loyal customer base worldwide. This article aims to analyze their strengths and challenges to help you decide which stock might be the most compelling addition to your investment portfolio.

Table of contents
Companies Overview
I will begin the comparison between The Estée Lauder Companies Inc. and Nu Skin Enterprises, Inc. by providing an overview of these two companies and their main differences.
The Estée Lauder Companies Inc. Overview
The Estée Lauder Companies Inc. operates globally in the Household & Personal Products industry, manufacturing and marketing skin care, makeup, fragrance, and hair care products. With a broad portfolio of brands including Estée Lauder, Clinique, and MAC, it distributes through department stores, specialty retailers, and online platforms. Founded in 1946 and headquartered in New York City, the company employs about 44K people and commands a market cap of $40.7B.
Nu Skin Enterprises, Inc. Overview
Nu Skin Enterprises, Inc. develops and distributes beauty and wellness products worldwide, focusing on skin care systems, nutritional supplements, and weight management products. The company sells under Nu Skin, Pharmanex, and ageLOC brands, primarily through direct sales and distributors. Founded in 1984 and based in Provo, Utah, Nu Skin employs roughly 3.1K people and has a market cap of $518M.
Key similarities and differences
Both companies operate in the consumer defensive sector within personal care and wellness, offering skin care and beauty-related products. Estée Lauder has a significantly larger scale, with an extensive brand portfolio and diverse distribution channels, while Nu Skin emphasizes direct sales and nutritional supplements. Their market caps and employee counts reflect these differences, highlighting Estée Lauder’s global reach versus Nu Skin’s more specialized approach.
Income Statement Comparison
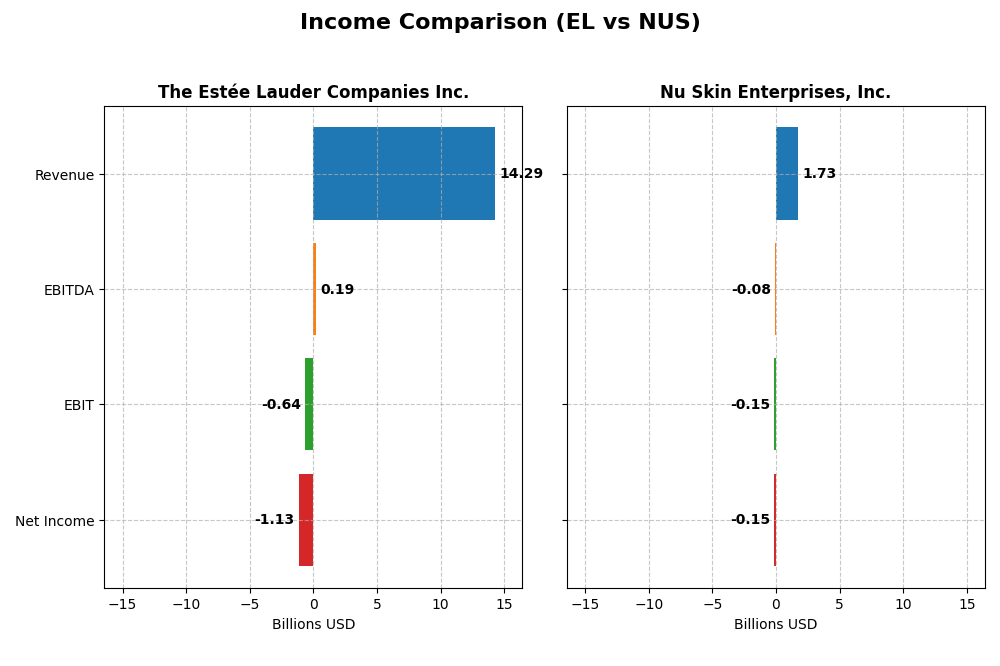
This table compares key income statement metrics for The Estée Lauder Companies Inc. and Nu Skin Enterprises, Inc. for their most recent fiscal years.
| Metric | The Estée Lauder Companies Inc. (EL) | Nu Skin Enterprises, Inc. (NUS) |
|---|---|---|
| Market Cap | 40.7B | 518M |
| Revenue | 14.3B | 1.73B |
| EBITDA | 193M | -78.8M |
| EBIT | -636M | -149M |
| Net Income | -1.13B | -147M |
| EPS | -3.15 | -2.95 |
| Fiscal Year | 2025 | 2024 |
Income Statement Interpretations
The Estée Lauder Companies Inc.
From 2021 to 2025, Estée Lauder’s revenue declined from $16.2B to $14.3B, with net income turning negative in 2025 after years of positive earnings. Gross margin remained relatively strong at 73.9%, but EBIT and net margins deteriorated significantly. The latest fiscal year showed a sharp profit decrease driven by lower revenue and unfavorable margin shifts.
Nu Skin Enterprises, Inc.
Nu Skin’s revenue decreased from $2.7B in 2021 to $1.7B in 2024, with net income swinging from a $147M profit in 2023 to a $147M loss in 2024. Gross margin held at a favorable 68.2%, yet EBIT and net margins worsened, reflecting operational challenges. The most recent year saw a marked decline in profitability alongside shrinking revenue and margin contractions.
Which one has the stronger fundamentals?
Both companies experienced unfavorable income statement trends overall, with declining revenues and net losses in their latest fiscal years. Estée Lauder maintained higher gross margins but suffered a steep net income fall, while Nu Skin showed a more pronounced revenue drop and deeper net losses. Their fundamentals appear similarly strained, given persistent margin pressure and negative earnings growth.
Financial Ratios Comparison
The table below compares key financial ratios for The Estée Lauder Companies Inc. and Nu Skin Enterprises, Inc. based on their latest fiscal year data, providing a snapshot of their financial health and market valuation.
| Ratios | The Estée Lauder Companies Inc. (EL) | Nu Skin Enterprises, Inc. (NUS) |
|---|---|---|
| ROE | -29.3% (2025) | -22.5% (2024) |
| ROIC | 6.4% (2025) | -10.4% (2024) |
| P/E | -25.7 (2025) | -2.33 (2024) |
| P/B | 7.53 (2025) | 0.53 (2024) |
| Current Ratio | 1.30 (2025) | 1.82 (2024) |
| Quick Ratio | 0.92 (2025) | 1.17 (2024) |
| D/E | 2.44 (2025) | 0.73 (2024) |
| Debt-to-Assets | 47.5% (2025) | 32.6% (2024) |
| Interest Coverage | 2.37 (2025) | -5.74 (2024) |
| Asset Turnover | 0.72 (2025) | 1.18 (2024) |
| Fixed Asset Turnover | 2.79 (2025) | 3.71 (2024) |
| Payout ratio | -54.5% (2025) | -8.14% (2024) |
| Dividend yield | 2.12% (2025) | 3.49% (2024) |
Interpretation of the Ratios
The Estée Lauder Companies Inc.
The Estée Lauder shows mixed financial health with unfavorable net margin (-7.93%) and return on equity (-29.31%), indicating profitability challenges. Neutral returns on invested capital (6.44%) and moderate liquidity ratios (current ratio 1.3) suggest stability but some risk. Its dividend yield of 2.12% is favorable, supporting steady shareholder returns, though payout sustainability requires monitoring given mixed cash flow metrics.
Nu Skin Enterprises, Inc.
Nu Skin presents weaker profitability with negative net margin (-8.46%) and return on equity (-22.5%), alongside unfavorable return on invested capital (-10.4%). However, it benefits from favorable valuation ratios (PE -2.33, PB 0.53) and strong liquidity (current ratio 1.82). The dividend yield is higher at 3.49%, reflecting a shareholder-friendly policy despite operational difficulties and risks in interest coverage.
Which one has the best ratios?
Nu Skin exhibits a more favorable overall ratio profile, with 57.14% favorable metrics compared to Estée Lauder’s 14.29%. Nu Skin’s stronger liquidity, valuation, and dividend yield contrast with Estée Lauder’s higher proportion of unfavorable profitability and leverage ratios. Thus, Nu Skin’s ratios suggest comparatively better financial positioning as of the latest fiscal years.
Strategic Positioning
This section compares the strategic positioning of The Estée Lauder Companies Inc. (EL) and Nu Skin Enterprises, Inc. (NUS) regarding market position, key segments, and exposure to technological disruption:
The Estée Lauder Companies Inc.
- Leading global player in household and personal products with strong brand portfolio.
- Diverse segments including skin care, makeup, fragrance, and hair care driving revenue.
- No explicit mention of technological disruption exposure in provided data.
Nu Skin Enterprises, Inc.
- Smaller market cap, focused on beauty and wellness products worldwide with direct selling model.
- Concentrated primarily on skin care systems, nutritional supplements, and wellness products.
- No explicit mention of technological disruption exposure in provided data.
The Estée Lauder Companies Inc. vs Nu Skin Enterprises, Inc. Positioning
EL pursues a diversified strategy across multiple personal care categories with global reach, while NUS concentrates on beauty and wellness products with a direct sales approach. EL benefits from broad product lines; NUS’s narrower focus limits diversification.
Which has the best competitive advantage?
Both EL and NUS display very unfavorable MOAT evaluations with declining ROIC below WACC, indicating value destruction and decreasing profitability; neither currently demonstrates a sustainable competitive advantage based on these metrics.
Stock Comparison
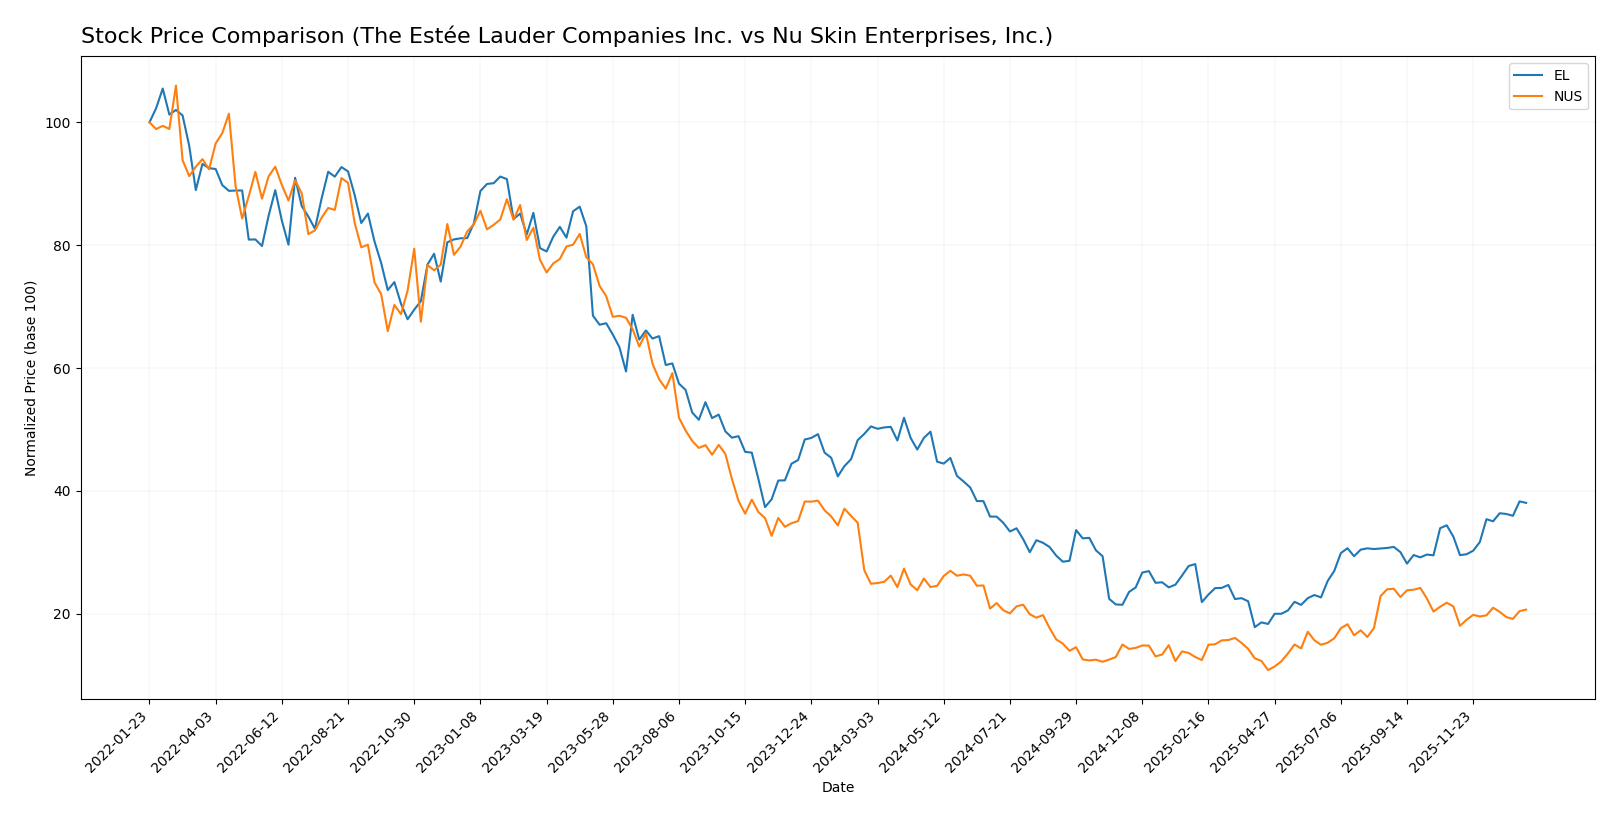
Over the past year, The Estée Lauder Companies Inc. (EL) and Nu Skin Enterprises, Inc. (NUS) have exhibited distinct bearish trends with notable price declines and varying volume dynamics, reflecting differing investor engagement and market responses.
Trend Analysis
The Estée Lauder Companies Inc. stock showed a bearish trend over the past 12 months, with a price decline of 24.65% and accelerating downward momentum, hitting a high of 154.15 and a low of 52.93. Recent months reveal a rebound with a 16.89% gain and increasing buyer dominance.
Nu Skin Enterprises, Inc. experienced a bearish trend as well, with a 16.93% price drop over the last year, also accelerating downward. The stock’s volatility was lower, with a high of 13.83 and low of 5.48, while recent price movements remained slightly negative at -2.52%.
Comparing both, The Estée Lauder Companies Inc. delivered the highest market performance recently, showing a stronger recovery phase despite a steeper overall decline versus Nu Skin Enterprises, Inc.
Target Prices
The current analyst target consensus provides a clear outlook for these stocks.
| Company | Target High | Target Low | Consensus |
|---|---|---|---|
| The Estée Lauder Companies Inc. | 130 | 70 | 106.67 |
| Nu Skin Enterprises, Inc. | 11 | 11 | 11 |
Analysts expect The Estée Lauder stock price to have moderate upside potential with a consensus below its current price of 113.02 USD, while Nu Skin’s target consensus slightly exceeds its current 10.45 USD price, suggesting limited but positive growth expectations.
Analyst Opinions Comparison
This section compares analysts’ ratings and grades for The Estée Lauder Companies Inc. and Nu Skin Enterprises, Inc.:
Rating Comparison
EL Rating
- Rating: D+, classified as Very Favorable by analysts.
- Discounted Cash Flow Score: 2, indicating a moderate valuation outlook.
- ROE Score: 1, considered very unfavorable in profitability from equity.
- ROA Score: 1, very unfavorable asset utilization.
- Debt To Equity Score: 1, very unfavorable financial risk profile.
- Overall Score: 1, very unfavorable overall financial health.
NUS Rating
- Rating: A, classified as Very Favorable by analysts.
- Discounted Cash Flow Score: 4, reflecting a favorable valuation assessment.
- ROE Score: 4, showing favorable efficiency in generating profit from equity.
- ROA Score: 4, favorable in effectively using assets to generate earnings.
- Debt To Equity Score: 3, moderate financial risk with a stronger balance sheet.
- Overall Score: 4, favorable overall financial standing.
Which one is the best rated?
Based strictly on the provided data, Nu Skin Enterprises, Inc. is clearly better rated than The Estée Lauder Companies Inc., with higher scores across all key financial metrics and an overall rating of A versus D+ for Estée Lauder.
Scores Comparison
Here is a comparison of the Altman Z-Score and Piotroski Score for The Estée Lauder Companies Inc. and Nu Skin Enterprises, Inc.:
EL Scores
- Altman Z-Score: 3.11, in safe zone indicating low bankruptcy risk.
- Piotroski Score: 5, average financial strength.
NUS Scores
- Altman Z-Score: 3.94, in safe zone indicating very low bankruptcy risk.
- Piotroski Score: 8, very strong financial strength.
Which company has the best scores?
Nu Skin Enterprises shows stronger scores with a higher Altman Z-Score and a very strong Piotroski Score of 8, compared to Estée Lauder’s average Piotroski Score of 5 and lower Altman Z-Score.
Grades Comparison
Below is the grades comparison for The Estée Lauder Companies Inc. and Nu Skin Enterprises, Inc.:
The Estée Lauder Companies Inc. Grades
The following table presents recent grades from major financial institutions for EL:
| Grading Company | Action | New Grade | Date |
|---|---|---|---|
| Wells Fargo | Maintain | Equal Weight | 2026-01-05 |
| Raymond James | Upgrade | Strong Buy | 2026-01-05 |
| Citigroup | Maintain | Neutral | 2025-12-17 |
| Evercore ISI Group | Maintain | Outperform | 2025-12-16 |
| Rothschild & Co | Downgrade | Sell | 2025-11-25 |
| Argus Research | Upgrade | Buy | 2025-11-11 |
| JP Morgan | Maintain | Overweight | 2025-10-31 |
| Telsey Advisory Group | Maintain | Market Perform | 2025-10-31 |
| UBS | Maintain | Neutral | 2025-10-31 |
| RBC Capital | Maintain | Outperform | 2025-10-31 |
The Estée Lauder Companies Inc. shows a varied grade trend, with a mix of upgrades to strong buy and buy, but also a downgrade to sell, reflecting some analyst divergence.
Nu Skin Enterprises, Inc. Grades
The following table shows the most recent grades from financial analysts for NUS:
| Grading Company | Action | New Grade | Date |
|---|---|---|---|
| DA Davidson | Maintain | Neutral | 2024-12-20 |
| Citigroup | Maintain | Neutral | 2024-10-22 |
| DA Davidson | Maintain | Neutral | 2024-08-12 |
| Citigroup | Maintain | Neutral | 2024-08-09 |
| DA Davidson | Maintain | Neutral | 2024-05-09 |
| DA Davidson | Maintain | Neutral | 2024-01-05 |
| Stifel | Maintain | Hold | 2023-10-16 |
| Stifel | Maintain | Hold | 2023-10-15 |
| Citigroup | Maintain | Neutral | 2023-09-29 |
| Citigroup | Maintain | Neutral | 2023-09-28 |
Nu Skin Enterprises, Inc. reflects a consistent neutral to hold grade trend with no recent upgrades or downgrades.
Which company has the best grades?
The Estée Lauder Companies Inc. has received a broader range of grades, including several upgrades to buy and strong buy, contrasting with Nu Skin’s steady neutral/hold ratings. This divergence indicates EL may be viewed as having greater growth potential or momentum by analysts, which could affect investor sentiment and portfolio positioning.
Strengths and Weaknesses
Below is a comparative overview of key strengths and weaknesses for The Estée Lauder Companies Inc. (EL) and Nu Skin Enterprises, Inc. (NUS) based on the most recent data.
| Criterion | The Estée Lauder Companies Inc. (EL) | Nu Skin Enterprises, Inc. (NUS) |
|---|---|---|
| Diversification | Strong product diversification across Skin Care (6.96B), Makeup (4.20B), Fragrance (2.49B), Hair Care (565M) | Less diversified, majority revenue from Nu Skin segment (1.45B), smaller manufacturing and other segments |
| Profitability | Negative net margin (-7.93%) and ROE (-29.31%); ROIC slightly positive (6.44%) but below WACC (8.08%) | Negative profitability ratios: net margin (-8.46%), ROE (-22.5%), ROIC (-10.4%) below WACC (6.24%) |
| Innovation | Moderate asset turnover (0.72) and fixed asset turnover (2.79); investment in product lines shows stability | Higher asset turnover (1.18) and fixed asset turnover (3.71), indicating efficient asset use |
| Global presence | Large global footprint reflected in broad product categories and revenues | Global reach but more focused on core Nu Skin product line with less diversification |
| Market Share | Established brand with significant market share in luxury skincare and cosmetics | Smaller market share focused in wellness and personal care sectors |
Key takeaways: Estée Lauder benefits from strong product diversification and brand presence but struggles with profitability and value creation. Nu Skin shows operational efficiency and favorable financial ratios but faces challenges with sustained profitability and value destruction. Both require cautious risk assessment before investment.
Risk Analysis
Below is a comparative table highlighting key risks for The Estée Lauder Companies Inc. (EL) and Nu Skin Enterprises, Inc. (NUS) based on recent financial and operational data:
| Metric | The Estée Lauder Companies Inc. (EL) | Nu Skin Enterprises, Inc. (NUS) |
|---|---|---|
| Market Risk | Beta 1.15 indicates moderate volatility; luxury demand sensitive to economic cycles | Beta 0.98 suggests moderate market sensitivity; wellness trends can impact demand |
| Debt level | High debt-to-equity ratio (2.44) signals elevated leverage risk | Moderate debt-to-equity (0.73) reflects healthier balance sheet |
| Regulatory Risk | Exposure to global cosmetics regulations and licensing arrangements | Regulatory scrutiny in China and US markets; direct selling compliance |
| Operational Risk | Complex supply chain with multiple brands; potential disruptions impact sales | Reliance on distributor network and retail stores; supply chain risks present |
| Environmental Risk | Sustainability pressure on packaging and ingredient sourcing | Increasing demand for eco-friendly products; potential cost impact |
| Geopolitical Risk | Global footprint exposes to trade tensions and currency fluctuations | Significant operations in China expose to geopolitical uncertainty |
The most impactful and likely risks are Estée Lauder’s high leverage and regulatory complexity, which weigh on financial stability and operational flexibility. Nu Skin’s operational dependency on distributor channels and geopolitical risk in China are key concerns, although it maintains a stronger financial position.
Which Stock to Choose?
The Estée Lauder Companies Inc. (EL) shows a declining income trend with unfavorable net margin (-7.93%) and return on equity (-29.31%). Its financial ratios are slightly unfavorable overall, marked by high debt (D/E 2.44) and weak interest coverage, despite a favorable dividend yield (2.12%). The company’s rating is very unfavorable (D+), with a safe Altman Z-score but average Piotroski score. The MOAT evaluation signals value destruction due to negative ROIC relative to WACC and declining profitability.
Nu Skin Enterprises, Inc. (NUS) also faces unfavorable income conditions, including a negative net margin (-8.46%) and declining profitability. However, its financial ratios are favorable overall, supported by low debt (D/E 0.73), strong liquidity (current ratio 1.82), and high dividend yield (3.49%). The company holds a very favorable rating (A), with a safe Altman Z-score and a very strong Piotroski score. Similar to EL, NUS shows a very unfavorable MOAT status, with declining ROIC below WACC.
For investors, Nu Skin’s favorable financial ratios and strong rating might appear more appealing, especially for those tolerating volatility and seeking value signals. Conversely, Estée Lauder’s higher leverage and weaker ratios could signal caution, potentially suiting risk-averse profiles focused on dividend income and stable cash flow. Both companies exhibit unfavorable income trends and value destruction risks, suggesting prudence in assessment.
Disclaimer: Investment carries a risk of loss of initial capital. The past performance is not a reliable indicator of future results. Be sure to understand risks before making an investment decision.
Go Further
I encourage you to read the complete analyses of The Estée Lauder Companies Inc. and Nu Skin Enterprises, Inc. to enhance your investment decisions: