In today’s dynamic consumer defensive sector, The Clorox Company (CLX) and Nu Skin Enterprises, Inc. (NUS) stand out as prominent players with overlapping interests in household and personal products. Clorox’s extensive portfolio spans cleaning, wellness, and lifestyle products, while Nu Skin focuses on innovative beauty and nutritional supplements. This comparison explores their market strategies and growth potential to help you decide which company better fits your investment portfolio. Let’s dive in to identify the more compelling opportunity.
Table of contents
Companies Overview
I will begin the comparison between The Clorox Company and Nu Skin Enterprises, Inc. by providing an overview of these two companies and their main differences.
The Clorox Company Overview
The Clorox Company manufactures and markets consumer and professional products worldwide, operating through four segments: Health and Wellness, Household, Lifestyle, and International. Its portfolio includes well-known brands such as Clorox, Glad, Burt’s Bees, and Brita. The company distributes products primarily through mass retailers, grocery outlets, and e-commerce channels, positioning itself as a diversified leader in household and personal products.
Nu Skin Enterprises, Inc. Overview
Nu Skin Enterprises develops and distributes beauty and wellness products globally, focusing on skin care systems, nutritional supplements, and weight management products under brands like Nu Skin, Pharmanex, and ageLOC. It sells mainly through direct sales and distributors, with retail stores and service centers in Mainland China. Nu Skin emphasizes research and product development in personal care, targeting the beauty and wellness market segment.
Key similarities and differences
Both companies operate in the household and personal products industry and emphasize wellness and personal care. Clorox has a broader product portfolio spanning household cleaning, food, and personal care across multiple global segments, while Nu Skin specializes primarily in beauty, skin care, and nutritional supplements with a direct sales model. Clorox’s distribution relies more on retail channels, whereas Nu Skin focuses on direct sales and distributor networks.
Income Statement Comparison
Below is a comparison of the most recent full fiscal year income statements for The Clorox Company and Nu Skin Enterprises, Inc., showing key financial metrics.

| Metric | The Clorox Company | Nu Skin Enterprises, Inc. |
|---|---|---|
| Market Cap | 13B | 518M |
| Revenue | 7.1B | 1.73B |
| EBITDA | 1.40B | -79M |
| EBIT | 1.18B | -149M |
| Net Income | 810M | -147M |
| EPS | 6.56 | -2.95 |
| Fiscal Year | 2025 | 2024 |
Income Statement Interpretations
The Clorox Company
The Clorox Company’s revenue remained relatively stable from 2021 to 2025, with a slight overall decline of 3.23%. Net income grew by 14.08% over the period, reflecting improved profitability. Margins improved notably, with a gross margin of 44.96% and a net margin of 11.4% in 2025. The latest fiscal year saw strong EBIT and EPS growth, signaling margin expansion despite flat revenue.
Nu Skin Enterprises, Inc.
Nu Skin Enterprises experienced declining revenue and net income from 2020 through 2024, with revenue down 32.92% and net income falling 176.61%. Margins have weakened, showing a high gross margin of 68.23% but negative EBIT and net margins near -8.5% in 2024. The most recent year registered sharp declines in revenue, profitability, and EPS, indicating operational and financial challenges.
Which one has the stronger fundamentals?
The Clorox Company exhibits stronger fundamentals with favorable margins, positive net income growth, and improved profitability metrics over the period. In contrast, Nu Skin Enterprises shows unfavorable trends, with significant revenue and net income declines and negative profitability margins. Clorox’s stable revenue and margin expansion contrast sharply with Nu Skin’s deteriorating income statement performance.
Financial Ratios Comparison
The table below presents the most recent financial ratios for The Clorox Company and Nu Skin Enterprises, Inc. as of their latest fiscal year available in 2025 and 2024 respectively.
| Ratios | The Clorox Company (2025) | Nu Skin Enterprises, Inc. (2024) |
|---|---|---|
| ROE | 2.52% | -22.50% |
| ROIC | 24.14% | -10.40% |
| P/E | 18.31 | -2.33 |
| P/B | 46.20 | 0.53 |
| Current Ratio | 0.84 | 1.82 |
| Quick Ratio | 0.57 | 1.17 |
| D/E (Debt-to-Equity) | 8.97 | 0.73 |
| Debt-to-Assets | 51.79% | 32.56% |
| Interest Coverage | 11.67 | -5.74 |
| Asset Turnover | 1.28 | 1.18 |
| Fixed Asset Turnover | 4.44 | 3.71 |
| Payout ratio | 74.32% | -8.14% |
| Dividend yield | 4.06% | 3.49% |
Interpretation of the Ratios
The Clorox Company
The Clorox Company shows mostly favorable financial ratios, including a strong net margin of 11.4% and an impressive ROE of 252.34%, indicating efficient profitability and shareholder value creation. However, concerns arise with a low current ratio of 0.84 and high debt-to-equity ratio of 8.97, suggesting liquidity and leverage risks. The company offers a solid dividend yield of 4.06%, supported by consistent payouts, though its high payout ratio demands monitoring for sustainability.
Nu Skin Enterprises, Inc.
Nu Skin Enterprises displays mixed financial health, with unfavorable profitability ratios such as a negative net margin of -8.46% and ROE of -22.5%, reflecting operational challenges. Liquidity appears strong with a current ratio of 1.82, and debt levels remain moderate. Despite the losses, the company maintains a dividend yield of 3.49%, which could be a strategic choice amid reinvestment and growth initiatives, but negative interest coverage signals caution on debt servicing.
Which one has the best ratios?
Both companies show favorable overall ratios at 57.14%, but The Clorox Company outperforms in profitability and leverage metrics, suggesting stronger financial stability. Nu Skin benefits from better liquidity and lower debt but struggles with negative returns and interest coverage. The Clorox Company’s higher risks in liquidity are offset by superior returns and dividend strength, giving it a slight edge in ratio quality.
Strategic Positioning
This section compares the strategic positioning of The Clorox Company and Nu Skin Enterprises, Inc., focusing on Market position, Key segments, and Exposure to technological disruption:
The Clorox Company
- Established market leader in Household & Personal Products with sizeable market cap and low beta.
- Diversified segments: Health & Wellness, Household, Lifestyle, International driving revenues.
- No explicit details on disruption exposure in data provided.
Nu Skin Enterprises, Inc.
- Smaller market cap with higher beta, competing in Household & Personal Products industry.
- Concentrated in beauty and wellness products with main Nu Skin segment dominant.
- No explicit details on disruption exposure in data provided.
The Clorox Company vs Nu Skin Enterprises, Inc. Positioning
Clorox follows a diversified segment approach across multiple product lines and geographies, offering risk spread but potentially complex management. Nu Skin focuses on skin care and nutritional supplements, concentrating on fewer segments, which could imply higher dependency on core products.
Which has the best competitive advantage?
Based on MOAT evaluation, Clorox shows a very favorable moat with growing ROIC well above WACC, indicating durable competitive advantage. Nu Skin has a very unfavorable moat with declining ROIC, signaling value destruction and weaker competitive positioning.
Stock Comparison
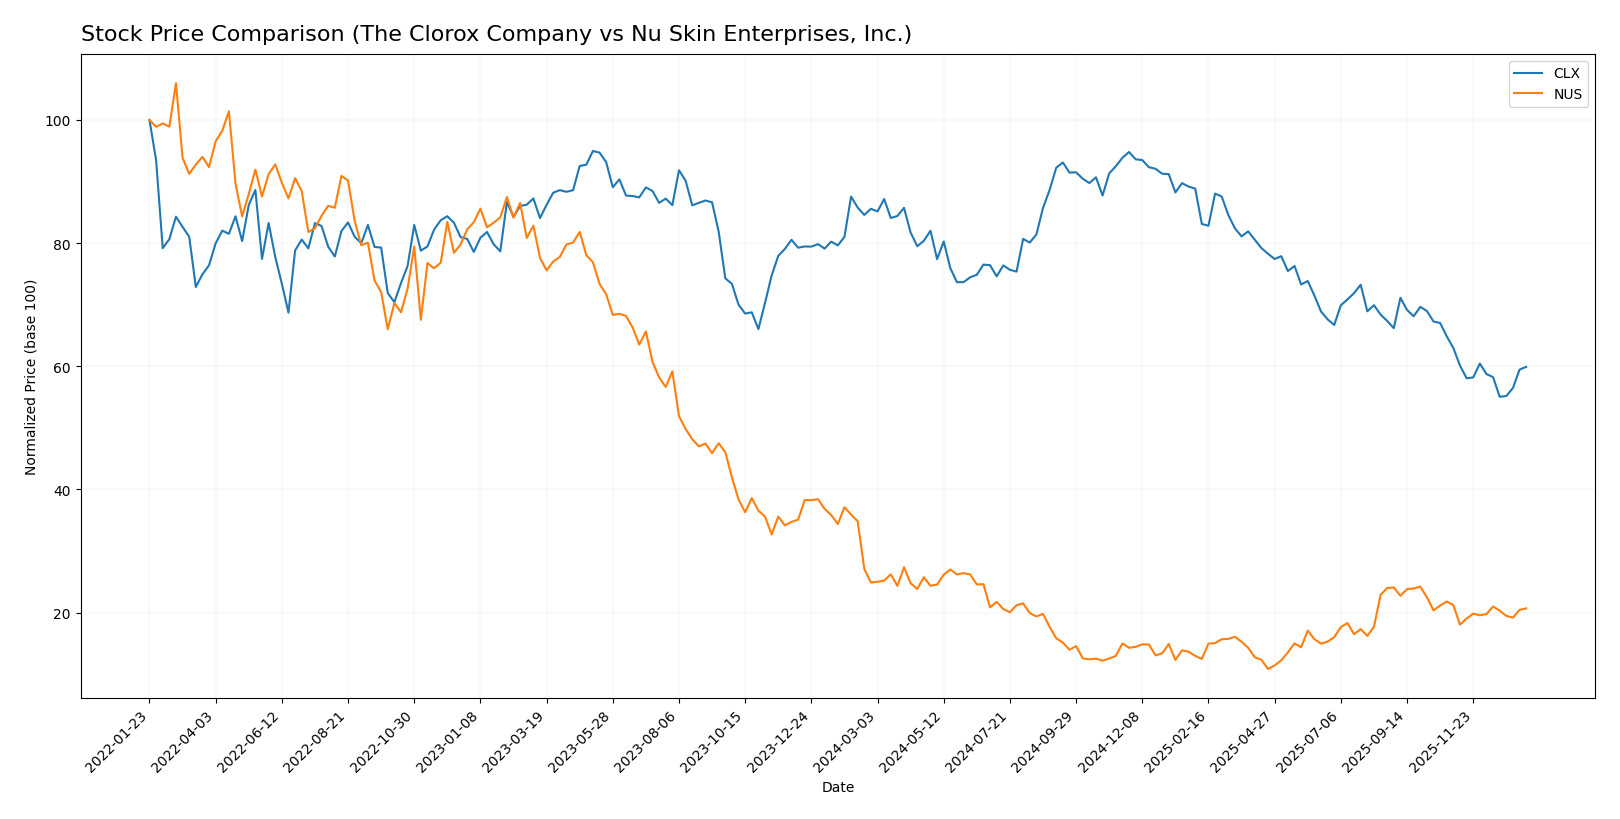
The stock price movements of The Clorox Company (CLX) and Nu Skin Enterprises, Inc. (NUS) over the past 12 months reveal significant bearish trends with contrasting volume dynamics and trend accelerations.
Trend Analysis
The Clorox Company’s stock shows a bearish trend with a 30.01% decline over the past year, accompanied by deceleration and notable volatility (std deviation 19.09). Prices ranged from a high of 169.3 to a low of 98.31.
Nu Skin Enterprises experienced a bearish trend as well, with a 16.93% drop in the same period but shows acceleration in the downward move and lower volatility (std deviation 2.34). The stock’s price fluctuated between 13.83 and 5.48.
Comparing both, CLX’s stock delivered a larger negative price change and higher volatility, while NUS had a smaller decline with accelerating bearish momentum. CLX underperformed NUS in market performance over the past year.
Target Prices
Analysts provide a clear target price consensus for The Clorox Company and Nu Skin Enterprises, Inc.
| Company | Target High | Target Low | Consensus |
|---|---|---|---|
| The Clorox Company | 152 | 94 | 118.33 |
| Nu Skin Enterprises, Inc. | 11 | 11 | 11 |
The Clorox Company’s target consensus at 118.33 suggests moderate upside from its current price of 106.98 USD. Nu Skin’s consensus target of 11 USD is slightly above its current price of 10.45 USD, indicating limited near-term growth expectations.
Analyst Opinions Comparison
This section compares analysts’ ratings and grades for The Clorox Company and Nu Skin Enterprises, Inc.:
Rating Comparison
The Clorox Company Rating
- Rating: B- indicating a very favorable overall status.
- Discounted Cash Flow Score: 5, very favorable valuation.
- ROE Score: 1, very unfavorable efficiency in equity use.
- ROA Score: 5, very favorable asset utilization.
- Debt To Equity Score: 1, very unfavorable financial risk.
- Overall Score: 3, moderate financial standing.
Nu Skin Enterprises, Inc. Rating
- Rating: A indicating a very favorable overall status.
- Discounted Cash Flow Score: 4, favorable valuation.
- ROE Score: 4, favorable efficiency in equity use.
- ROA Score: 4, favorable asset utilization.
- Debt To Equity Score: 3, moderate financial risk.
- Overall Score: 4, favorable financial standing.
Which one is the best rated?
Nu Skin Enterprises holds a stronger rating overall, with favorable scores across key metrics including ROE, ROA, and debt-to-equity. The Clorox Company shows mixed results, with very favorable DCF and ROA but weak equity efficiency and debt metrics.
Scores Comparison
Here is a comparison of the key financial scores for The Clorox Company and Nu Skin Enterprises, Inc.:
CLX Scores
- Altman Z-Score: 3.27, indicating a safe financial zone, low bankruptcy risk.
- Piotroski Score: 5, showing average financial strength and investment potential.
NUS Scores
- Altman Z-Score: 3.94, indicating a safe financial zone, very low bankruptcy risk.
- Piotroski Score: 8, reflecting very strong financial health and value investment potential.
Which company has the best scores?
Based strictly on the provided data, NUS outperforms CLX in both Altman Z-Score and Piotroski Score, indicating stronger financial stability and investment quality.
Grades Comparison
Here is a comparison of the recent grades assigned by reputable grading companies for The Clorox Company and Nu Skin Enterprises, Inc.:
The Clorox Company Grades
The table below summarizes recent grades from established financial institutions for The Clorox Company:
| Grading Company | Action | New Grade | Date |
|---|---|---|---|
| TD Cowen | Hold | Hold | 2026-01-08 |
| Goldman Sachs | Sell | Sell | 2026-01-07 |
| Wells Fargo | Hold | Equal Weight | 2026-01-05 |
| Citigroup | Hold | Neutral | 2025-12-17 |
| Morgan Stanley | Hold | Equal Weight | 2025-11-04 |
| JP Morgan | Hold | Neutral | 2025-11-04 |
| Wells Fargo | Hold | Equal Weight | 2025-11-04 |
| Citigroup | Hold | Neutral | 2025-11-04 |
| JP Morgan | Hold | Neutral | 2025-10-10 |
| Citigroup | Hold | Neutral | 2025-10-09 |
Overall, The Clorox Company’s grades consistently indicate a neutral to hold stance, with no upgrades or downgrades recently.
Nu Skin Enterprises, Inc. Grades
The following table shows recent grades from verified grading firms for Nu Skin Enterprises, Inc.:
| Grading Company | Action | New Grade | Date |
|---|---|---|---|
| DA Davidson | Hold | Neutral | 2024-12-20 |
| Citigroup | Hold | Neutral | 2024-10-22 |
| DA Davidson | Hold | Neutral | 2024-08-12 |
| Citigroup | Hold | Neutral | 2024-08-09 |
| DA Davidson | Hold | Neutral | 2024-05-09 |
| DA Davidson | Hold | Neutral | 2024-01-05 |
| Stifel | Hold | Hold | 2023-10-16 |
| Stifel | Hold | Hold | 2023-10-15 |
| Citigroup | Hold | Neutral | 2023-09-29 |
| Citigroup | Hold | Neutral | 2023-09-28 |
The available grades for Nu Skin Enterprises are stable and consistently neutral or hold, with no significant rating changes noted.
Which company has the best grades?
Both The Clorox Company and Nu Skin Enterprises, Inc. have predominantly hold or neutral grades from reputable firms, suggesting a cautious market outlook. The Clorox Company has a slightly broader range of grading firms and some sell ratings, potentially indicating a marginally more cautious stance from analysts compared to Nu Skin Enterprises. Investors might interpret these stable grades as signals of moderate risk and steady performance expectations.
Strengths and Weaknesses
Below is a comparative table highlighting the strengths and weaknesses of The Clorox Company (CLX) and Nu Skin Enterprises, Inc. (NUS) based on recent financial performance, market position, and operational metrics.
| Criterion | The Clorox Company (CLX) | Nu Skin Enterprises, Inc. (NUS) |
|---|---|---|
| Diversification | Broad product mix: Health & Wellness (2.7B), Household (2.0B), International (1.1B), Lifestyle (1.3B) | Concentrated mainly in Nu Skin products (1.45B), with smaller Manufacturing & Other segments |
| Profitability | Strong profitability: Net margin 11.4%, ROIC 24.14%, ROE 252%, Dividend yield 4.06% | Negative profitability: Net margin -8.46%, ROIC -10.4%, ROE -22.5%, but stable dividend yield 3.49% |
| Innovation | Moderate innovation focus; steady revenue growth in Lifestyle segment | Innovation challenged, reflected in declining ROIC and negative net margin |
| Global presence | Significant international sales (~1.1B), diversified geographically | More limited global footprint, focused product lines |
| Market Share | Strong, durable economic moat with ROIC > WACC by 18.3%, growing trend | Weak moat, ROIC well below WACC by -16.6%, declining trend |
Key takeaways: The Clorox Company demonstrates a durable competitive advantage with diversified revenue streams, solid profitability, and growing returns on capital. In contrast, Nu Skin Enterprises struggles with declining profitability and value destruction, despite a favorable liquidity position and some operational strengths. Investors should weigh Clorox’s stability against Nu Skin’s higher risk profile.
Risk Analysis
Below is a comparative table outlining key risks for The Clorox Company (CLX) and Nu Skin Enterprises, Inc. (NUS) based on the latest financial and operational data from 2025 and 2024 respectively:
| Metric | The Clorox Company (CLX) | Nu Skin Enterprises, Inc. (NUS) |
|---|---|---|
| Market Risk | Low beta 0.575, stable consumer defensive sector exposure | Moderate beta 0.977, more volatile due to direct sales and cosmetic sector |
| Debt level | High debt-to-equity ratio 8.97, debt/assets 51.79% (unfavorable) | Moderate leverage, debt-to-equity 0.73, debt/assets 32.56% (neutral) |
| Regulatory Risk | Moderate; global operations subject to health & safety regulations | Elevated; operates in China with potential regulatory scrutiny on direct sales |
| Operational Risk | Diversified product segments reduce risk; some supply chain sensitivity | Higher risk from distributor reliance and product innovation demands |
| Environmental Risk | Growing pressure on sustainability; consumer products may face packaging regulations | Moderate; wellness products may face ingredient and sustainability scrutiny |
| Geopolitical Risk | Moderate; international sales expose to trade tensions and tariffs | Elevated; significant presence in Mainland China with geopolitical uncertainties |
Synthesis: Nu Skin’s most impactful risks are regulatory and geopolitical due to its China operations and direct sales model, combined with operational risks from innovation pressures. Clorox faces notable financial risk from high leverage and supply chain challenges, but benefits from a more stable market risk profile. Both companies are in the safe zone per Altman Z-scores, but Clorox’s debt level warrants cautious risk management.
Which Stock to Choose?
The Clorox Company (CLX) shows a generally favorable income evolution with strong profitability metrics including an 11.4% net margin and a 252% return on equity, though it faces some unfavorable liquidity and leverage ratios. Its MOAT evaluation is very favorable, indicating durable competitive advantage and value creation, and it holds a very favorable overall rating despite mixed debt indicators.
Nu Skin Enterprises, Inc. (NUS) presents an unfavorable income statement with negative net margin and declining profitability over the period, yet it maintains favorable liquidity and valuation ratios. Its MOAT rating is very unfavorable, signaling value destruction, but it has a very favorable rating overall with strong scores in financial stability and valuation metrics.
Investors focused on stable profitability and competitive advantage might find CLX more favorable due to its strong MOAT and income metrics, while those valuing liquidity and lower valuation multiples could see NUS as more aligned with their risk tolerance. The interpretation depends on whether the investor prioritizes durable value creation or potential recovery in financial health.
Disclaimer: Investment carries a risk of loss of initial capital. The past performance is not a reliable indicator of future results. Be sure to understand risks before making an investment decision.
Go Further
I encourage you to read the complete analyses of The Clorox Company and Nu Skin Enterprises, Inc. to enhance your investment decisions: