Choosing the right stock in the household and personal products sector requires a careful look at market leaders with distinct innovation strategies. Spectrum Brands Holdings, Inc. (SPB) and Nu Skin Enterprises, Inc. (NUS) both operate in this competitive industry, offering diverse consumer products with a focus on brand strength and product development. This comparison will help you identify which company presents the most compelling investment opportunity in 2026.
Table of contents
Companies Overview
I will begin the comparison between Spectrum Brands Holdings, Inc. and Nu Skin Enterprises, Inc. by providing an overview of these two companies and their main differences.
Spectrum Brands Holdings, Inc. Overview
Spectrum Brands Holdings, Inc. is a global branded consumer products company operating across three segments: Home and Personal Care, Global Pet Care, and Home and Garden. It markets a diverse portfolio including home appliances, pet care products, and pest control solutions. Headquartered in Middleton, Wisconsin, Spectrum Brands serves retailers, e-commerce, wholesalers, and distributors worldwide.
Nu Skin Enterprises, Inc. Overview
Nu Skin Enterprises, Inc. develops and distributes beauty and wellness products globally, focusing on skin care systems, nutritional supplements, and weight management solutions. The company sells its products primarily through direct sales and distributors under the Nu Skin, Pharmanex, and ageLOC brands. Based in Provo, Utah, Nu Skin also operates retail stores and service centers, especially in Mainland China.
Key similarities and differences
Both companies operate in the Household & Personal Products industry and share a customer-focused approach to branded consumer goods. Spectrum Brands has a broader product range spanning home appliances and pet care, while Nu Skin specializes in beauty and wellness, emphasizing skin care and nutritional supplements. Their distribution models differ, with Spectrum relying heavily on retailers and wholesalers, whereas Nu Skin emphasizes direct selling and distributors.
Income Statement Comparison
The table below presents a side-by-side comparison of the most recent full fiscal year income statement figures for Spectrum Brands Holdings, Inc. and Nu Skin Enterprises, Inc.
| Metric | Spectrum Brands Holdings, Inc. (SPB) | Nu Skin Enterprises, Inc. (NUS) |
|---|---|---|
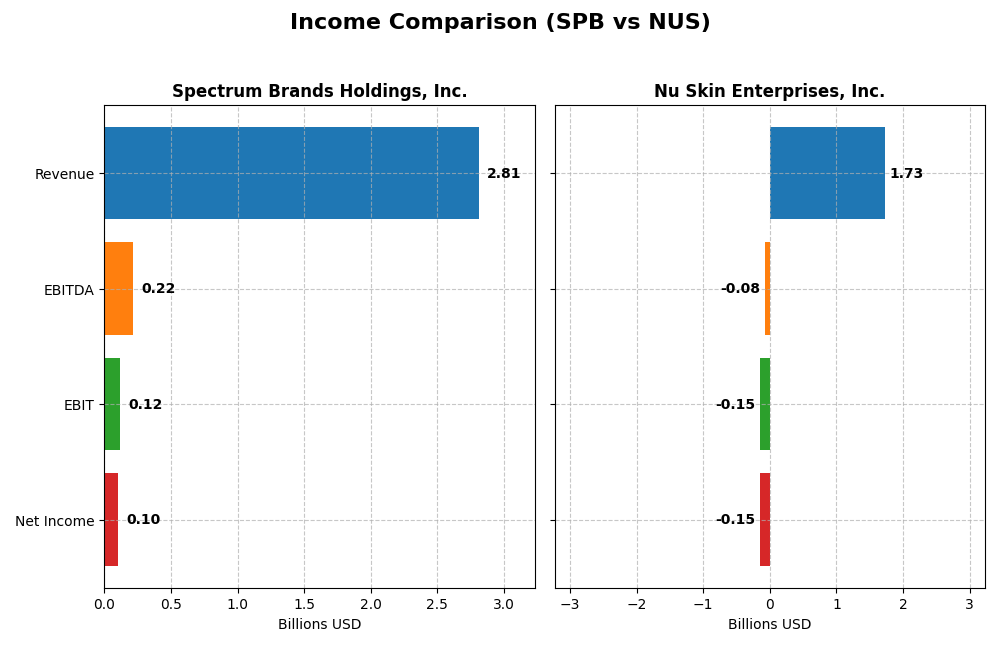
| Market Cap | 1.53B | 518M |
| Revenue | 2.81B | 1.73B |
| EBITDA | 215M | -79M |
| EBIT | 117M | -149M |
| Net Income | 100M | -147M |
| EPS | 3.88 | -2.95 |
| Fiscal Year | 2025 | 2024 |
Income Statement Interpretations
Spectrum Brands Holdings, Inc.
Spectrum Brands’ revenue declined from 3.13B in 2022 to 2.81B in 2025, accompanied by a net income decrease from 71.6M to 99.9M in the same period. Gross margin remained favorable at 36.74%, but net margin softened to 3.56%, indicating margin pressure. The 2025 year showed slowing growth, with revenue and net income both down, reflecting a challenging environment.
Nu Skin Enterprises, Inc.
Nu Skin experienced a revenue drop from 2.23B in 2022 to 1.73B in 2024, with net income turning negative to -146.6M in 2024 after a positive 104.8M in 2022. Despite a strong gross margin of 68.23%, EBIT and net margins were negative at -8.58% and -8.46%, respectively. The latest year highlighted significant margin deterioration and steep declines in profitability metrics.
Which one has the stronger fundamentals?
Both companies show unfavorable income statement trends over their respective periods. Spectrum Brands maintains positive net income and stable gross margins, though with declining profitability. Nu Skin struggles with larger revenue contraction and negative profitability margins. From a fundamentals perspective, Spectrum Brands exhibits relatively stronger income stability and margin resilience.
Financial Ratios Comparison
Below is a comparison of key financial ratios for Spectrum Brands Holdings, Inc. (SPB) and Nu Skin Enterprises, Inc. (NUS) based on their most recent fiscal year data.
| Ratios | Spectrum Brands Holdings, Inc. (SPB) FY 2025 | Nu Skin Enterprises, Inc. (NUS) FY 2024 |
|---|---|---|
| ROE | 5.23% | -22.50% |
| ROIC | 4.95% | -10.40% |
| P/E | 13.51 | -2.33 |
| P/B | 0.71 | 0.53 |
| Current Ratio | 2.26 | 1.82 |
| Quick Ratio | 1.41 | 1.17 |
| D/E (Debt-to-Equity) | 0.34 | 0.73 |
| Debt-to-Assets | 19.36% | 32.56% |
| Interest Coverage | 4.16 | -5.74 |
| Asset Turnover | 0.83 | 1.18 |
| Fixed Asset Turnover | 8.55 | 3.71 |
| Payout Ratio | 48.25% | -8.14% |
| Dividend Yield | 3.57% | 3.49% |
Interpretation of the Ratios
Spectrum Brands Holdings, Inc.
Spectrum Brands shows a majority of favorable ratios, with strong liquidity (current ratio 2.26) and low leverage (debt-to-equity 0.34). However, profitability metrics such as net margin (3.56%), ROE (5.23%), and ROIC (4.95%) are unfavorable, indicating modest profit generation. Its dividend yield is 3.57%, supported by adequate payout and no evident risk from buybacks or coverage issues.
Nu Skin Enterprises, Inc.
Nu Skin presents a mixed ratio profile with favorable liquidity ratios (current ratio 1.82) and asset turnover (1.18), but negative profitability indicators, including net margin (-8.46%) and ROE (-22.5%). Despite losses, it pays a dividend yielding 3.49%, which may reflect strategic shareholder returns amid challenges, although interest coverage is negative, signaling potential financial stress.
Which one has the best ratios?
Spectrum Brands exhibits a stronger overall ratio profile, with more favorable liquidity, leverage, and valuation metrics alongside positive profitability, despite some weaknesses. Nu Skin, while paying dividends, faces significant profitability and interest coverage issues, making its ratios comparatively less robust. Thus, Spectrum Brands appears to have the better ratio evaluation.
Strategic Positioning
This section compares the strategic positioning of Spectrum Brands Holdings, Inc. (SPB) and Nu Skin Enterprises, Inc. (NUS), including market position, key segments, and exposure to technological disruption:
Spectrum Brands Holdings, Inc. (SPB)
- Operates globally with diversified household and personal products, facing moderate competitive pressure.
- Key segments include Home and Personal Care, Global Pet Supplies, and Home and Garden, driving revenues.
- Limited explicit exposure to technological disruption mentioned in product lines or distribution methods.
Nu Skin Enterprises, Inc. (NUS)
- Focused worldwide on beauty and wellness products with direct and distributor sales, facing competitive pressure.
- Key business drivers are skin care systems, nutritional supplements, and weight management products.
- Engages in research and product development, with some tech integration in skin treatment and cleansing devices.
SPB vs NUS Positioning
SPB pursues a diversified product strategy across multiple consumer segments, offering broader market exposure but potentially higher management complexity. NUS concentrates on beauty and wellness, emphasizing innovation in skin care and supplements, which may limit diversification but focus resources.
Which has the best competitive advantage?
Both companies are shedding value with ROIC below WACC; however, SPB shows a growing ROIC trend, indicating improving profitability, whereas NUS faces declining profitability, suggesting a weaker competitive advantage.
Stock Comparison
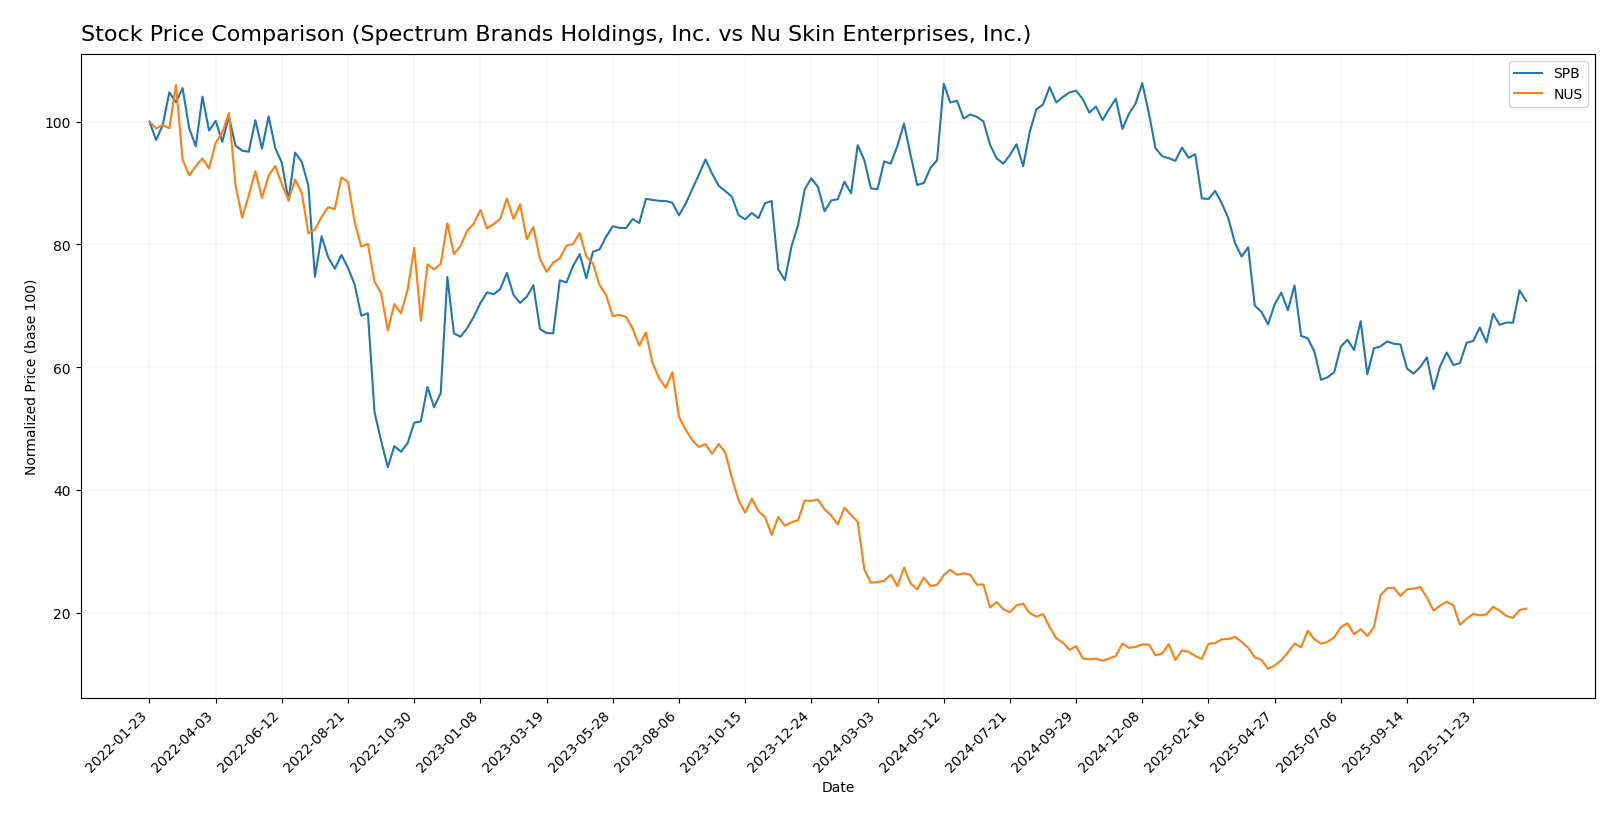
The stock prices of Spectrum Brands Holdings, Inc. (SPB) and Nu Skin Enterprises, Inc. (NUS) have shown significant bearish trends over the past 12 months, with SPB experiencing higher volatility and a recent rebound, while NUS displays a steadier decline.
Trend Analysis
Spectrum Brands Holdings, Inc. (SPB) exhibited a bearish trend over the past 12 months with a price decline of -20.57%, marked by accelerating downward momentum and high volatility, with prices ranging between 50.35 and 94.88. However, a recent period from November 2025 to January 2026 shows a 17.3% price increase, indicating a short-term bullish recovery with reduced volatility.
Nu Skin Enterprises, Inc. (NUS) also followed a bearish trend over the last year, with a price drop of -16.93% and accelerating decline, accompanied by lower volatility compared to SPB. Its recent trend from November 2025 to January 2026 remained slightly bearish with a -2.52% decrease, showing stability but no meaningful recovery.
Comparing both stocks, SPB delivered a larger overall price decline but demonstrated a recent positive shift, while NUS maintained a steadier bearish trend; SPB’s recent gains outperformed NUS, indicating higher recent market performance.
Target Prices
The current analyst consensus target prices offer a clear outlook for these companies.
| Company | Target High | Target Low | Consensus |
|---|---|---|---|
| Spectrum Brands Holdings, Inc. | 75 | 75 | 75 |
| Nu Skin Enterprises, Inc. | 11 | 11 | 11 |
Analysts expect Spectrum Brands to reach $75, representing upside from the current $63.2 price. Nu Skin’s target at $11 suggests modest growth from its $10.45 trading level.
Analyst Opinions Comparison
This section compares analysts’ ratings and financial scores for Spectrum Brands Holdings, Inc. (SPB) and Nu Skin Enterprises, Inc. (NUS):
Rating Comparison
SPB Rating
- Rating: B, classified as Very Favorable overall.
- Discounted Cash Flow Score: 1, Very Unfavorable.
- ROE Score: 2, Moderate efficiency in profit generation.
- ROA Score: 3, Moderate asset utilization.
- Debt To Equity Score: 3, Moderate financial risk.
- Overall Score: 3, Moderate financial standing.
NUS Rating
- Rating: A, classified as Very Favorable overall.
- Discounted Cash Flow Score: 4, Favorable.
- ROE Score: 4, Favorable efficiency.
- ROA Score: 4, Favorable asset utilization.
- Debt To Equity Score: 3, Moderate financial risk.
- Overall Score: 4, Favorable financial standing.
Which one is the best rated?
Based strictly on the provided data, Nu Skin Enterprises, Inc. (NUS) is better rated than Spectrum Brands Holdings, Inc. (SPB), with higher overall and key financial scores except for Debt-to-Equity where both score equally.
Scores Comparison
The following table presents a comparison of Spectrum Brands Holdings, Inc. (SPB) and Nu Skin Enterprises, Inc. (NUS) based on their Altman Z-Score and Piotroski Score:
SPB Scores
- Altman Z-Score: 1.77, in distress zone, indicating higher bankruptcy risk.
- Piotroski Score: 6, rated average financial strength and value potential.
NUS Scores
- Altman Z-Score: 3.94, in safe zone, indicating low bankruptcy risk.
- Piotroski Score: 8, rated very strong financial strength and value potential.
Which company has the best scores?
Based strictly on the provided data, NUS shows stronger financial health with a safe zone Altman Z-Score and a very strong Piotroski Score. SPB’s scores indicate financial distress and average strength, placing it behind NUS in this comparison.
Grades Comparison
Here is a comparison of the recent grades assigned to Spectrum Brands Holdings, Inc. and Nu Skin Enterprises, Inc.:
Spectrum Brands Holdings, Inc. Grades
The table below shows recent grades from established financial institutions for Spectrum Brands Holdings:
| Grading Company | Action | New Grade | Date |
|---|---|---|---|
| Canaccord Genuity | Maintain | Buy | 2025-11-17 |
| Wells Fargo | Maintain | Equal Weight | 2025-11-14 |
| Wells Fargo | Maintain | Equal Weight | 2025-09-25 |
| Canaccord Genuity | Maintain | Buy | 2025-08-08 |
| Wells Fargo | Maintain | Equal Weight | 2025-07-09 |
| Canaccord Genuity | Maintain | Buy | 2025-06-25 |
| UBS | Maintain | Buy | 2025-05-09 |
| UBS | Maintain | Buy | 2025-04-17 |
| Wells Fargo | Maintain | Equal Weight | 2025-04-16 |
| Wells Fargo | Maintain | Equal Weight | 2025-04-02 |
Spectrum Brands has consistently received Buy or Equal Weight ratings, reflecting a generally positive outlook with stable recommendations over the past year.
Nu Skin Enterprises, Inc. Grades
The following table summarizes recent grades for Nu Skin Enterprises from recognized grading firms:
| Grading Company | Action | New Grade | Date |
|---|---|---|---|
| DA Davidson | Maintain | Neutral | 2024-12-20 |
| Citigroup | Maintain | Neutral | 2024-10-22 |
| DA Davidson | Maintain | Neutral | 2024-08-12 |
| Citigroup | Maintain | Neutral | 2024-08-09 |
| DA Davidson | Maintain | Neutral | 2024-05-09 |
| DA Davidson | Maintain | Neutral | 2024-01-05 |
| Stifel | Maintain | Hold | 2023-10-16 |
| Stifel | Maintain | Hold | 2023-10-15 |
| Citigroup | Maintain | Neutral | 2023-09-29 |
| Citigroup | Maintain | Neutral | 2023-09-28 |
Nu Skin’s ratings have remained stable with Neutral and Hold grades, suggesting a cautious or moderate outlook from analysts.
Which company has the best grades?
Spectrum Brands Holdings, Inc. has received notably stronger grades, predominantly Buy and Equal Weight, compared to Nu Skin Enterprises, Inc., which mostly holds Neutral and Hold ratings. For investors, this indicates a more favorable analyst sentiment towards Spectrum Brands, potentially implying better perceived growth or value prospects.
Strengths and Weaknesses
Below is a comparison of key strengths and weaknesses for Spectrum Brands Holdings, Inc. (SPB) and Nu Skin Enterprises, Inc. (NUS) based on the most recent data:
| Criterion | Spectrum Brands Holdings, Inc. (SPB) | Nu Skin Enterprises, Inc. (NUS) |
|---|---|---|
| Diversification | Strong diversification across pet supplies, home & personal care, and home & garden segments with revenues above $1.0B in two segments (2025). | Less diversified; main revenue from Nu Skin segment (~$1.45B in 2024) with smaller manufacturing and other segments. |
| Profitability | Low net margin (3.56%) and ROIC (4.95%) below WACC (5.45%), indicating value destruction but improving profitability trend. | Negative net margin (-8.46%) and ROIC (-10.4%), well below WACC (6.24%), signaling serious value destruction and declining profitability. |
| Innovation | Moderate innovation reflected by stable product turnover and steady asset utilization. | Innovation challenges suggested by declining ROIC and negative interest coverage, impacting operational efficiency. |
| Global presence | Established global footprint with diverse product lines in multiple consumer areas. | Global reach focused mostly on personal care products with concentrated market exposure. |
| Market Share | Consistent revenue growth in pet supplies and personal care segments supports stable market share in consumer products. | Declining revenue trend in core segments and deteriorating profitability imply shrinking market influence. |
Key takeaways: Spectrum Brands shows better diversification and improving profitability despite value destruction, making it a cautiously favorable option. Nu Skin faces significant challenges with declining profitability and shrinking market presence, posing higher risk for investors.
Risk Analysis
Below is a comparison of key risks for Spectrum Brands Holdings, Inc. (SPB) and Nu Skin Enterprises, Inc. (NUS) based on the most recent data available:
| Metric | Spectrum Brands Holdings, Inc. (SPB) | Nu Skin Enterprises, Inc. (NUS) |
|---|---|---|
| Market Risk | Moderate (Beta 0.68, stable sector) | Higher (Beta 0.98, more volatile) |
| Debt level | Low (Debt/Equity 0.34, favorable) | Moderate (Debt/Equity 0.73, neutral) |
| Regulatory Risk | Moderate (Consumer products, global) | Elevated (Direct sales, global compliance challenges) |
| Operational Risk | Moderate (Diverse product lines) | Elevated (Dependence on distributors, product innovation) |
| Environmental Risk | Moderate (Household chemicals and pest control) | Moderate (Skincare and supplements, sustainability scrutiny) |
| Geopolitical Risk | Moderate (Global supply chains) | Elevated (Significant China exposure) |
Spectrum Brands faces manageable market and debt risks with a diversified portfolio but has moderate exposure to environmental and regulatory factors. Nu Skin shows higher operational and geopolitical risks, notably due to its direct sales model and reliance on the Chinese market. The Altman Z-Score signals financial distress risk for SPB (1.77, distress zone), while NUS is in a safer position (3.94, safe zone). Investors should weigh Nu Skin’s growth potential against its higher volatility and regulatory uncertainty, while Spectrum Brands’ stable but lower profitability requires caution.
Which Stock to Choose?
Spectrum Brands Holdings, Inc. (SPB) shows a declining income trend with unfavorable growth in revenue and net income over 2021-2025. Despite this, it maintains favorable financial ratios including a strong current ratio (2.26) and low debt metrics, alongside a very favorable “B” rating. The company is slightly value-destroying, though its ROIC is increasing.
Nu Skin Enterprises, Inc. (NUS) has faced sharper declines in income and profitability with significant negative net margin and earnings growth from 2020 to 2024. Its financial ratios are mixed but lean favorable overall, supported by a very favorable “A” rating. The company is shedding value with a declining ROIC trend but benefits from strong solvency and asset turnover metrics.
Investors seeking potentially improving profitability with moderate financial stability might find SPB’s profile suggestive, while those valuing stronger ratings and asset efficiency despite income challenges may see NUS as more aligned. Growth-oriented investors could lean towards SPB’s improving ROIC, whereas risk-tolerant investors focused on quality metrics might consider NUS’s favorable rating and solvency.
Disclaimer: Investment carries a risk of loss of initial capital. The past performance is not a reliable indicator of future results. Be sure to understand risks before making an investment decision.
Go Further
I encourage you to read the complete analyses of Spectrum Brands Holdings, Inc. and Nu Skin Enterprises, Inc. to enhance your investment decisions: