In the evolving landscape of energy production, Vistra Corp. (VST) and NRG Energy, Inc. (NRG) stand out as prominent independent power producers. Both companies operate across multiple U.S. regions, blending traditional and renewable energy sources to meet growing demand. Their overlapping markets and innovation strategies make them natural competitors. This article will help you decide which of these energy giants presents the most compelling investment opportunity in 2026.
Table of contents
Companies Overview
I will begin the comparison between Vistra Corp. and NRG Energy, Inc. by providing an overview of these two companies and their main differences.
Vistra Corp. Overview
Vistra Corp. operates as an integrated retail electricity and power generation company in the United States. It serves about 4.3M customers across 20 states and the District of Columbia, with a generation capacity of roughly 38,700 MW. Its portfolio includes natural gas, nuclear, coal, solar, and battery energy storage. The company is engaged in wholesale energy, commodity risk management, fuel production, and logistics.
NRG Energy, Inc. Overview
NRG Energy, Inc. is an integrated power company serving approximately 6M customers in the US. It owns and leases a power generation portfolio totaling around 18,000 MW across 25 plants. NRG offers electricity generation from natural gas, coal, oil, solar, nuclear, and battery storage, and provides a broad range of energy services including renewable products, demand response, and carbon management.
Key similarities and differences
Both Vistra and NRG operate in the independent power producer sector, focusing on electricity generation and retail sales in the US. They use diverse energy sources such as natural gas, coal, solar, nuclear, and battery storage. However, Vistra has a larger generation capacity (38,700 MW vs. 18,000 MW) and fewer customers (4.3M vs. 6M), while NRG offers a wider range of energy services and a larger workforce.
Income Statement Comparison
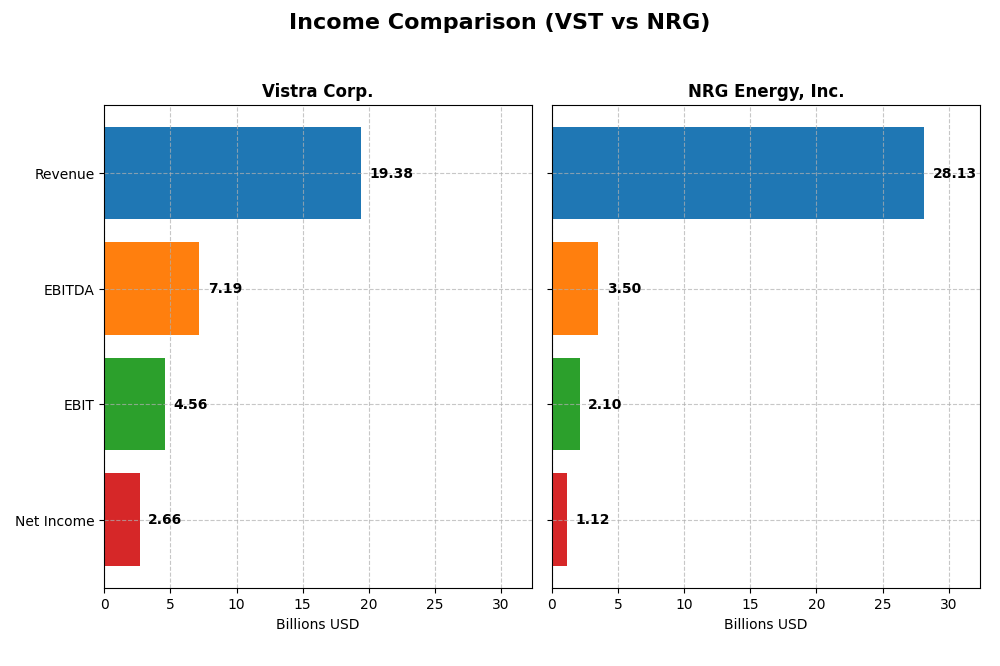
The following table summarizes the key income statement metrics for Vistra Corp. and NRG Energy, Inc. for the fiscal year 2024.
| Metric | Vistra Corp. (VST) | NRG Energy, Inc. (NRG) |
|---|---|---|
| Market Cap | 56.4B | 28.6B |
| Revenue | 19.4B | 28.1B |
| EBITDA | 7.19B | 3.50B |
| EBIT | 4.56B | 2.10B |
| Net Income | 2.66B | 1.13B |
| EPS | 7.16 | 5.14 |
| Fiscal Year | 2024 | 2024 |
Income Statement Interpretations
Vistra Corp.
Vistra Corp. exhibited strong revenue growth of 75.17% from 2020 to 2024, with net income expanding over 318%. Margins improved notably, with a favorable gross margin at 39.7% and net margin reaching 13.72% in 2024. The latest year showed a robust 24.67% revenue increase and a sharp 65.91% EBIT growth, reflecting margin expansion and operational efficiency gains.
NRG Energy, Inc.
NRG Energy’s revenue grew 209.36% over the period but declined by 2.4% in the latest year, while net income rose 120.59% overall. Gross margin remained favorable at 21.44%, but EBIT margin at 7.46% and net margin at 4.0% were less robust. The 2024 results showed strong EBIT and EPS growth but slight revenue contraction and mixed margin trends.
Which one has the stronger fundamentals?
Vistra’s income statement displays consistently favorable growth across all key metrics, with strong margin expansions and substantial earnings improvement. NRG shows commendable revenue scale and profit growth overall but faces challenges with recent revenue decline and weaker margin stability. Vistra’s financials suggest stronger fundamental performance based on income statement evaluations.
Financial Ratios Comparison
The table below presents a side-by-side comparison of key financial ratios for Vistra Corp. (VST) and NRG Energy, Inc. (NRG) based on their latest full-year fiscal data as of 2024.
| Ratios | Vistra Corp. (VST) | NRG Energy, Inc. (NRG) |
|---|---|---|
| ROE | 47.7% | 45.4% |
| ROIC | 16.3% | 11.6% |
| P/E | 17.9 | 16.5 |
| P/B | 8.53 | 7.50 |
| Current Ratio | 0.96 | 1.02 |
| Quick Ratio | 0.85 | 0.96 |
| D/E | 3.12 | 4.44 |
| Debt-to-Assets | 46.0% | 45.8% |
| Interest Coverage | 5.69 | 3.72 |
| Asset Turnover | 0.51 | 1.17 |
| Fixed Asset Turnover | 1.07 | 12.95 |
| Payout ratio | 18.0% | 36.0% |
| Dividend yield | 1.01% | 2.18% |
Interpretation of the Ratios
Vistra Corp.
Vistra Corp. shows a mixed ratio profile with strong profitability metrics such as a high ROE of 47.74% and ROIC of 16.31%, but faces challenges in liquidity (current ratio 0.96) and leverage (debt-to-equity 3.12). The dividend yield is moderate at 1.01%, reflecting a stable payout with neutral risk regarding coverage and buybacks.
NRG Energy, Inc.
NRG Energy exhibits favorable profitability ratios, including a ROE of 45.4%, though its net margin at 4.0% is weak. Liquidity ratios are stable around 1.02, but leverage remains high with a debt-to-equity of 4.44. The dividend yield is healthier at 2.18%, supported by a slightly favorable ratio profile and moderate risk.
Which one has the best ratios?
NRG Energy holds a slightly more favorable overall ratio profile, driven by stronger asset efficiency and dividend yield. Vistra’s superior profitability is offset by weaker liquidity and leverage ratios. Both companies show balanced risks and strengths, with neither presenting an unequivocal advantage across all key financial metrics.
Strategic Positioning
This section compares the strategic positioning of Vistra Corp. and NRG Energy, Inc., including market position, key segments, and exposure to technological disruption:
Vistra Corp.
- Large market cap of 56B with competitive pressure in integrated power and retail electricity sectors.
- Operates six segments including Retail, Texas, East, West, Sunset, and Asset Closure; serves 4.3M customers.
- Portfolio includes natural gas, nuclear, coal, solar, and battery storage; disruption risks from energy transition.
NRG Energy, Inc.
- Mid-sized market cap of 29B operating as an integrated power company with diverse customer base.
- Operates through Texas, East, West, and Vivint Smart Home segments; serves approximately 6M customers.
- Uses natural gas, coal, oil, solar, nuclear, and battery storage; also offers carbon management and energy efficiency services.
Vistra Corp. vs NRG Energy, Inc. Positioning
Vistra focuses on a diversified segment approach with six distinct areas and a broad energy portfolio, while NRG combines fewer segments but adds innovative services like carbon management, offering strengths in scale and service diversity respectively.
Which has the best competitive advantage?
Both companies demonstrate a very favorable economic moat with growing ROIC above WACC, indicating durable competitive advantages and efficient capital use, though Vistra shows a higher ROIC spread and stronger growth trend.
Stock Comparison
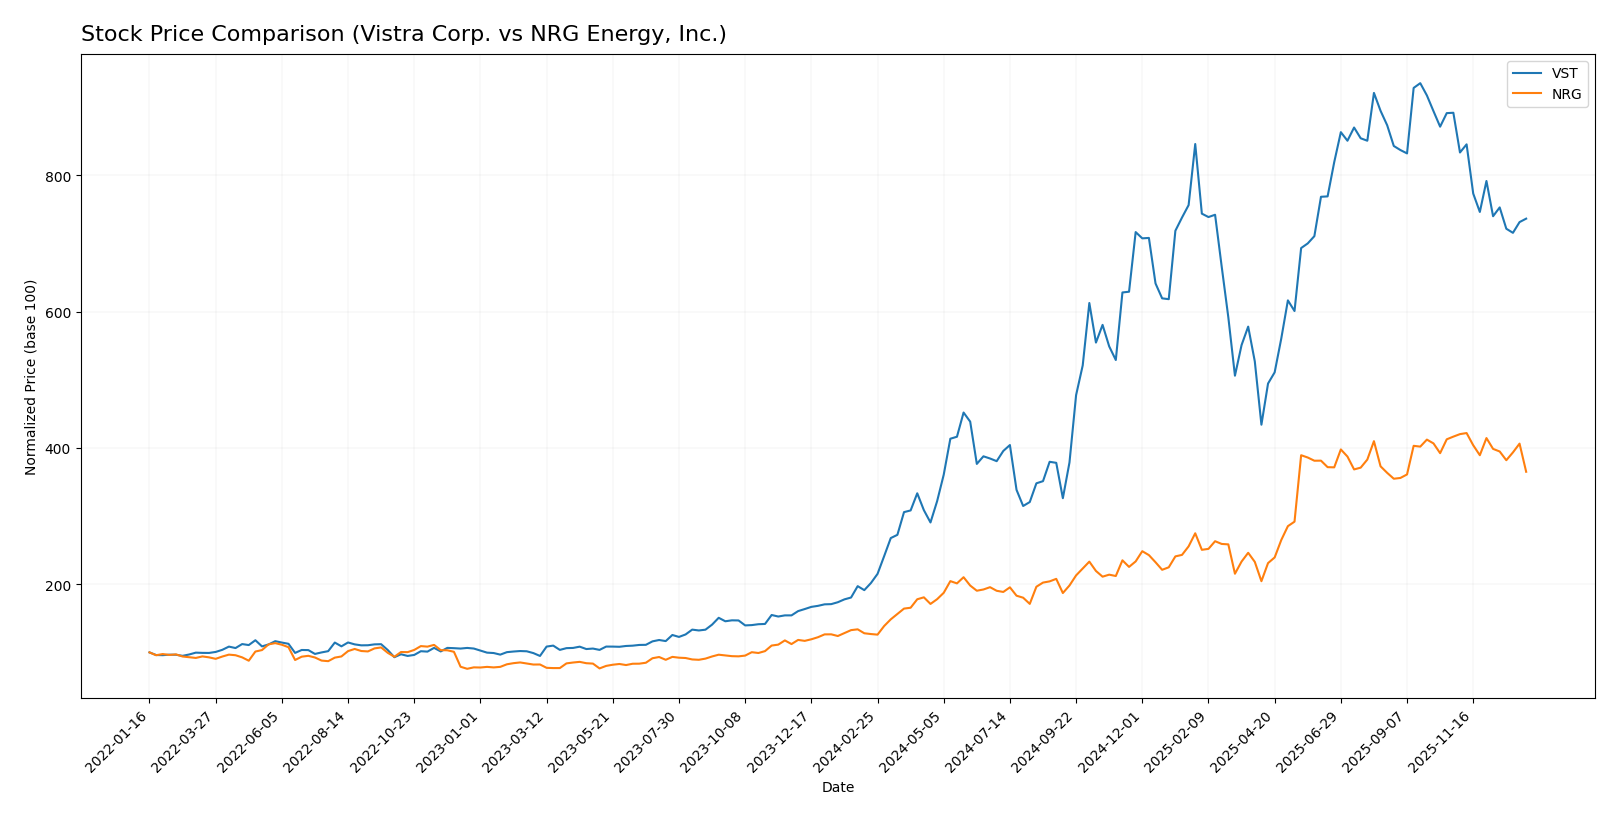
The stock price movements of Vistra Corp. and NRG Energy, Inc. over the past 12 months reveal significant bullish trends with notable deceleration in momentum and recent short-term declines in both equities.
Trend Analysis
Vistra Corp. (VST) showed a strong bullish trend over the past year with a 265.01% price increase, though recent weeks indicate a 17.42% decline and decelerating momentum. Volatility remains elevated with a 47.15 standard deviation.
NRG Energy, Inc. (NRG) also experienced a bullish trend overall, gaining 187.61% in 12 months, but faced a recent 12.38% drop. The stock’s acceleration slowed, and its volatility measured 37.03 standard deviation.
Comparing both, Vistra Corp.’s stock delivered the highest market performance over the year despite recent weakness, outperforming NRG Energy’s total price appreciation.
Target Prices
Analysts provide a clear consensus on the target prices for Vistra Corp. and NRG Energy, indicating potential upside from current levels.
| Company | Target High | Target Low | Consensus |
|---|---|---|---|
| Vistra Corp. | 256 | 217 | 236.5 |
| NRG Energy, Inc. | 211 | 144 | 191.4 |
The consensus targets suggest significant appreciation potential: Vistra Corp.’s target consensus is about 42% above its current price of 166.37 USD, while NRG Energy’s target consensus is roughly 28% above its current price of 149.27 USD. This reflects generally positive analyst outlooks for both utilities.
Analyst Opinions Comparison
This section compares the analysts’ ratings and grades for Vistra Corp. and NRG Energy, Inc.:
Rating Comparison
Vistra Corp. Rating
- Rating: B-; categorized as Very Favorable.
- Discounted Cash Flow Score: 3, indicating Moderate value.
- ROE Score: 5, considered Very Favorable.
- ROA Score: 4, considered Favorable.
- Debt To Equity Score: 1, considered Very Unfavorable.
- Overall Score: 3, indicating Moderate standing.
NRG Energy, Inc. Rating
- Rating: B; categorized as Very Favorable.
- Discounted Cash Flow Score: 3, indicating Moderate value.
- ROE Score: 5, considered Very Favorable.
- ROA Score: 5, considered Very Favorable.
- Debt To Equity Score: 1, considered Very Unfavorable.
- Overall Score: 3, indicating Moderate standing.
Which one is the best rated?
Based strictly on the provided data, NRG Energy, Inc. holds a slightly better rating with a B versus Vistra’s B-, and a higher ROA score of 5 compared to 4. Both share the same overall and DCF scores, with equally unfavorable debt-to-equity scores.
Scores Comparison
Here is the comparison of the Altman Z-Score and Piotroski Score for Vistra Corp. and NRG Energy, Inc.:
VST Scores
- Altman Z-Score: 1.80, in distress zone, high bankruptcy risk
- Piotroski Score: 6, average financial strength
NRG Scores
- Altman Z-Score: 2.58, in grey zone, moderate bankruptcy risk
- Piotroski Score: 7, strong financial strength
Which company has the best scores?
NRG has a higher Altman Z-Score in the grey zone and a stronger Piotroski Score compared to Vistra, which remains in the distress zone with an average Piotroski Score. This indicates relatively better financial stability for NRG based on these scores.
Grades Comparison
Here is the detailed grades comparison for Vistra Corp. and NRG Energy, Inc.:
Vistra Corp. Grades
The table below summarizes recent grades and rating actions by reputable financial institutions for Vistra Corp.:
| Grading Company | Action | New Grade | Date |
|---|---|---|---|
| BMO Capital | Maintain | Outperform | 2026-01-06 |
| JP Morgan | Maintain | Overweight | 2025-12-16 |
| BMO Capital | Maintain | Outperform | 2025-11-07 |
| Evercore ISI Group | Maintain | Outperform | 2025-11-07 |
| Seaport Global | Maintain | Buy | 2025-10-08 |
| BMO Capital | Maintain | Outperform | 2025-10-03 |
| Morgan Stanley | Maintain | Overweight | 2025-09-25 |
| JP Morgan | Maintain | Overweight | 2025-09-24 |
| Jefferies | Downgrade | Hold | 2025-09-23 |
| Goldman Sachs | Maintain | Neutral | 2025-08-13 |
Overall, Vistra Corp.’s grades predominantly indicate positive ratings, with multiple “Outperform” and “Overweight” assessments, and few downgrades.
NRG Energy, Inc. Grades
The table below summarizes recent grades and rating actions by reputable financial institutions for NRG Energy, Inc.:
| Grading Company | Action | New Grade | Date |
|---|---|---|---|
| BMO Capital | Maintain | Market Perform | 2025-11-07 |
| Morgan Stanley | Maintain | Equal Weight | 2025-10-28 |
| Seaport Global | Maintain | Buy | 2025-10-08 |
| Barclays | Maintain | Overweight | 2025-08-07 |
| BMO Capital | Maintain | Market Perform | 2025-08-06 |
| Citigroup | Maintain | Buy | 2025-07-17 |
| BMO Capital | Maintain | Market Perform | 2025-05-14 |
| Guggenheim | Maintain | Buy | 2025-05-13 |
| Wells Fargo | Maintain | Overweight | 2025-05-13 |
| Jefferies | Maintain | Buy | 2025-05-05 |
NRG Energy’s grades mostly reflect a neutral to moderately positive stance, with multiple “Buy” and “Overweight” ratings but also repeated “Market Perform” and “Equal Weight” assessments.
Which company has the best grades?
Vistra Corp. has received consistently stronger grades, including several “Outperform” and “Overweight” ratings, while NRG Energy’s grades lean more towards “Market Perform” and “Buy.” This suggests Vistra’s outlook is viewed more favorably, which may impact investor confidence and portfolio positioning differently.
Strengths and Weaknesses
Below is a comparison table outlining the key strengths and weaknesses of Vistra Corp. (VST) and NRG Energy, Inc. (NRG) based on their recent financial performance, market positioning, and operational metrics.
| Criterion | Vistra Corp. (VST) | NRG Energy, Inc. (NRG) |
|---|---|---|
| Diversification | Strong retail energy presence in ERCOT & Northeast/Midwest; multiple revenue streams including wholesale and capacity | Broad segment coverage including East, Texas, West, and smart home services; diversified energy and services portfolio |
| Profitability | High net margin (13.72%) and ROIC (16.31%) with growing profitability; strong ROE (47.74%) | Moderate net margin (4.0%) but solid ROE (45.4%) and ROIC (11.57%) indicating value creation despite margin pressure |
| Innovation | Moderate innovation focus; some hedging and contract amortization strategies | Active in smart home segment (Vivint); higher asset turnover suggests efficient asset use and innovative service integration |
| Global presence | Primarily US-focused, strong regional influence | US-focused with significant presence in East and Texas markets, expanding services segment |
| Market Share | Leading in ERCOT retail energy market, substantial wholesale generation revenue | Strong market share in East and Texas segments, growing presence in new services and smart home markets |
Key takeaways: Both companies demonstrate durable competitive advantages with growing ROIC and strong value creation. Vistra excels in profitability and retail energy diversification, while NRG shows strength in asset utilization and innovative service segments, offering a slightly more favorable overall financial ratio profile.
Risk Analysis
Below is a comparative table highlighting key risks associated with Vistra Corp. (VST) and NRG Energy, Inc. (NRG) based on the latest 2024 data:
| Metric | Vistra Corp. (VST) | NRG Energy, Inc. (NRG) |
|---|---|---|
| Market Risk | Beta 1.418, higher volatility | Beta 1.242, moderate volatility |
| Debt level | D/E ratio 3.12 (unfavorable) | D/E ratio 4.44 (unfavorable) |
| Regulatory Risk | High, due to multi-state operations and energy regulations | High, complex regulatory environment across regions |
| Operational Risk | Large asset base with mixed energy sources; moderate efficiency | Large, diverse portfolio with higher asset turnover |
| Environmental Risk | Exposure to fossil fuels and coal; transition risk present | Similar exposure but stronger renewable integration |
| Geopolitical Risk | US-based, limited international exposure | US-based, limited international exposure |
The most impactful and likely risks for both companies are their high debt levels and regulatory risks, given the intensive capital requirements and evolving energy policies. Vistra’s slightly higher beta indicates greater market volatility, while NRG’s better asset turnover suggests operational efficiency but still faces significant financial leverage challenges. Investors should watch closely the companies’ strategies on debt management and regulatory compliance.
Which Stock to Choose?
Vistra Corp. (VST) has shown strong income growth with a 75% revenue increase and a 318% net income rise over 2020-2024. Its profitability ratios, including a 47.7% ROE and 16.3% ROIC, are favorable, though its debt level and liquidity ratios are less favorable. The company holds a very favorable B- rating and demonstrates a very favorable moat with growing ROIC above WACC.
NRG Energy, Inc. (NRG) experienced a 209% revenue growth and a 120% net income increase over the same period, with mixed profitability including a 45.4% ROE but a lower 11.6% ROIC. Debt ratios are relatively high, and liquidity is neutral. It also holds a very favorable B rating, with a very favorable moat and growing ROIC, though its net margin is less favorable.
For investors prioritizing durable competitive advantage and strong profitability, Vistra’s robust income growth and very favorable moat might appear attractive. Meanwhile, NRG’s solid profitability and slightly more favorable ratio profile could appeal to those valuing operational efficiency and dividend yield. The choice may depend on whether one values stronger income growth or a balanced ratio profile.
Disclaimer: Investment carries a risk of loss of initial capital. The past performance is not a reliable indicator of future results. Be sure to understand risks before making an investment decision.
Go Further
I encourage you to read the complete analyses of Vistra Corp. and NRG Energy, Inc. to enhance your investment decisions: