In today’s fast-evolving technology landscape, choosing the right company for your investment portfolio requires careful analysis. Trimble Inc. (TRMB) and Novanta Inc. (NOVT) both operate in the hardware, equipment, and parts industry, focusing on innovative solutions for professional and industrial markets. This comparison highlights their market overlap and distinct innovation strategies to help you identify the most compelling investment opportunity. Let’s explore which company stands out for investors like you.

Table of contents
Companies Overview
I will begin the comparison between Trimble Inc. and Novanta Inc. by providing an overview of these two companies and their main differences.
Trimble Inc. Overview
Trimble Inc. specializes in technology solutions that enhance work processes for professionals and field mobile workers globally. Its diverse segments include Buildings and Infrastructure, Geospatial, Resources and Utilities, and Transportation, offering software and hardware products for construction, surveying, agriculture, and fleet management. Founded in 1978 and headquartered in California, Trimble operates in the technology sector with a market cap of approximately 19B USD.
Novanta Inc. Overview
Novanta Inc. designs and manufactures photonics, vision, and precision motion components and sub-systems for medical and industrial original equipment manufacturers. Its product lines span photonics-based laser systems, medical visualization technologies, and precision motion control solutions. Founded in 1968 and based in Massachusetts, Novanta operates within the technology sector with a market cap near 4.7B USD and employs about 3,000 people.
Key similarities and differences
Both Trimble and Novanta operate in the technology sector focusing on hardware and equipment, yet their markets differ. Trimble targets a broad range of industries including construction, agriculture, and transportation, providing integrated software and hardware solutions. Novanta concentrates on specialized photonics and precision motion technologies for medical and industrial markets. Trimble is considerably larger in terms of market cap and workforce compared to Novanta.
Income Statement Comparison
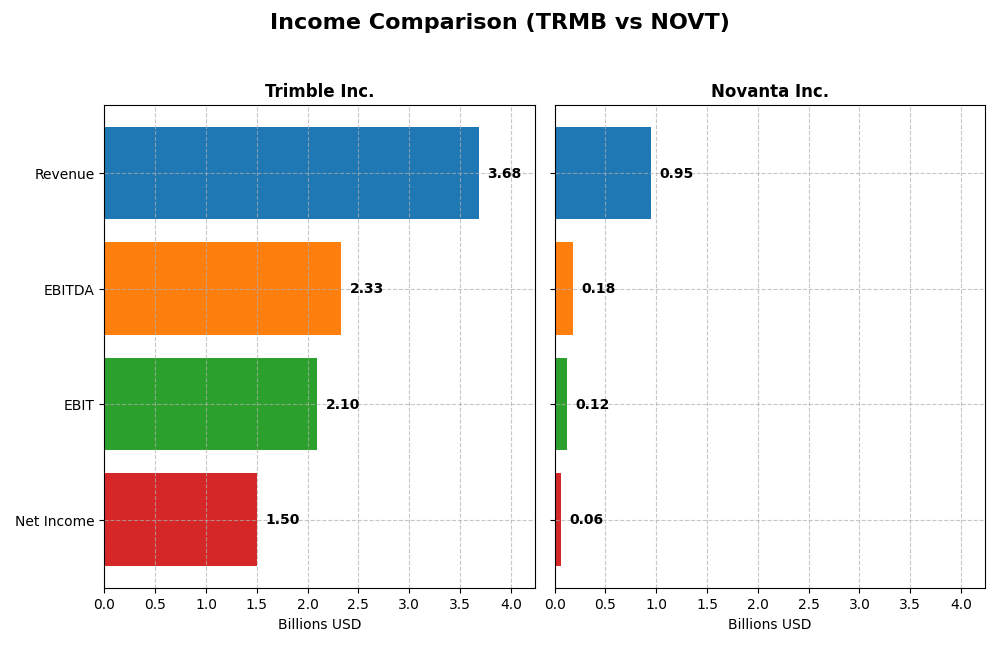
The table below compares key income statement metrics for Trimble Inc. and Novanta Inc. for the fiscal year 2024, highlighting their financial performance side by side.
| Metric | Trimble Inc. (TRMB) | Novanta Inc. (NOVT) |
|---|---|---|
| Market Cap | 18.96B | 4.69B |
| Revenue | 3.68B | 949M |
| EBITDA | 2.33B | 180M |
| EBIT | 2.10B | 124M |
| Net Income | 1.50B | 64.1M |
| EPS | 6.13 | 1.78 |
| Fiscal Year | 2024 | 2024 |
Income Statement Interpretations
Trimble Inc.
Trimble Inc. showed a 17% revenue growth from 2020 to 2024, with net income surging 286% over the same period. Margins improved significantly, with a gross margin at 65.06% and net margin reaching 40.84% in 2024, both favorable. However, revenue slightly declined by 3% in 2024, while operating profit and net margin expanded substantially, indicating margin enhancement despite slower top-line growth.
Novanta Inc.
Novanta Inc. experienced a 61% revenue increase over the 2020-2024 span, alongside a 44% rise in net income. Gross margin stood at 44.41% in 2024, with net margin at 6.75%, both favorable but lower than Trimble’s. The most recent year saw a 7.7% revenue growth but a decline in net margin by 18%, reflecting pressure on profitability despite higher sales and stable EBIT margin around 13%.
Which one has the stronger fundamentals?
Trimble’s fundamentals appear stronger, supported by higher and improving margins, robust net income growth, and a significant earnings per share increase over the period. Novanta shows solid revenue growth but weaker net margin and recent declines in profitability metrics. Trimble’s overall income statement indicators are more favorable, reflecting a more resilient and profitable operational profile.
Financial Ratios Comparison
The following table presents a side-by-side comparison of key financial ratios for Trimble Inc. and Novanta Inc. based on the most recent fiscal year data available.
| Ratios | Trimble Inc. (TRMB) 2024 | Novanta Inc. (NOVT) 2024 |
|---|---|---|
| ROE | 26.2% | 8.6% |
| ROIC | 4.5% | 7.2% |
| P/E | 11.5 | 85.7 |
| P/B | 3.02 | 7.37 |
| Current Ratio | 1.27 | 2.58 |
| Quick Ratio | 1.16 | 1.72 |
| D/E (Debt to Equity) | 0.26 | 0.63 |
| Debt-to-Assets | 16.0% | 33.9% |
| Interest Coverage | 5.08 | 3.51 |
| Asset Turnover | 0.39 | 0.68 |
| Fixed Asset Turnover | 11.81 | 6.08 |
| Payout ratio | 0.0% | 0.0% |
| Dividend yield | 0.0% | 0.0% |
Interpretation of the Ratios
Trimble Inc.
Trimble presents a mostly favorable ratio profile with strong net margin (40.84%) and return on equity (26.18%), indicating profitability and efficient equity use. However, its return on invested capital (4.49%) and weighted average cost of capital (10.81%) are unfavorable, suggesting challenges in capital efficiency. The company does not pay dividends, likely prioritizing reinvestment or growth strategies.
Novanta Inc.
Novanta shows a mixed ratio profile with a neutral net margin (6.75%) and return on invested capital (7.19%), but an unfavorable return on equity (8.59%) and high price-to-earnings ratio (85.7), indicating valuation concerns. Its liquidity ratios are favorable, reflecting solid short-term financial health. Novanta does not pay dividends, possibly focusing on R&D and acquisitions.
Which one has the best ratios?
Trimble’s ratios are globally more favorable, especially in profitability and leverage metrics, compared to Novanta’s mixed and slightly unfavorable profile. Trimble’s stronger returns and lower debt ratios contrast with Novanta’s higher valuation multiples and weaker profitability, suggesting Trimble has the better ratio set based on the provided data.
Strategic Positioning
This section compares the strategic positioning of Trimble Inc. and Novanta Inc., focusing on market position, key segments, and exposure to technological disruption:
Trimble Inc.
- Market leader with $18.96B market cap in hardware, facing competitive pressure in technology solutions.
- Diversified segments: Buildings, Geospatial, Resources, Transportation driving revenue across industries.
- Exposure through technology solutions in construction, agriculture, transportation with software systems.
Novanta Inc.
- Smaller $4.69B market cap, competing in photonics and precision components markets globally.
- Focused on photonics, vision, and precision motion serving medical and industrial OEMs.
- Exposure via photonics-based products and medical grade vision technologies amid innovation.
Trimble Inc. vs Novanta Inc. Positioning
Trimble pursues a diversified approach across multiple sectors and technologies, offering broader market exposure. Novanta concentrates on specialized photonics and precision motion components, creating focused expertise but narrower market reach.
Which has the best competitive advantage?
Both companies are currently shedding value relative to their cost of capital. Trimble shows a declining profitability trend, while Novanta’s profitability is improving, indicating a slightly better moat durability for Novanta.
Stock Comparison
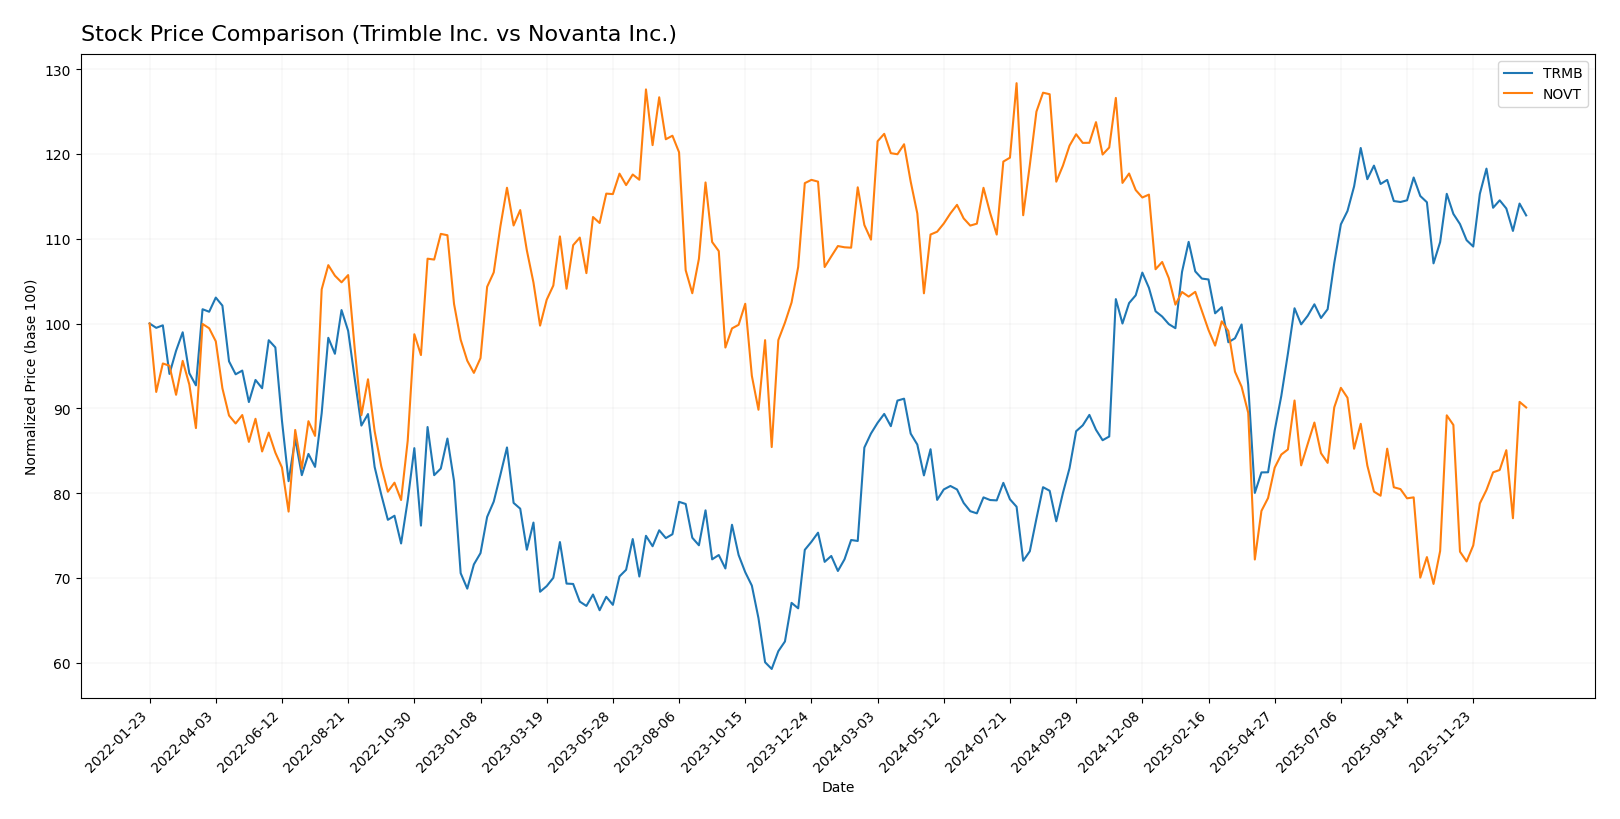
The stock price movements of Trimble Inc. and Novanta Inc. over the past 12 months reveal contrasting trends, with Trimble showing significant gains while Novanta experienced a decline, both exhibiting varied recent momentum and trading volume dynamics.
Trend Analysis
Trimble Inc. (TRMB) recorded a bullish trend over the past year with a 29.56% price increase, showing deceleration in its upward momentum. The stock ranged between 50.86 and 85.24, with moderate volatility (std deviation 9.79).
Novanta Inc. (NOVT) experienced a bearish trend with an 18.01% price decline over the same period. The downtrend accelerated, with a higher volatility level (std deviation 25.05), and prices fluctuated between 99.96 and 185.16.
Comparing both, Trimble delivered the highest market performance with a strong positive price change, whereas Novanta’s stock declined despite recent modest gains.
Target Prices
Analysts present a clear target price consensus for both Trimble Inc. and Novanta Inc., reflecting positive expectations.
| Company | Target High | Target Low | Consensus |
|---|---|---|---|
| Trimble Inc. | 102 | 94 | 98.2 |
| Novanta Inc. | 160 | 160 | 160 |
Trimble’s target consensus at 98.2 USD is significantly above its current price of 79.68 USD, indicating upside potential. Novanta’s consensus target of 160 USD also suggests strong growth compared to the current price of 130.26 USD.
Analyst Opinions Comparison
This section compares analysts’ ratings and grades for Trimble Inc. and Novanta Inc.:
Rating Comparison
Trimble Inc. Rating
- Rating: B-, considered very favorable overall.
- Discounted Cash Flow Score: 3, moderate status.
- Return on Equity Score: 3, moderate status.
- Return on Assets Score: 3, moderate status.
- Debt To Equity Score: 2, moderate status.
- Overall Score: 2, moderate status.
Novanta Inc. Rating
- Rating: C+, considered very favorable overall.
- Discounted Cash Flow Score: 3, moderate status.
- Return on Equity Score: 3, moderate status.
- Return on Assets Score: 3, moderate status.
- Debt To Equity Score: 1, very unfavorable status.
- Overall Score: 2, moderate status.
Which one is the best rated?
Trimble holds a higher rating (B-) compared to Novanta’s C+, with both sharing moderate overall scores. Trimble’s debt-to-equity score is stronger, suggesting a more balanced financial risk profile.
Scores Comparison
Here is a comparison of the Altman Z-Score and Piotroski Score for the two companies:
TRMB Scores
- Altman Z-Score: 4.56, indicating a safe zone with low bankruptcy risk.
- Piotroski Score: 6, reflecting average financial strength.
NOVT Scores
- Altman Z-Score: 5.35, indicating a safe zone with low bankruptcy risk.
- Piotroski Score: 6, reflecting average financial strength.
Which company has the best scores?
Both TRMB and NOVT have Altman Z-Scores in the safe zone, with NOVT slightly higher at 5.35 versus 4.56 for TRMB. Their Piotroski Scores are identical at 6, indicating similar average financial strength.
Grades Comparison
Here is the comparison of recent grades and ratings from recognized grading companies for Trimble Inc. and Novanta Inc.:
Trimble Inc. Grades
The table below presents Trimble Inc.’s recent grades by reputable grading companies.
| Grading Company | Action | New Grade | Date |
|---|---|---|---|
| Barclays | Maintain | Overweight | 2026-01-12 |
| Keybanc | Upgrade | Overweight | 2025-12-16 |
| Piper Sandler | Maintain | Overweight | 2025-11-07 |
| JP Morgan | Maintain | Overweight | 2025-09-19 |
| JP Morgan | Maintain | Overweight | 2025-08-07 |
| Oppenheimer | Maintain | Outperform | 2025-08-07 |
| Raymond James | Maintain | Outperform | 2025-08-07 |
| Oppenheimer | Maintain | Outperform | 2025-07-17 |
| JP Morgan | Maintain | Overweight | 2025-07-10 |
| JP Morgan | Maintain | Overweight | 2025-05-14 |
Trimble Inc. shows a strong and consistent trend of buy-side grades, with multiple “Overweight” and “Outperform” ratings maintained or upgraded by top financial institutions.
Novanta Inc. Grades
The table below presents Novanta Inc.’s recent grades by reputable grading companies.
| Grading Company | Action | New Grade | Date |
|---|---|---|---|
| Baird | Maintain | Neutral | 2025-08-11 |
| Baird | Maintain | Neutral | 2025-03-03 |
| Baird | Maintain | Neutral | 2024-11-06 |
| Baird | Maintain | Neutral | 2024-08-07 |
| Baird | Maintain | Neutral | 2023-05-11 |
| Baird | Maintain | Neutral | 2023-05-10 |
| William Blair | Upgrade | Outperform | 2022-05-11 |
| William Blair | Upgrade | Outperform | 2022-05-10 |
| Berenberg | Maintain | Hold | 2020-11-13 |
| Baird | Maintain | Neutral | 2020-05-13 |
Novanta Inc. has a predominantly neutral grading trend in recent years, with a few upgrades to “Outperform” dated back to 2022, but no recent upgrades or buy ratings.
Which company has the best grades?
Trimble Inc. has consistently received stronger grades, predominantly “Overweight” and “Outperform,” compared to Novanta Inc.’s mainly “Neutral” ratings. This suggests a more bullish analyst sentiment toward Trimble, potentially influencing investor confidence and portfolio decisions.
Strengths and Weaknesses
Below is a comparison table highlighting the key strengths and weaknesses of Trimble Inc. (TRMB) and Novanta Inc. (NOVT) based on recent financial and operational data:
| Criterion | Trimble Inc. (TRMB) | Novanta Inc. (NOVT) |
|---|---|---|
| Diversification | Highly diversified across Buildings & Infrastructure, Geospatial, Resources & Utilities, and Transportation sectors | Focused on precision manufacturing, robotics, advanced surgery, and precision medicine segments |
| Profitability | Strong net margin (40.84%) and ROE (26.18%), but ROIC (4.49%) below WACC indicating value destruction | Moderate net margin (6.75%), lower ROE (8.59%), ROIC (7.19%) slightly below cost of capital but improving |
| Innovation | Solid in mobile and fixed asset technologies, supported by favorable fixed asset turnover (11.81) | Innovation focused on photonics and precision technologies with growing ROIC and favorable fixed asset turnover (6.08) |
| Global presence | Strong global footprint in infrastructure and geospatial markets | Growing global presence in medical and precision technology sectors |
| Market Share | Established leader in infrastructure-related solutions, but facing pressure from declining profitability | Smaller market share but showing signs of improving profitability and innovation momentum |
In summary, Trimble Inc. offers strong diversification and profitability metrics but struggles with declining capital efficiency and value destruction. Novanta Inc., while less profitable overall, shows improving returns and innovation potential, making it a candidate for cautious consideration with attention to ongoing profitability trends.
Risk Analysis
Below is a summary table highlighting key risks for Trimble Inc. (TRMB) and Novanta Inc. (NOVT) based on their latest financial and operational data for 2024.
| Metric | Trimble Inc. (TRMB) | Novanta Inc. (NOVT) |
|---|---|---|
| Market Risk | Moderate (Beta 1.59) | Moderate (Beta 1.60) |
| Debt level | Low (Debt/Equity 0.26, favorable) | Medium (Debt/Equity 0.63, neutral) |
| Regulatory Risk | Moderate (Tech sector compliance) | Moderate (Medical and industrial markets) |
| Operational Risk | Moderate (Complex software/hardware integration) | Moderate (Precision components manufacturing) |
| Environmental Risk | Low (Technology sector, limited direct impact) | Low (Industry with some manufacturing emissions) |
| Geopolitical Risk | Moderate (Global supply chains) | Moderate (Global sales exposure) |
Trimble’s most impactful risks stem from moderate market volatility and operational complexity in integrating diverse tech solutions. Novanta faces higher financial leverage risk and valuation concerns, with a relatively weaker profitability profile, increasing exposure to market and credit risks in a competitive sector. Both companies maintain solid financial health with Altman Z-scores in the safe zone, but cautious monitoring of debt levels and market fluctuations is advisable.
Which Stock to Choose?
Trimble Inc. (TRMB) shows a favorable income evolution with strong net margin and EPS growth, supported by robust profitability ratios such as a 26.18% ROE and solid debt management. Despite a declining ROIC below WACC, its overall rating remains very favorable.
Novanta Inc. (NOVT) presents moderate income growth and profitability, with a lower net margin and ROE compared to TRMB. Its financial ratios are mixed, showing a slightly unfavorable global evaluation and a modest improvement in ROIC, though still below WACC.
For investors seeking growth with strong profitability and stable financial ratios, TRMB might appear more favorable, while those valuing improving capital efficiency and liquidity could find NOVT appealing, depending on risk tolerance and investment strategy.
Disclaimer: Investment carries a risk of loss of initial capital. The past performance is not a reliable indicator of future results. Be sure to understand risks before making an investment decision.
Go Further
I encourage you to read the complete analyses of Trimble Inc. and Novanta Inc. to enhance your investment decisions: