Home > Comparison > Technology > TDY vs NOVT
The strategic rivalry between Teledyne Technologies Incorporated and Novanta Inc. shapes the Technology sector’s hardware and equipment landscape. Teledyne operates as a diversified industrial powerhouse with broad aerospace and defense exposure. Novanta focuses on high-precision photonics and vision components, targeting medical and industrial niches. This analysis will assess which company’s distinct operational model offers the superior risk-adjusted return potential for a balanced portfolio in today’s evolving market.
Table of contents
Companies Overview
Teledyne Technologies and Novanta stand as pivotal players in the hardware and equipment sector. Both command distinct niches with advanced technological offerings.
Teledyne Technologies Incorporated: Industrial Tech Powerhouse
Teledyne dominates multiple industrial markets with instrumentation and digital imaging solutions. Its core revenue stems from precision instruments, sensors, and aerospace electronics. The company’s 2026 focus sharpens on expanding its engineered systems capabilities for defense and space applications, reinforcing its technological moat.
Novanta Inc.: Precision Photonics Innovator
Novanta excels in photonics, vision, and precision motion components tailored for medical and industrial OEMs. Its revenue engine thrives on laser technologies, medical visualization, and motion control solutions. In 2026, Novanta emphasizes integrating cutting-edge photonics with smart motion systems, targeting innovation-driven growth.
Strategic Collision: Similarities & Divergences
Both firms leverage hardware components in industrial technology, yet Teledyne pursues broad aerospace and defense integration, while Novanta zeroes in on specialized photonics and medical markets. Their primary battleground is precision instrumentation, yet Teledyne’s scale contrasts with Novanta’s niche innovation. This creates divergent risk-return profiles reflective of scale versus specialization.
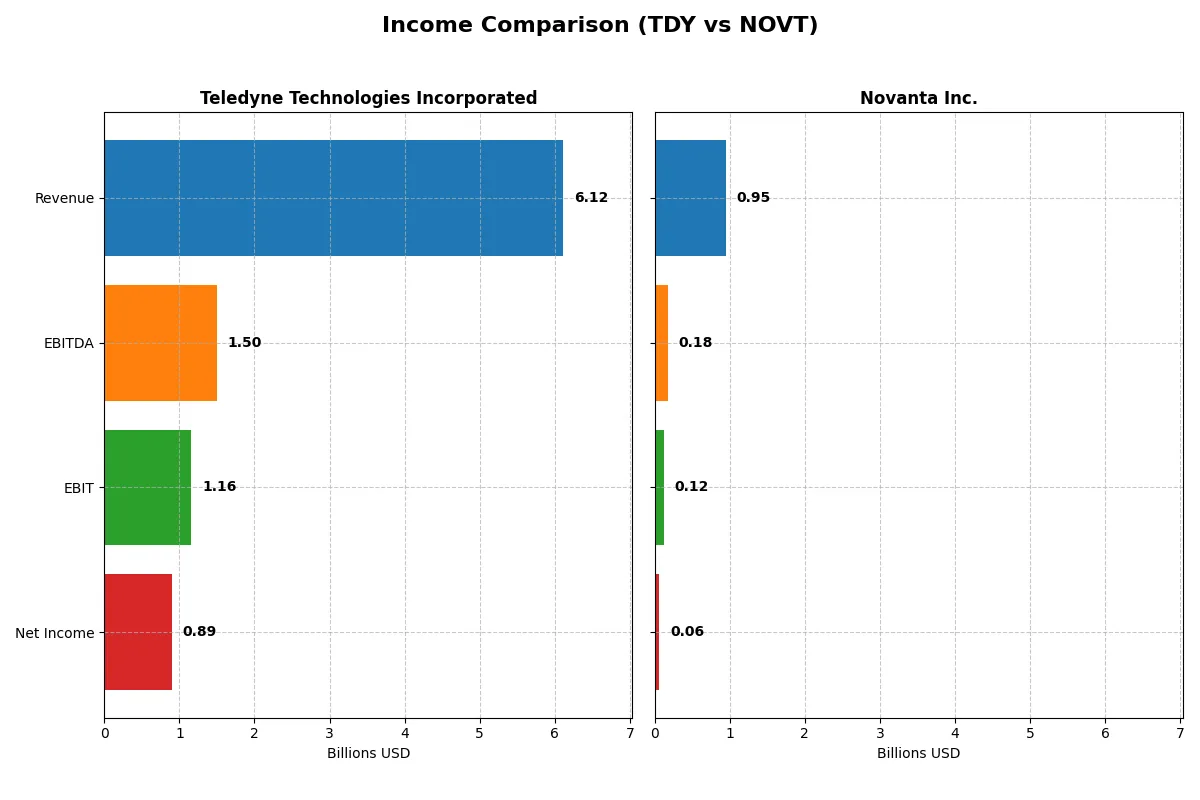
Income Statement Comparison
The following data dissects the core profitability and scalability of both corporate engines to reveal who dominates the bottom line:
| Metric | Teledyne Technologies Incorporated (TDY) | Novanta Inc. (NOVT) |
|---|---|---|
| Revenue | 6.12B | 949M |
| Cost of Revenue | 3.72B | 528M |
| Operating Expenses | 1.25B | 311M |
| Gross Profit | 2.40B | 422M |
| EBITDA | 1.50B | 180M |
| EBIT | 1.16B | 124M |
| Interest Expense | 60M | 31M |
| Net Income | 895M | 64M |
| EPS | 18.88 | 1.78 |
| Fiscal Year | 2025 | 2024 |
Income Statement Analysis: The Bottom-Line Duel
This income statement comparison reveals which company runs a more efficient and profitable corporate engine through recent financial performance.
Teledyne Technologies Incorporated Analysis
Teledyne’s revenue rose steadily from 4.6B in 2021 to 6.1B in 2025, doubling net income from 445M to 895M. Its gross margin remains strong near 39%, with net margin expanding to 14.6%, reflecting disciplined cost control. The 2025 figures exhibit improving EBIT margin at 19%, signaling enhanced operating efficiency and momentum.
Novanta Inc. Analysis
Novanta’s revenue climbed from 590M in 2020 to 949M in 2024, with net income growing 44% to 64M despite a dip in net margin to 6.75%. Its higher gross margin of 44% contrasts with a lower EBIT margin of 13%, indicating more constrained operating leverage. The latest year shows modest EBIT growth but declining net margin and EPS, flagging margin pressure.
Margin Strength vs. Revenue Growth Scale
Teledyne leads with superior profit margins and robust net income growth, doubling earnings in five years. Novanta posts higher revenue growth but struggles with compressing net margins and EPS decline. For investors prioritizing profitability and margin resilience, Teledyne’s profile demonstrates stronger fundamental efficiency and capital allocation.
Financial Ratios Comparison
These vital ratios act as a diagnostic tool to expose the underlying fiscal health, valuation premiums, and capital efficiency of the companies compared below:
| Ratios | Teledyne Technologies (TDY) | Novanta Inc. (NOVT) |
|---|---|---|
| ROE | 8.51% | 8.59% |
| ROIC | 6.78% | 7.25% |
| P/E | 27.35 | 85.70 |
| P/B | 2.33 | 7.37 |
| Current Ratio | 1.64 | 2.58 |
| Quick Ratio | 1.08 | 1.72 |
| D/E (Debt-to-Equity) | 0.24 | 0.63 |
| Debt-to-Assets | 16.2% | 33.9% |
| Interest Coverage | 19.29 | 3.51 |
| Asset Turnover | 0.40 | 0.68 |
| Fixed Asset Turnover | 7.29 | 6.08 |
| Payout ratio | 0 | 0 |
| Dividend yield | 0 | 0 |
| Fiscal Year | 2025 | 2024 |
Efficiency & Valuation Duel: The Vital Signs
Financial ratios serve as a company’s DNA, uncovering hidden operational strengths and risks that guide investment decisions.
Teledyne Technologies Incorporated
Teledyne posts a solid net margin of 14.6% but a modest ROE of 8.5%, indicating moderate profitability. Its P/E of 27.35 suggests the stock trades at a premium but not excessively stretched. Teledyne retains earnings for R&D, supporting steady growth without dividend payouts, reflecting a focus on innovation.
Novanta Inc.
Novanta delivers a lower net margin of 6.75% and a similar ROE near 8.6%, showing restrained profitability. The valuation appears stretched with a P/E of 85.7 and a high P/B of 7.37. Like Teledyne, it pays no dividends, funneling cash into R&D to fuel future expansion, though at a higher risk profile.
Valuation Discipline vs. Growth Ambition
Teledyne offers a more balanced risk-reward profile with favorable margins and valuation metrics. Novanta’s premium multiples highlight growth ambitions but carry greater valuation risk. Investors seeking operational safety may prefer Teledyne, while those favoring aggressive expansion might lean toward Novanta.
Which one offers the Superior Shareholder Reward?
Teledyne Technologies (TDY) and Novanta (NOVT) both eschew dividends, focusing on reinvestment and buybacks. TDY’s payout ratio is zero, signaling full reinvestment into R&D and operations, supported by a robust free cash flow per share of 22.7 and a strong buyback program that enhances shareholder value. NOVT also pays no dividends, but its higher price-to-free-cash-flow ratio of 38.9 and lower free cash flow per share of 3.9 suggest a more expensive growth profile. TDY’s sustainable capital allocation, with a free cash flow coverage ratio near 0.9 and capital expenditure well covered, contrasts with NOVT’s higher leverage and valuation multiples. I conclude TDY offers a superior total return profile in 2026, balancing growth with disciplined buybacks and sustainable cash flow.
Comparative Score Analysis: The Strategic Profile
The radar chart reveals the fundamental DNA and strategic trade-offs of Teledyne Technologies and Novanta Inc.:
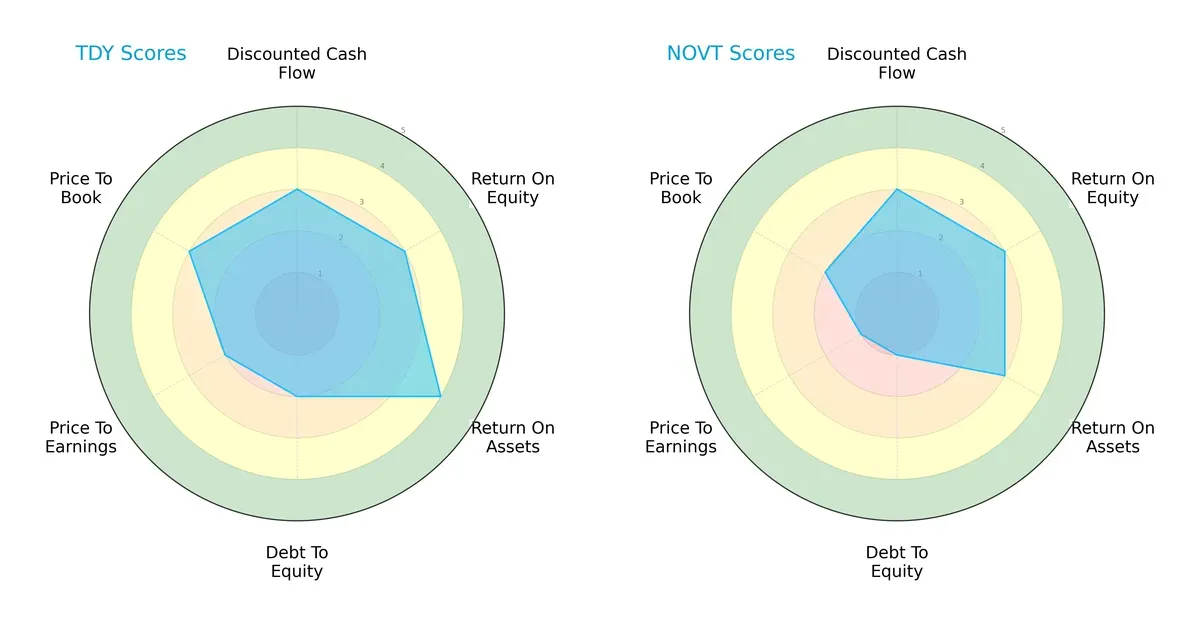
Teledyne shows strength in asset efficiency (ROA score 4) and a more balanced valuation profile (P/E 2, P/B 3). Novanta matches Teledyne on DCF and ROE but struggles with higher financial risk, evident from a weaker debt-to-equity score (1 vs. 2). Teledyne’s profile is more balanced; Novanta relies on specific operational efficiency but faces valuation and leverage challenges.
Bankruptcy Risk: Solvency Showdown
Novanta’s Altman Z-Score (5.65) exceeds Teledyne’s (4.52), placing both firmly in the safe zone but indicating Novanta has a stronger buffer against bankruptcy risk in this cycle:
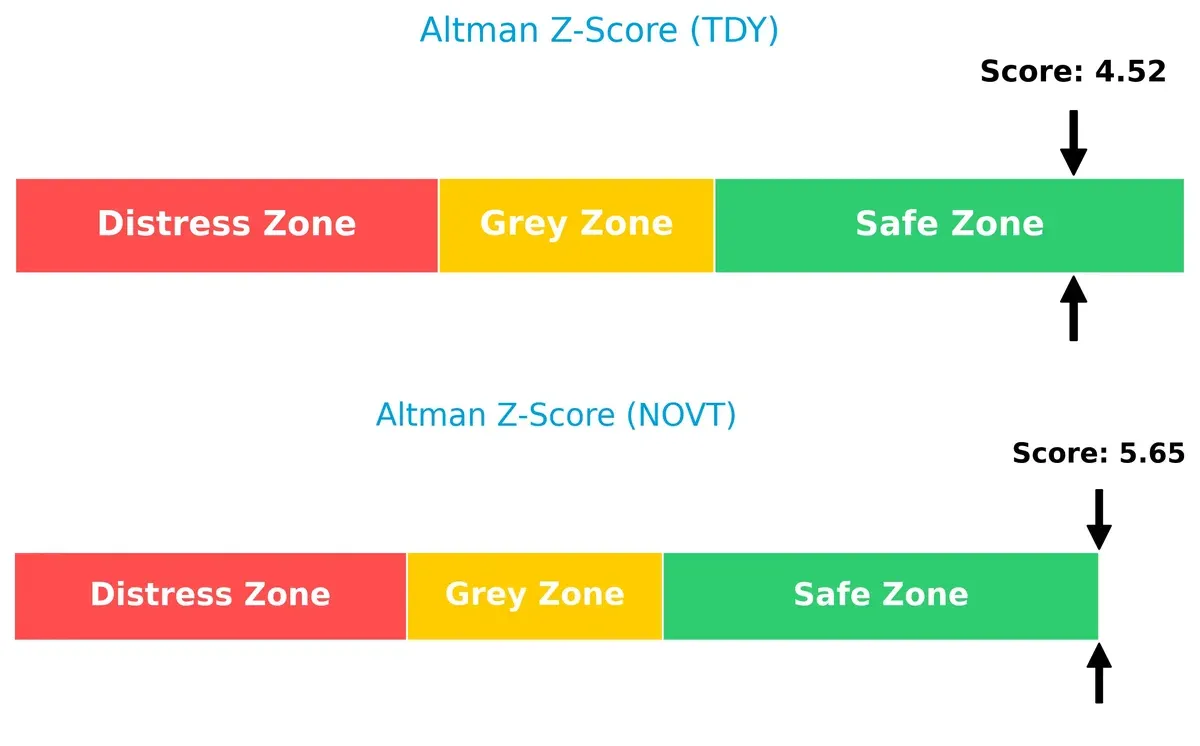
Financial Health: Quality of Operations
Both companies share an average Piotroski F-Score of 6, signaling moderate financial health without glaring red flags. Neither company shows signs of distress, but investors should monitor internal metrics closely:

How are the two companies positioned?
This section dissects TDY and NOVT’s operational DNA by comparing revenue distribution and internal strengths and weaknesses. The goal is to confront their economic moats and identify the most resilient competitive advantage.
Revenue Segmentation: The Strategic Mix
The following visual comparison dissects how Teledyne Technologies and Novanta diversify their income streams and where their primary sector bets lie:
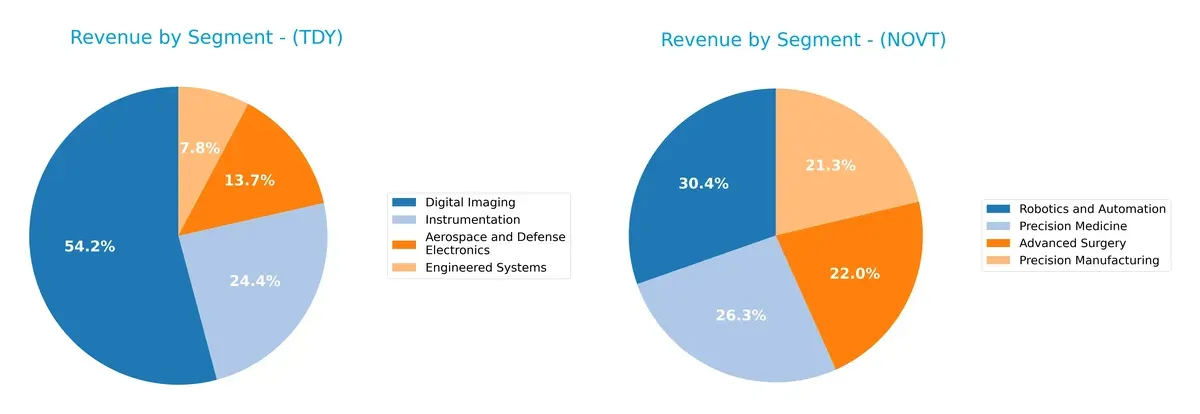
Teledyne’s revenue anchors heavily in Digital Imaging at $3.07B, dwarfing its other segments like Instrumentation at $1.38B. Novanta’s top segments cluster around Robotics and Automation ($288M) and Precision Medicine ($250M), showing a more balanced profile. Teledyne risks concentration but leverages ecosystem lock-in in imaging technology. Novanta’s diversified mix suggests resilience through exposure to multiple precision tech areas, reducing single-segment dependency.
Strengths and Weaknesses Comparison
This table compares the Strengths and Weaknesses of Teledyne Technologies (TDY) and Novanta Inc. (NOVT):
TDY Strengths
- Diverse revenue streams across aerospace, digital imaging, engineered systems, instrumentation
- Favorable net margin at 14.63%
- Strong liquidity ratios with current ratio 1.64 and quick ratio 1.08
- Low debt levels and favorable interest coverage at 19.47
NOVT Strengths
- Balanced business segments including precision manufacturing, robotics, advanced surgery, precision medicine
- Favorable current and quick ratios at 2.58 and 1.72 respectively
- Neutral ROIC of 7.25% with favorable fixed asset turnover at 6.08
TDY Weaknesses
- Unfavorable ROE at 8.51% below WACC
- High P/E ratio of 27.35 indicates expensive valuation
- Unfavorable asset turnover at 0.4 limits efficiency
- Zero dividend yield may deter income investors
NOVT Weaknesses
- Unfavorable high P/E of 85.7 and high P/B at 7.37 suggest overvaluation
- Unfavorable WACC at 10.97% exceeds ROIC
- Moderate debt levels with debt-to-assets at 33.92%
- Lower net margin at 6.75% and zero dividend yield
Both companies show strengths in liquidity and segment diversification supporting stable operations. TDY’s profitability metrics are stronger, but asset efficiency and valuation raise concerns. NOVT faces valuation and capital cost challenges despite a well-diversified product base. These factors shape their strategic priorities in managing growth and capital allocation.
The Moat Duel: Analyzing Competitive Defensibility
A structural moat is the critical barrier protecting long-term profits from relentless competitive erosion. Here is how Teledyne and Novanta stack up:
Teledyne Technologies Incorporated: Diversified Technological Integration
Teledyne’s moat stems from its broad portfolio of advanced instrumentation and aerospace systems. It sustains high ROIC growth despite currently shedding value versus WACC. Expansion into defense and digital imaging deepens this moat in 2026.
Novanta Inc.: Precision Photonics Specialist
Novanta’s moat relies on specialized photonics and precision motion components, contrasting Teledyne’s diversified approach. Despite shedding value relative to WACC, Novanta maintains margin stability and steadily growing ROIC. New medical and industrial applications offer expansion potential.
Verdict: Diversification vs. Specialization in Moat Sustainability
Teledyne’s wider product ecosystem offers a deeper competitive moat than Novanta’s niche focus, despite both showing ROIC below WACC. Teledyne’s accelerating profitability better equips it to defend market share against intensifying competition.
Which stock offers better returns?
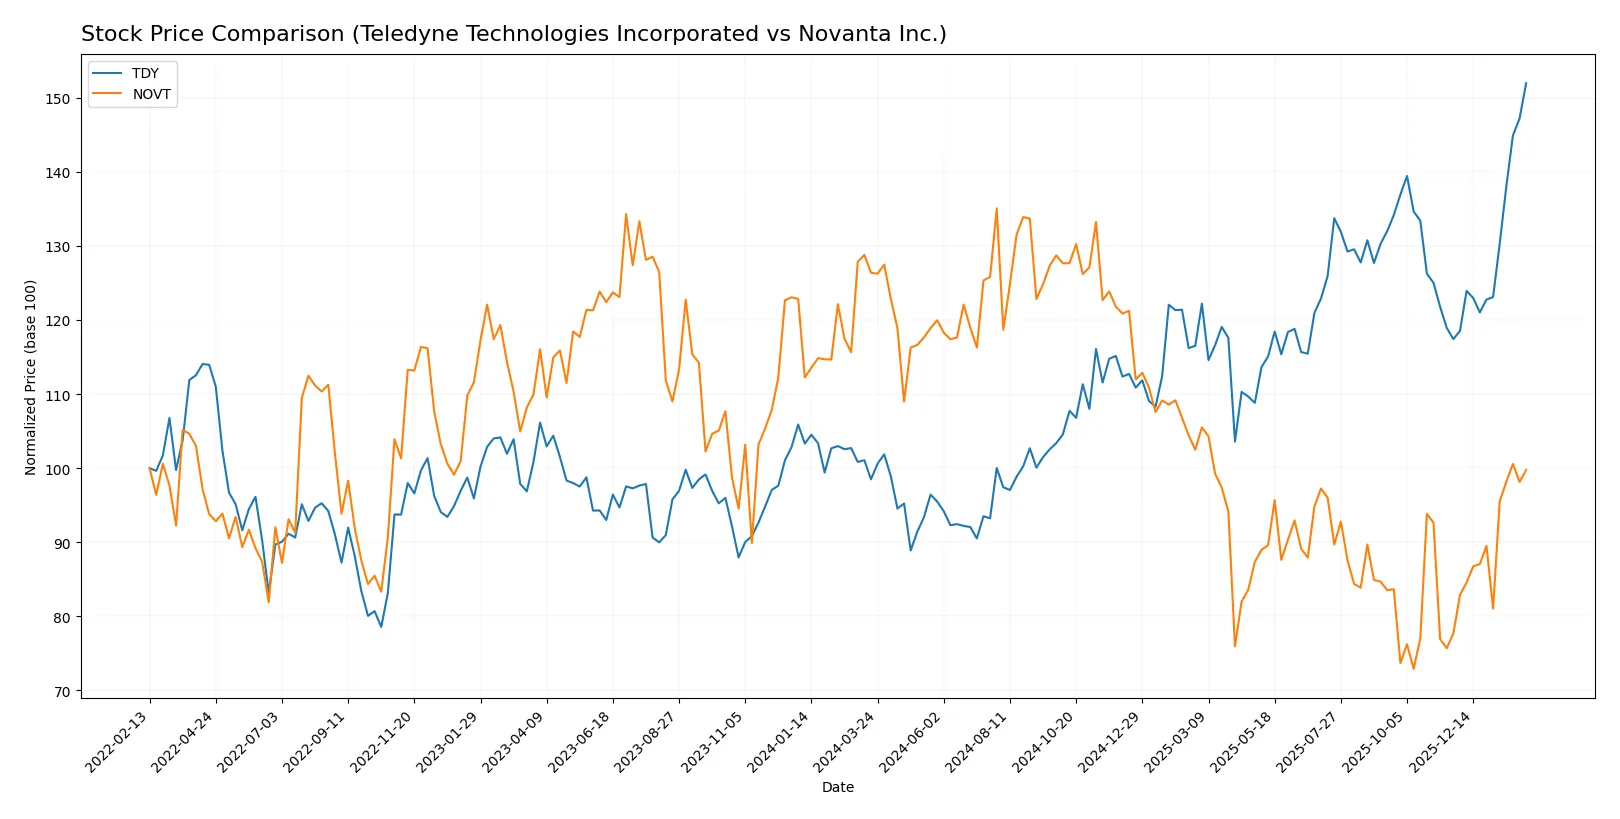
Over the past 12 months, Teledyne Technologies and Novanta Inc. displayed contrasting price dynamics, with significant gains for Teledyne and a marked decline for Novanta, both showing acceleration in recent trends.
Trend Comparison
Teledyne Technologies shows a robust bullish trend with a 54.27% price increase over the past year, accelerating upwards from a low of 374.64 to a high near 640.42.
Novanta Inc. faces a bearish trend, dropping 21.05% over the same period despite recent acceleration and a partial recovery of 28.42% since November 2025.
Teledyne outperforms Novanta notably, delivering the highest market return with sustained acceleration and stronger price appreciation.
Target Prices
Analysts present a confident target price consensus for Teledyne Technologies and Novanta Inc.
| Company | Target Low | Target High | Consensus |
|---|---|---|---|
| Teledyne Technologies Incorporated | 599 | 720 | 638.5 |
| Novanta Inc. | 160 | 160 | 160 |
The consensus target for Teledyne suggests modest upside from the current 640.42 price, while Novanta’s target of 160 implies a strong potential gain above its 136.78 market price.

Don’t Let Luck Decide Your Entry Point
Optimize your entry points with our advanced ProRealTime indicators. You’ll get efficient buy signals with precise price targets for maximum performance. Start outperforming now!
How do institutions grade them?
Teledyne Technologies Incorporated Grades
The following table shows recent institutional grades for Teledyne Technologies Incorporated:
| Grading Company | Action | New Grade | Date |
|---|---|---|---|
| Barclays | Maintain | Equal Weight | 2026-01-22 |
| Needham | Maintain | Buy | 2026-01-22 |
| Stifel | Maintain | Buy | 2026-01-22 |
| Citigroup | Maintain | Neutral | 2026-01-13 |
| Barclays | Maintain | Equal Weight | 2026-01-12 |
| Needham | Maintain | Buy | 2025-10-23 |
| Barclays | Maintain | Equal Weight | 2025-10-23 |
| Stifel | Maintain | Buy | 2025-10-23 |
| Morgan Stanley | Maintain | Equal Weight | 2025-10-15 |
| UBS | Maintain | Buy | 2025-07-24 |
Novanta Inc. Grades
The following table shows recent institutional grades for Novanta Inc.:
| Grading Company | Action | New Grade | Date |
|---|---|---|---|
| Baird | Maintain | Neutral | 2025-08-11 |
| Baird | Maintain | Neutral | 2025-03-03 |
| Baird | Maintain | Neutral | 2024-11-06 |
| Baird | Maintain | Neutral | 2024-08-07 |
| Baird | Maintain | Neutral | 2023-05-11 |
| Baird | Maintain | Neutral | 2023-05-10 |
| William Blair | Upgrade | Outperform | 2022-05-11 |
| William Blair | Upgrade | Outperform | 2022-05-10 |
| Berenberg | Maintain | Hold | 2020-11-13 |
| Baird | Maintain | Neutral | 2020-05-13 |
Which company has the best grades?
Teledyne Technologies holds more recent Buy and Equal Weight ratings from multiple firms, indicating moderate confidence. Novanta’s grades skew Neutral with an older Outperform upgrade, reflecting more cautious sentiment. Investors may find Teledyne’s current grades suggest stronger institutional conviction.
Risks specific to each company
The following categories identify critical pressure points and systemic threats facing both firms in the 2026 market environment:
1. Market & Competition
Teledyne Technologies Incorporated (TDY)
- Operates in diverse industrial and defense sectors with established market presence and moderate growth risk.
Novanta Inc. (NOVT)
- Focuses on photonics and precision motion, facing higher competitive pressures and niche market dependency.
2. Capital Structure & Debt
TDY
- Low debt-to-equity ratio (0.24), strong interest coverage (19.47), signaling conservative leverage and financial stability.
NOVT
- Higher debt-to-equity (0.63) and weaker interest coverage (3.95), indicating greater financial risk and vulnerability to interest rate hikes.
3. Stock Volatility
TDY
- Beta near market average (1.01), suggesting moderate stock volatility in line with overall market movements.
NOVT
- Elevated beta (1.62) implies higher volatility and increased risk sensitivity to market swings.
4. Regulatory & Legal
TDY
- Exposure to aerospace and defense regulations may increase compliance costs but benefits from long-term government contracts.
NOVT
- Medical and industrial sectors face strict regulatory scrutiny, especially in medical device approvals, posing approval delays.
5. Supply Chain & Operations
TDY
- Global operations with diversified supply chain; however, complex integration in defense and aerospace could cause operational bottlenecks.
NOVT
- Smaller scale with dependency on specialized components; supply chain disruptions could have disproportionate impacts.
6. ESG & Climate Transition
TDY
- Increasing pressure to align aerospace and defense products with sustainability goals; moderate ESG risks due to industry nature.
NOVT
- Faces challenges in sustainable sourcing of photonics materials and energy-intensive manufacturing processes.
7. Geopolitical Exposure
TDY
- Significant exposure to US defense contracts and allied international markets, sensitive to geopolitical tensions and defense budgets.
NOVT
- Global industrial and medical markets exposure, but less directly tied to defense, moderating geopolitical risk impact.
Which company shows a better risk-adjusted profile?
Teledyne’s strongest risk is geopolitical exposure due to defense reliance, but its conservative debt and stable margins mitigate concerns. Novanta’s most significant risk lies in capital structure and valuation, with high leverage and stretched multiples elevating financial vulnerability. Teledyne offers a better risk-adjusted profile, supported by a safer Altman Z-score and moderate beta. Recent data show Novanta’s higher beta and debt-to-equity ratio, reinforcing my caution on its financial risk.
Final Verdict: Which stock to choose?
Teledyne Technologies Incorporated (TDY) shines as a cash-generating powerhouse with improving profitability and a robust balance sheet. Its main point of vigilance is a return on invested capital (ROIC) that still trails its cost of capital, signaling value destruction despite upward trends. TDY suits portfolios seeking aggressive growth with some tolerance for cyclical risks.
Novanta Inc. (NOVT) offers a strategic moat through specialized technology and recurring revenue streams, providing more predictable cash flows. However, its elevated valuation metrics and weaker financial leverage compared to TDY suggest caution. NOVT fits well in Growth at a Reasonable Price (GARP) portfolios that prioritize stability over rapid expansion.
If you prioritize aggressive growth and improving operating efficiency, TDY is the compelling choice due to its strong cash flow generation and favorable income trends. However, if you seek a steadier profile with a durable strategic moat, NOVT offers better stability despite higher valuation risks. Both require careful risk assessment aligned with your portfolio objectives.
Disclaimer: Investment carries a risk of loss of initial capital. The past performance is not a reliable indicator of future results. Be sure to understand risks before making an investment decision.
Go Further
I encourage you to read the complete analyses of Teledyne Technologies Incorporated and Novanta Inc. to enhance your investment decisions: