Home > Comparison > Technology > TEL vs NOVT
The strategic rivalry between TE Connectivity Ltd. and Novanta Inc. shapes the competitive dynamics in the technology hardware sector. TE Connectivity operates as a global industrial powerhouse with diversified connectivity and sensor solutions, while Novanta specializes in high-precision photonics and motion components. This analysis explores their contrasting operational models and growth trajectories to identify which offers a superior risk-adjusted return for diversified portfolios amid evolving market demands.
Table of contents
Companies Overview
TE Connectivity Ltd. and Novanta Inc. represent key players in the hardware and equipment parts sector with distinct market footprints.
TE Connectivity Ltd.: Global Connectivity Powerhouse
TE Connectivity stands as a leader in connectivity and sensor solutions worldwide. It generates revenue by supplying terminals, connectors, sensors, and related components across transportation, industrial, and communications markets. In 2026, the company focuses strategically on expanding its integrated solutions across automotive and industrial sectors to leverage rising demand for smart, connected devices.
Novanta Inc.: Precision Photonics Innovator
Novanta shines as a specialist in photonics, vision, and precision motion components serving medical and industrial OEMs. Its revenue stems from laser systems, medical visualization, and motion control technologies. For 2026, Novanta prioritizes innovation in medical-grade technologies and laser applications to deepen penetration in life sciences and industrial processing markets.
Strategic Collision: Similarities & Divergences
Both firms operate in hardware but diverge sharply: TE Connectivity emphasizes a broad connectivity ecosystem while Novanta pursues niche, high-precision photonics and motion solutions. Their primary battleground lies in supplying advanced components to industrial and medical OEMs. Investors face contrasting profiles—TE Connectivity offers scale and diversification, whereas Novanta delivers specialized innovation with higher growth volatility.
Income Statement Comparison
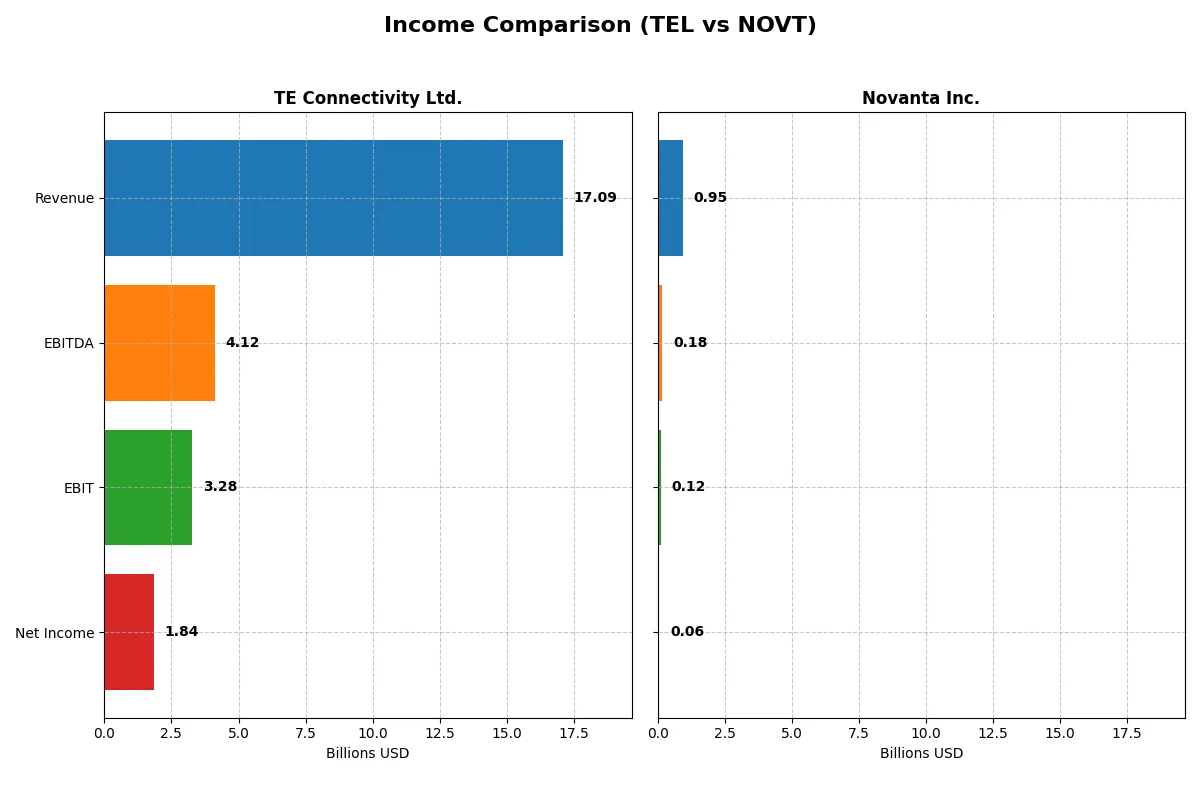
This data dissects the core profitability and scalability of both corporate engines to reveal who dominates the bottom line:
| Metric | TE Connectivity Ltd. (TEL) | Novanta Inc. (NOVT) |
|---|---|---|
| Revenue | 17.1B | 949M |
| Cost of Revenue | 11.2B | 528M |
| Operating Expenses | 2.7B | 311M |
| Gross Profit | 5.9B | 422M |
| EBITDA | 4.1B | 180M |
| EBIT | 3.3B | 124M |
| Interest Expense | 77M | 31M |
| Net Income | 1.8B | 64M |
| EPS | 6.2 | 1.78 |
| Fiscal Year | 2025 | 2024 |
Income Statement Analysis: The Bottom-Line Duel
This income statement comparison exposes which company runs a more efficient and profitable business engine through recent financial performances.
TE Connectivity Ltd. Analysis
TE Connectivity’s revenue grew steadily to 17.1B in 2025, up 7.9% year-over-year, but net income declined sharply to 1.84B. Its gross margin holds strong at 34.6%, and operating efficiency improved with EBIT margin at 19.2%. However, net margin fell nearly 47%, signaling pressure on bottom-line profitability despite solid top-line and operational gains.
Novanta Inc. Analysis
Novanta posted 949M revenue in 2024, rising 7.7% from 2023, alongside a 6.75% net margin. Its gross margin is impressively high at 44.4%, though EBIT margin is lower at 13.1%. Novanta’s net income declined 18.3% year-over-year, yet the company shows robust overall period growth in revenue and net income, reflecting momentum in scaling profitability.
Margin Strength vs. Growth Momentum
TE Connectivity excels in operational margins and scale but struggles with net income contraction, indicating possible cost or tax headwinds. Novanta delivers superior gross margin and sustained revenue growth, with a healthier upward net income trend over the long term. Investors seeking margin resilience might favor TE, while those prioritizing growth momentum could lean toward Novanta’s profile.
Financial Ratios Comparison
These vital ratios act as a diagnostic tool to expose the underlying fiscal health, valuation premiums, and capital efficiency of the companies analyzed:
| Ratios | TE Connectivity Ltd. (TEL) | Novanta Inc. (NOVT) |
|---|---|---|
| ROE | 14.6% | 8.6% |
| ROIC | 8.8% | 7.3% |
| P/E | 35.0 | 85.7 |
| P/B | 5.1 | 7.4 |
| Current Ratio | 1.56 | 2.58 |
| Quick Ratio | 1.03 | 1.72 |
| D/E | 0.52 | 0.63 |
| Debt-to-Assets | 26.1% | 33.9% |
| Interest Coverage | 41.7 | 3.51 |
| Asset Turnover | 0.68 | 0.68 |
| Fixed Asset Turnover | 3.96 | 6.08 |
| Payout ratio | 43.6% | 0% |
| Dividend yield | 1.25% | 0% |
| Fiscal Year | 2025 | 2024 |
Efficiency & Valuation Duel: The Vital Signs
Ratios serve as a company’s DNA, unveiling hidden risks and operational strengths that raw numbers alone cannot expose.
TE Connectivity Ltd.
TE Connectivity posts a solid 14.6% ROE with a favorable 10.8% net margin, reflecting consistent profitability. Its P/E of 35 and P/B of 5.12 mark the stock as expensive relative to sector norms. The 1.25% dividend yield complements moderate buybacks, balancing shareholder returns with R&D investment near 4.9% of revenue.
Novanta Inc.
Novanta shows a weaker 8.6% ROE and a 6.8% net margin, highlighting modest profitability. Its valuation is stretched with a high P/E of 85.7 and P/B of 7.37, indicating significant growth expectations priced in. Novanta pays no dividend, instead reinvesting heavily in R&D at over 10% of revenue to fuel future expansion.
Premium Valuation vs. Operational Safety
TE Connectivity offers a more balanced risk-reward profile with better profitability and a modest dividend, despite a high valuation. Novanta’s valuation appears stretched, reflecting higher risk with lower returns. Investors seeking operational safety may prefer TE, while growth-oriented profiles might consider Novanta’s reinvestment strategy.
Which one offers the Superior Shareholder Reward?
I compare TE Connectivity Ltd. (TEL) and Novanta Inc. (NOVT) on dividends, buybacks, and growth reinvestment. TEL yields 1.25%–1.9% with a sustainable 24–44% payout ratio, backed by solid free cash flow coverage (~0.77–0.80). It pairs dividends with modest buybacks, enhancing total return. NOVT pays no dividends but reinvests heavily in R&D and capex, fueling top-line growth. However, NOVT’s sky-high P/E (65–85+) and price-to-free-cash-flow (30–60) suggest rich valuation risk. Buybacks are negligible at NOVT, limiting direct shareholder rewards. I find TEL’s balanced distribution model offers a more attractive and sustainable shareholder return in 2026.
Comparative Score Analysis: The Strategic Profile
The radar chart reveals the fundamental DNA and trade-offs of TE Connectivity Ltd. and Novanta Inc., highlighting their strategic strengths and vulnerabilities:
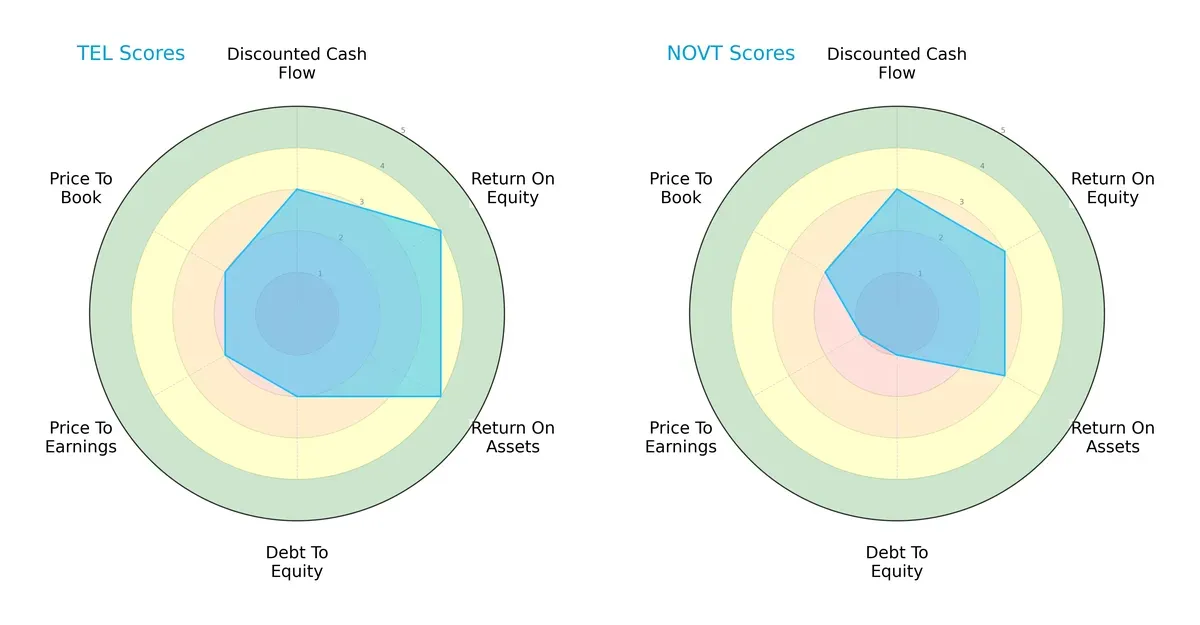
TE Connectivity Ltd. displays a more balanced profile with favorable ROE and ROA scores (4 each), indicating efficient profit and asset utilization. Novanta Inc. lags slightly with moderate scores (3) in these areas. TE’s moderate debt-to-equity score (2) contrasts with Novanta’s very unfavorable debt position (1), signaling higher financial risk for Novanta. Both companies share moderate DCF scores (3), but Novanta’s weaker valuation scores (P/E and P/B) suggest potential overvaluation risks compared to TE’s moderate valuation metrics.
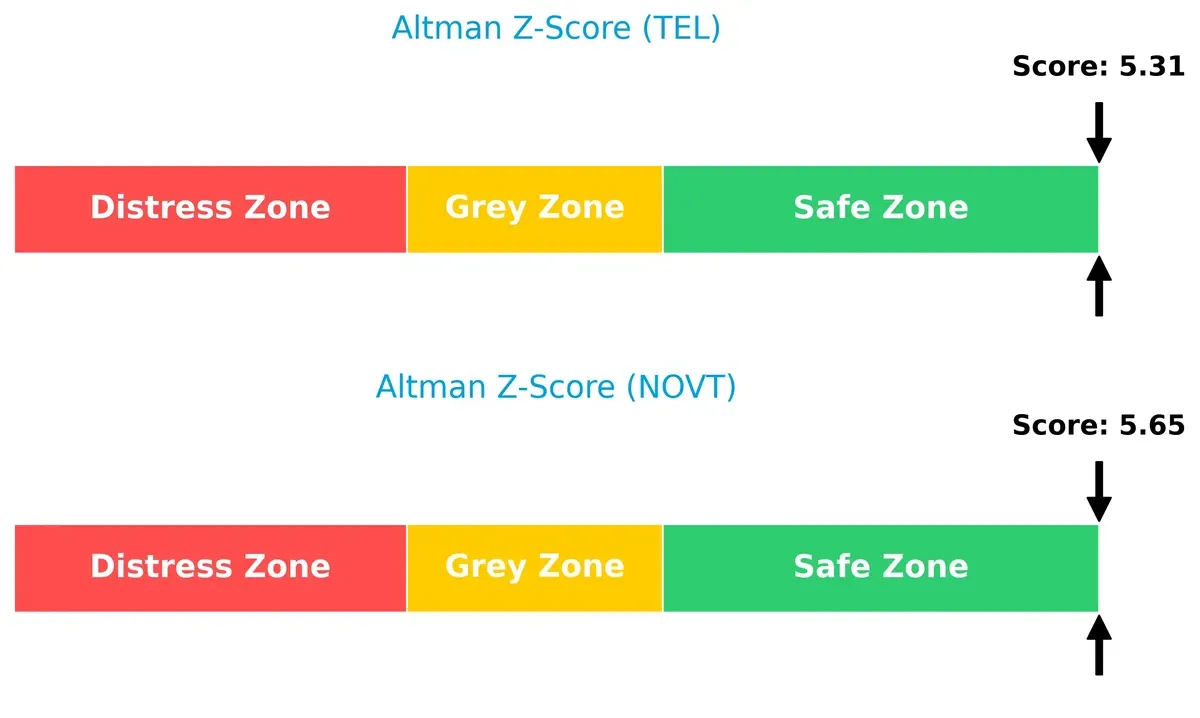
Bankruptcy Risk: Solvency Showdown
TE Connectivity Ltd. and Novanta Inc. both reside comfortably in the safe zone with Altman Z-Scores above 5, implying robust long-term survival prospects in this cycle:
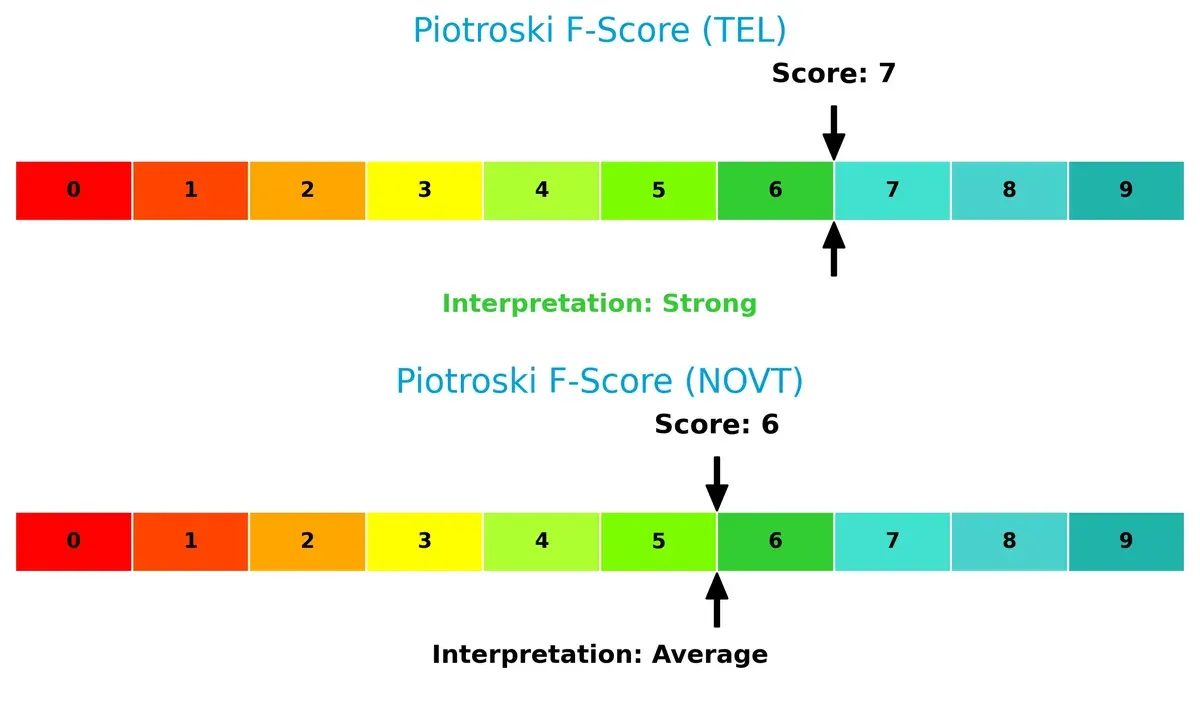
Financial Health: Quality of Operations
TE Connectivity Ltd. leads with a strong Piotroski F-Score of 7, indicating solid financial health and operational quality. Novanta Inc.’s average score of 6 suggests some internal metric weaknesses but no immediate red flags:
How are the two companies positioned?
This section dissects TEL and NOVT’s operational DNA by comparing revenue distribution and internal dynamics. The goal is to confront their economic moats to identify which offers the most resilient, sustainable advantage today.
Revenue Segmentation: The Strategic Mix
This visual comparison dissects how TE Connectivity Ltd. and Novanta Inc. diversify their income streams and reveals where their primary sector bets lie:
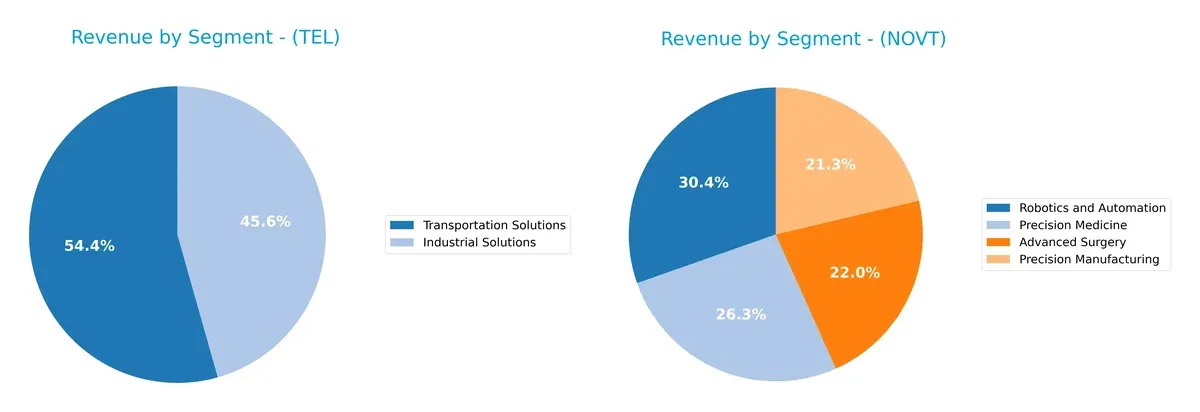
TE Connectivity’s 2025 revenue pivots heavily on Transportation Solutions at $9.39B and Industrial Solutions at $7.87B, showing moderate diversification but clear reliance on two dominant segments. Novanta, by contrast, spreads its 2024 revenue more evenly across Robotics and Automation ($288M), Precision Medicine ($250M), Advanced Surgery ($209M), and Precision Manufacturing ($202M). TE Connectivity’s concentration signals infrastructure dominance with some sector risk, while Novanta’s balanced mix reflects a strategic bet on diversified medical technology innovation.
Strengths and Weaknesses Comparison
This table compares the strengths and weaknesses of TE Connectivity Ltd. and Novanta Inc.:
TE Connectivity Ltd. Strengths
- Strong global presence with diverse revenue across China, US, Europe, and Asia-Pacific
- Balanced product segmentation with Industrial and Transportation Solutions generating multi-billion revenues
- Favorable net margin of 10.78% and solid liquidity ratios (current 1.56, quick 1.03)
- Low debt to assets at 26.12% and high interest coverage of 42.61
- Favorable fixed asset turnover at 3.96 indicates efficient asset use
Novanta Inc. Strengths
- Niche market focus with diversified segments in Precision Manufacturing, Robotics, and Advanced Surgery
- Favorable liquidity ratios (current 2.58, quick 1.72) support operational stability
- Strong fixed asset turnover of 6.08 shows efficient capital utilization
- Presence in US, Germany, China, and Asia-Pacific with steady regional revenue streams
TE Connectivity Ltd. Weaknesses
- Elevated valuation multiples with P/E at 35.0 and P/B at 5.12 labeled unfavorable
- Neutral ROE (14.64%) and ROIC (8.82%) close to WACC (9.09%) suggest limited value creation above cost of capital
- Asset turnover moderate at 0.68, indicating room for operational efficiency gains
Novanta Inc. Weaknesses
- Low profitability with net margin at 6.75% and unfavorable ROE of 8.59% below industry average
- Unfavorable WACC at 10.97% increases capital cost burden
- High P/E (85.7) and P/B (7.37) ratios indicate expensive valuation
- Zero dividend yield limits income appeal
- Moderate interest coverage of 3.95 raises caution on debt servicing
TE Connectivity exhibits robust global diversification and solid profitability but faces valuation and capital efficiency pressures. Novanta shows focused innovation and strong asset use yet struggles with profitability and valuation risks. These factors distinctly shape each company’s strategic priorities.
The Moat Duel: Analyzing Competitive Defensibility
A structural moat is the only shield protecting long-term profits from relentless competitive erosion. Here’s how TE Connectivity and Novanta stack up:
TE Connectivity Ltd.: Scale-Driven Engineering Moat
TE Connectivity’s moat stems from entrenched scale and specialized connectivity solutions. This manifests in stable 19.2% EBIT margins but a worrying declining ROIC trend signals weakening capital efficiency in 2026.
Novanta Inc.: Innovation-Backed Precision Moat
Novanta leverages advanced photonics and precision motion tech, differentiating from TE’s scale. Its modest 13.1% EBIT margins grow alongside improving ROIC, hinting at strengthening competitive positioning and market expansion potential.
Scale Economies vs. Innovation Leadership
TE Connectivity’s larger scale offers a broader moat but its eroding ROIC is a red flag. Novanta’s rising ROIC and innovation focus suggest a deeper, more sustainable moat. Novanta is better equipped to defend and grow market share in the evolving 2026 landscape.
Which stock offers better returns?
The past year shows TE Connectivity Ltd. surging over 60%, while Novanta Inc. declined by more than 20%, reflecting divergent market dynamics and investor sentiment.
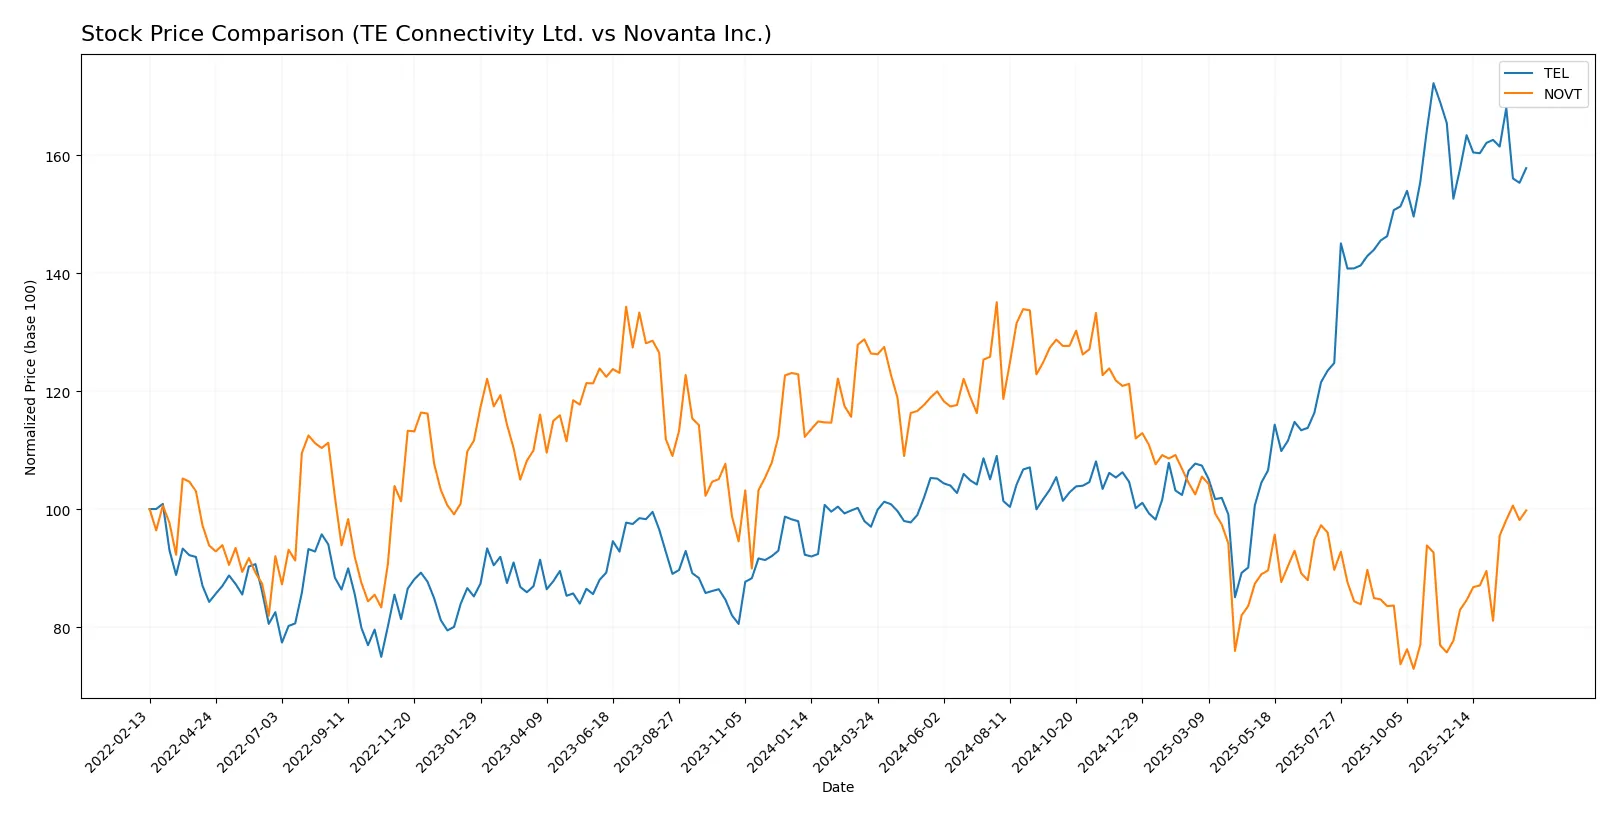
Trend Comparison
TE Connectivity Ltd. delivered a strong 62.65% gain over 12 months, marking a bullish but decelerating trend with a high price of 247.01 and notable volatility (std dev 34.56).
Novanta Inc. experienced a 21.05% drop in the same period, a bearish trend accelerating downward despite a recent rebound of 28.42%, with lower volatility (std dev 24.6).
TE Connectivity Ltd. outperformed Novanta Inc. significantly, posting the highest market returns and demonstrating more sustained price strength overall.
Target Prices
Analysts present a solid target consensus for TE Connectivity Ltd. and Novanta Inc., signaling potential upside from current prices.
| Company | Target Low | Target High | Consensus |
|---|---|---|---|
| TE Connectivity Ltd. | 238 | 306 | 270.29 |
| Novanta Inc. | 160 | 160 | 160 |
TE Connectivity’s target consensus sits about 19% above its $226 current price, indicating moderate upside. Novanta’s fixed target at $160 suggests a 17% premium versus its $137 share price.

Don’t Let Luck Decide Your Entry Point
Optimize your entry points with our advanced ProRealTime indicators. You’ll get efficient buy signals with precise price targets for maximum performance. Start outperforming now!
How do institutions grade them?
TE Connectivity Ltd. Grades
The following table summarizes recent institutional grades for TE Connectivity Ltd.:
| Grading Company | Action | New Grade | Date |
|---|---|---|---|
| Oppenheimer | Upgrade | Outperform | 2026-01-27 |
| Barclays | Maintain | Overweight | 2026-01-23 |
| Truist Securities | Maintain | Hold | 2026-01-22 |
| Wells Fargo | Maintain | Equal Weight | 2026-01-22 |
| UBS | Maintain | Buy | 2026-01-14 |
| Truist Securities | Maintain | Hold | 2025-12-19 |
| Wells Fargo | Maintain | Equal Weight | 2025-12-09 |
| Truist Securities | Maintain | Hold | 2025-11-21 |
| Barclays | Maintain | Overweight | 2025-11-21 |
| TD Cowen | Maintain | Buy | 2025-11-17 |
Novanta Inc. Grades
Below is the summary of recent grades issued for Novanta Inc.:
| Grading Company | Action | New Grade | Date |
|---|---|---|---|
| Baird | Maintain | Neutral | 2025-08-11 |
| Baird | Maintain | Neutral | 2025-03-03 |
| Baird | Maintain | Neutral | 2024-11-06 |
| Baird | Maintain | Neutral | 2024-08-07 |
| Baird | Maintain | Neutral | 2023-05-11 |
| Baird | Maintain | Neutral | 2023-05-10 |
| William Blair | Upgrade | Outperform | 2022-05-11 |
| William Blair | Upgrade | Outperform | 2022-05-10 |
| Berenberg | Maintain | Hold | 2020-11-13 |
| Baird | Maintain | Neutral | 2020-05-13 |
Which company has the best grades?
TE Connectivity Ltd. consistently receives positive ratings, including Outperform and Buy. Novanta Inc. holds mainly Neutral grades with few upgrades. Investors might view TE Connectivity as having stronger institutional support.
Risks specific to each company
The following categories identify the critical pressure points and systemic threats facing both firms in the 2026 market environment:
1. Market & Competition
TE Connectivity Ltd.
- Operates globally in diversified segments with strong scale advantages, facing intense competition in industrial and communications markets.
Novanta Inc.
- Focuses on photonics and precision motion markets with niche technologies but higher vulnerability to specialized competitors.
2. Capital Structure & Debt
TE Connectivity Ltd.
- Moderate debt-to-assets (26.1%) with strong interest coverage (42.6x), indicating solid debt management.
Novanta Inc.
- Higher leverage (33.9% debt-to-assets) and weaker interest coverage (3.95x), signaling elevated financial risk.
3. Stock Volatility
TE Connectivity Ltd.
- Beta at 1.24 suggests moderate sensitivity to market swings, consistent with sector norms.
Novanta Inc.
- Higher beta at 1.62, indicating greater stock price volatility and risk for investors.
4. Regulatory & Legal
TE Connectivity Ltd.
- Operates worldwide, exposed to complex regulatory regimes but benefits from diversified geographic risk.
Novanta Inc.
- US-centric operations face domestic regulatory scrutiny but limited global exposure reduces regulatory complexity.
5. Supply Chain & Operations
TE Connectivity Ltd.
- Global supply chain spanning 140 countries, susceptible to geopolitical disruptions but diversified sources mitigate risks.
Novanta Inc.
- More specialized supply chain for high-precision components, vulnerable to supplier concentration and technical bottlenecks.
6. ESG & Climate Transition
TE Connectivity Ltd.
- Larger firm with growing ESG initiatives; pressure to meet evolving global climate standards.
Novanta Inc.
- Smaller scale may limit resources for ESG investments, increasing transitional risk exposure.
7. Geopolitical Exposure
TE Connectivity Ltd.
- Headquartered in Switzerland with broad international exposure, faces risks from US-China tensions and regional instability.
Novanta Inc.
- US-based with less international footprint, more exposed to domestic policy shifts and trade regulations.
Which company shows a better risk-adjusted profile?
TE Connectivity Ltd. demonstrates a better risk-adjusted profile overall. Its robust interest coverage, moderate leverage, and diversified global operations provide resilience against market and geopolitical shocks. Novanta’s higher financial leverage, stock volatility, and niche market focus amplify its risk. Notably, TE’s Altman Z-score remains solidly in the safe zone at 5.3, underscoring its financial stability. Conversely, Novanta’s elevated P/E of 85.7 signals potential overvaluation risk amid weaker profitability and credit metrics.
Final Verdict: Which stock to choose?
TE Connectivity Ltd. (TEL) excels as a cash-generative industrial powerhouse with strong operational efficiency and solid balance sheet metrics. Its key point of vigilance remains a declining return on invested capital, signaling potential value erosion ahead. TEL suits investors seeking steady, slightly favorable exposure within an income and moderate growth portfolio.
Novanta Inc. (NOVT) boasts a strategic moat rooted in advanced technology and a growing return on invested capital trend. Though its valuation appears stretched and leverage elevated, NOVT offers relative safety through consistent revenue growth and a robust cash conversion cycle. It fits well in a GARP portfolio aiming for sustained capital appreciation with moderate risk.
If you prioritize resilient cash flow and operational stability, TEL is the compelling choice due to its strong balance sheet and consistent profitability. However, if you seek growth with improving profitability and can tolerate higher valuation risk, NOVT offers better upside potential supported by its technological moat and expanding ROIC. Both present analytical scenarios for differing investor profiles, demanding careful risk management.
Disclaimer: Investment carries a risk of loss of initial capital. The past performance is not a reliable indicator of future results. Be sure to understand risks before making an investment decision.
Go Further
I encourage you to read the complete analyses of TE Connectivity Ltd. and Novanta Inc. to enhance your investment decisions: