Home > Comparison > Technology > SANM vs NOVT
The strategic rivalry between Sanmina Corporation and Novanta Inc. shapes the future of the technology hardware sector. Sanmina operates as an integrated manufacturing powerhouse, delivering comprehensive solutions across diverse industries. Novanta specializes in photonics and precision motion components, focusing on high-tech medical and industrial niches. This analysis pits broad industrial scale against specialized innovation to identify which model offers a superior risk-adjusted return for a diversified portfolio.

Table of contents
Companies Overview
Sanmina Corporation and Novanta Inc. stand as pivotal innovators in the hardware and equipment sector, shaping technology’s backbone globally.
Sanmina Corporation: Integrated Manufacturing Powerhouse
Sanmina dominates as a provider of integrated manufacturing solutions and components. It generates revenue primarily through design, engineering, and manufacturing services for OEMs in industrial, medical, aerospace, and communications. In 2026, it sharpens its focus on expanding cloud-based manufacturing execution software and enhancing supply chain management, reinforcing its comprehensive service ecosystem.
Novanta Inc.: Precision Photonics and Motion Leader
Novanta excels in photonics, vision, and precision motion components for medical and industrial markets. Its revenue stems from high-tech laser products, medical visualization solutions, and motion control systems. The 2026 strategy centers on advancing photonics-based applications and integrating sophisticated motion technologies to solidify its niche in cutting-edge medical and industrial equipment.
Strategic Collision: Similarities & Divergences
Both companies serve OEMs within technology hardware but diverge sharply in scope. Sanmina pursues a broad integrated manufacturing model, while Novanta focuses on specialized photonics and motion components. Their primary battleground lies in industrial and medical technology innovation. Sanmina offers scale and end-to-end solutions; Novanta delivers precision and niche expertise, creating distinct investment profiles for diversified portfolios.
Income Statement Comparison
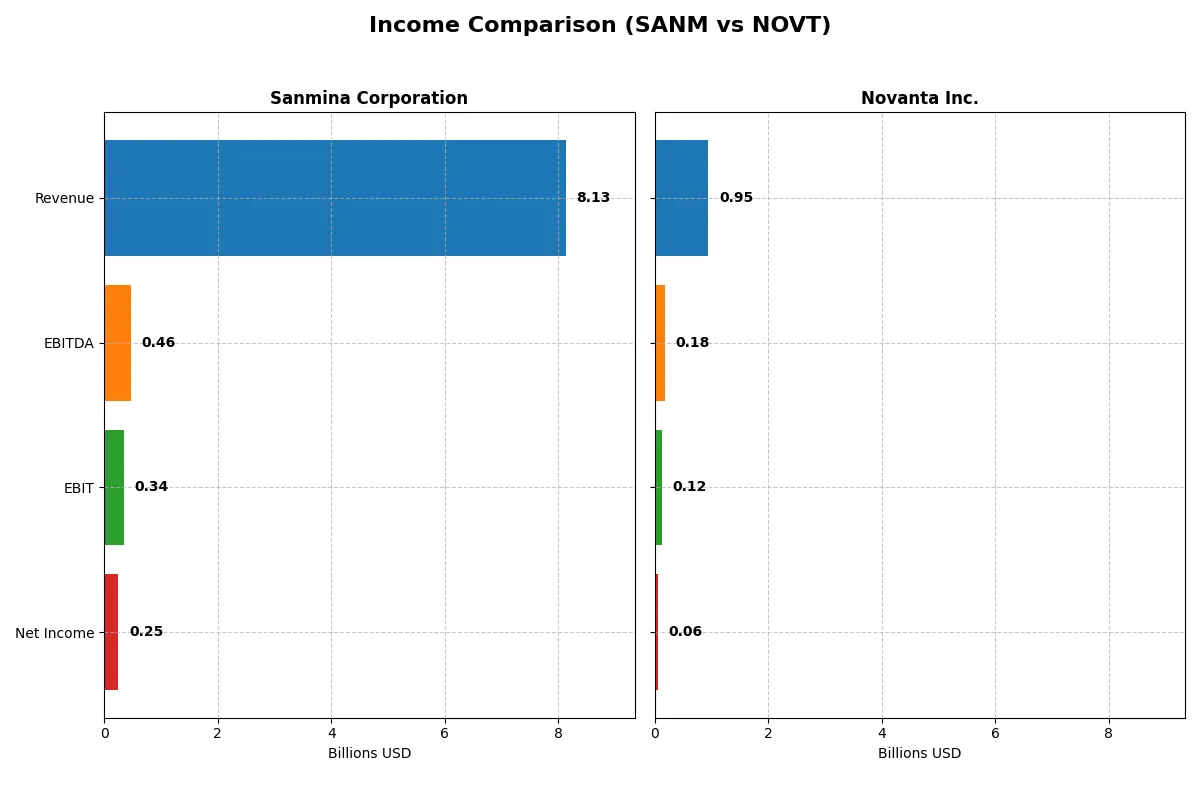
This data dissects the core profitability and scalability of both corporate engines to reveal who dominates the bottom line:
| Metric | Sanmina Corporation (SANM) | Novanta Inc. (NOVT) |
|---|---|---|
| Revenue | 8.13B | 949M |
| Cost of Revenue | 7.41B | 528M |
| Operating Expenses | 362M | 311M |
| Gross Profit | 716M | 422M |
| EBITDA | 463M | 180M |
| EBIT | 344M | 124M |
| Interest Expense | 4.3M | 31M |
| Net Income | 246M | 64M |
| EPS | 4.56 | 1.78 |
| Fiscal Year | 2025 | 2024 |
Income Statement Analysis: The Bottom-Line Duel
This comparison exposes the true operational efficiency and profitability dynamics of two distinct corporate engines.
Sanmina Corporation Analysis
Sanmina’s revenue grew steadily, reaching $8.13B in 2025, up 7.4% year-over-year. Net income, however, dipped slightly to $246M, reflecting margin pressure. Its gross margin holds firm at 8.81%, but a flat EBIT margin of 4.23% signals limited operating leverage. Recent EPS growth of 14% shows improving shareholder returns despite modest net income trends.
Novanta Inc. Analysis
Novanta posted $949M revenue in 2024, up 7.7% year-over-year, with net income declining to $64M. Despite this slip, Novanta sustains strong margins: a 44.4% gross margin and a 13.1% EBIT margin. Operating expenses align well with revenue growth. EPS contraction of 12% contrasts with a robust 42% EPS growth over the longer term, indicating cyclical earnings volatility.
Margin Power vs. Revenue Scale
Sanmina offers scale with steady revenue growth but struggles to expand margins, resulting in subdued net income momentum. Novanta delivers superior margin performance and stronger long-term earnings growth but faces near-term net income and EPS declines. For investors, Sanmina’s scale contrasts with Novanta’s margin-driven profitability profile.
Financial Ratios Comparison
These vital ratios act as a diagnostic tool to expose the underlying fiscal health, valuation premiums, and capital efficiency of the companies compared below:
| Ratios | Sanmina Corporation (SANM) | Novanta Inc. (NOVT) |
|---|---|---|
| ROE | 10.4% | 8.6% |
| ROIC | 9.0% | 7.3% |
| P/E | 25.6 | 85.7 |
| P/B | 2.67 | 7.37 |
| Current Ratio | 1.72 | 2.58 |
| Quick Ratio | 1.02 | 1.72 |
| D/E (Debt to Equity) | 0.17 | 0.63 |
| Debt-to-Assets | 6.7% | 33.9% |
| Interest Coverage | 82.5 | 3.5 |
| Asset Turnover | 1.39 | 0.68 |
| Fixed Asset Turnover | 11.9 | 6.08 |
| Payout ratio | 0 | 0 |
| Dividend yield | 0 | 0 |
| Fiscal Year | 2025 | 2024 |
Efficiency & Valuation Duel: The Vital Signs
Financial ratios act as a company’s DNA, exposing hidden risks and operational efficiency critical for investment decisions.
Sanmina Corporation
Sanmina displays a neutral ROE of 10.45% with slim net margins at 3.03%, signaling moderate profitability. Its P/E at 25.59 suggests a somewhat stretched valuation compared to sector averages. The company pays no dividend, instead reinvesting modestly in R&D and growth initiatives, balancing shareholder returns with future prospects.
Novanta Inc.
Novanta posts a lower ROE of 8.59% with a healthier net margin of 6.75%, reflecting operational efficiency but weaker equity returns. Valuation multiples are steep, with a P/E of 85.7 and a P/B of 7.37, indicating an expensive stock. No dividends are paid, focusing heavily on R&D to drive innovation and long-term growth.
Premium Valuation vs. Operational Safety
Sanmina offers a more balanced risk-reward profile with neutral profitability and reasonable valuation. Novanta’s premium multiples reflect high growth expectations but come with elevated risk. Investors prioritizing steady operational metrics may lean toward Sanmina, while growth seekers might tolerate Novanta’s valuation stretch.
Which one offers the Superior Shareholder Reward?
Sanmina Corporation (SANM) and Novanta Inc. (NOVT) both avoid dividends, focusing on growth and buybacks. SANM shows zero dividend yield and payout ratio but returns capital via moderate buybacks supported by strong free cash flow (8.6/share in 2025). NOVT also pays no dividends but invests heavily in R&D and growth, reflected in higher operating margins (13.1% vs. 4.2%) and capex efficiency. Novanta’s buyback activity is less apparent but its superior cash flow coverage (89%) and robust operating cash flow ratio (94%) suggest sustainable capital allocation. SANM’s valuation is more attractive (P/E 25.6 vs. NOVT’s 85.7), but Novanta’s superior margin and reinvestment strategy promise stronger long-term shareholder value. I conclude Novanta offers the superior total return profile for 2026 investors, balancing growth with prudent capital returns.
Comparative Score Analysis: The Strategic Profile
The radar chart reveals the fundamental DNA and trade-offs of Sanmina Corporation and Novanta Inc., highlighting their financial strengths and valuation nuances:
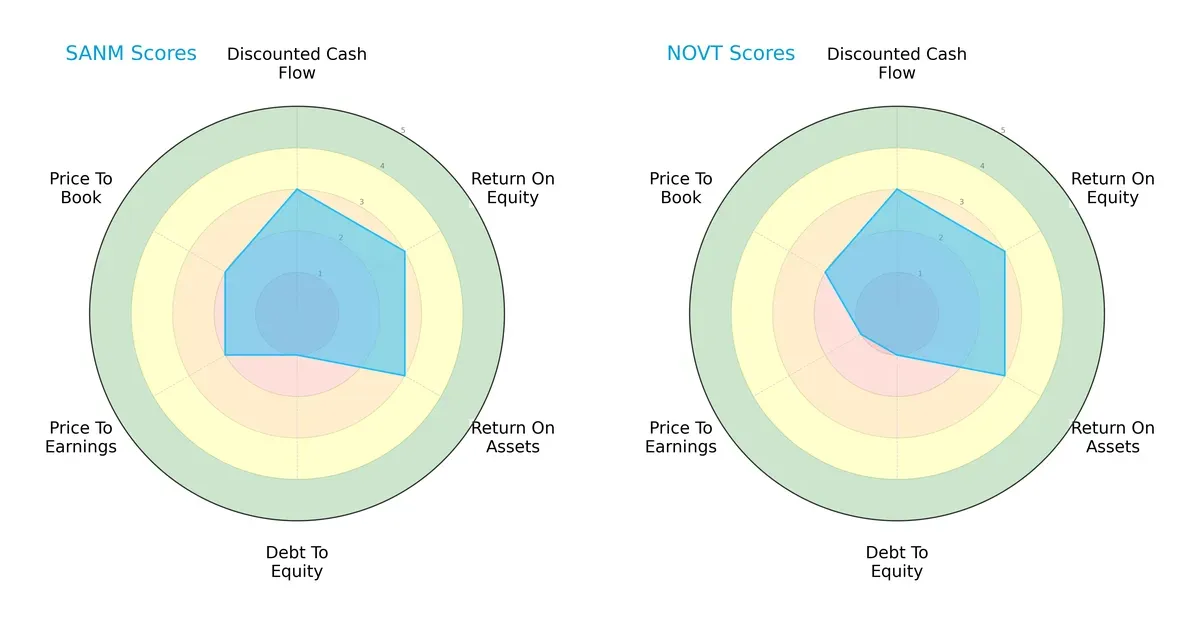
Both firms show moderate strength in discounted cash flow, return on equity, and return on assets, indicating efficient asset use and profit generation. However, both suffer very unfavorable debt-to-equity scores, signaling elevated financial risk. Sanmina edges Novanta in valuation metrics (P/E and P/B), suggesting a more balanced investment profile, while Novanta leans on its operational efficiency but faces significant valuation headwinds.
Bankruptcy Risk: Solvency Showdown
The Altman Z-Score gap between Sanmina (1.83) and Novanta (5.65) signals distinct solvency profiles in this market cycle:
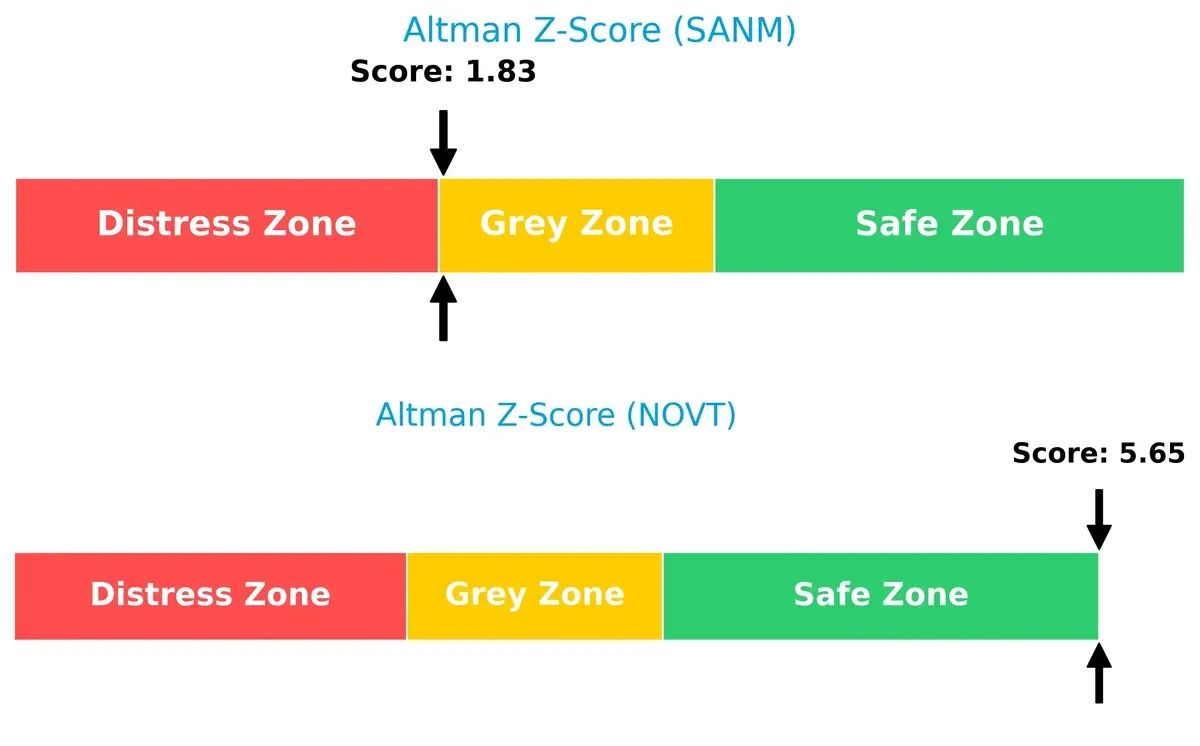
Sanmina teeters in the grey zone, implying a moderate bankruptcy risk amid economic headwinds. Novanta’s safe zone score marks robust financial stability, enhancing its long-term survival odds despite broader sector volatility.
Financial Health: Quality of Operations
Piotroski F-Scores place Sanmina at 5 and Novanta at 6, both reflecting average operational quality but with notable differences:
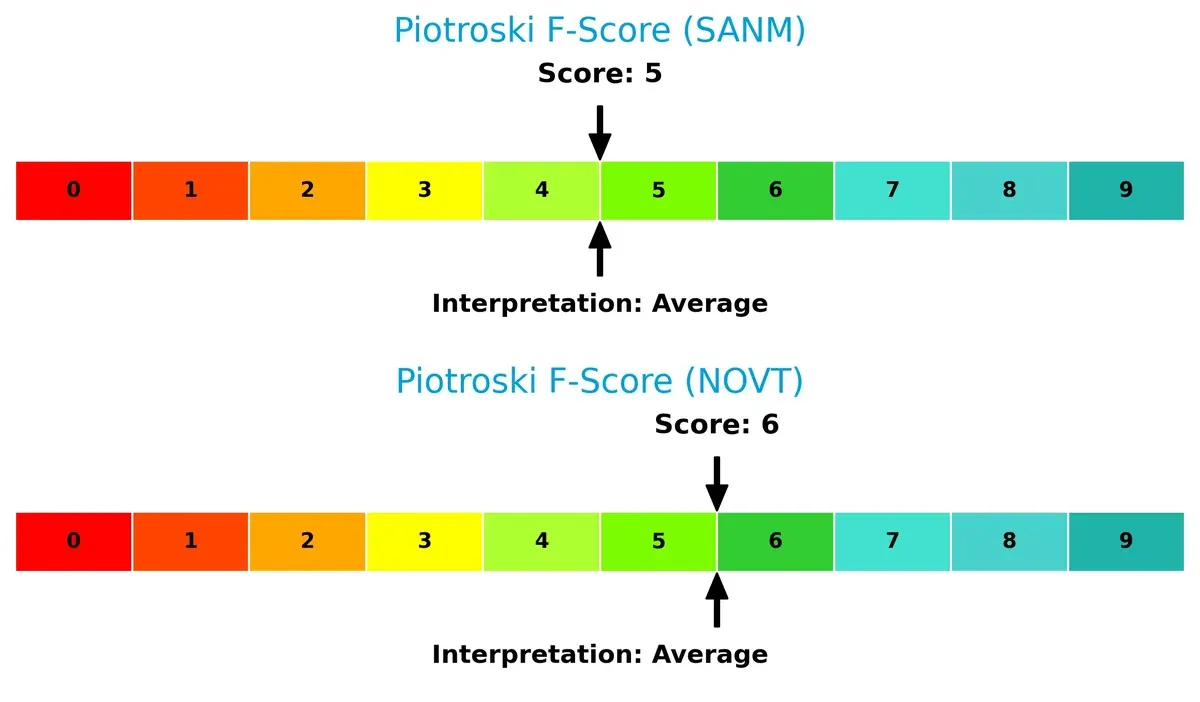
Novanta’s slightly higher score suggests marginally better financial health and operational metrics. Neither firm shows red flags, but Sanmina’s lower score warrants cautious monitoring of internal efficiencies and profitability trends.
How are the two companies positioned?
This section dissects the operational DNA of Sanmina and Novanta by comparing their revenue distribution and internal dynamics. The goal is to confront their economic moats and identify which model offers the most resilient competitive advantage today.
Revenue Segmentation: The Strategic Mix
This visual comparison dissects how Sanmina Corporation and Novanta Inc. diversify their income streams and highlights their primary sector bets:
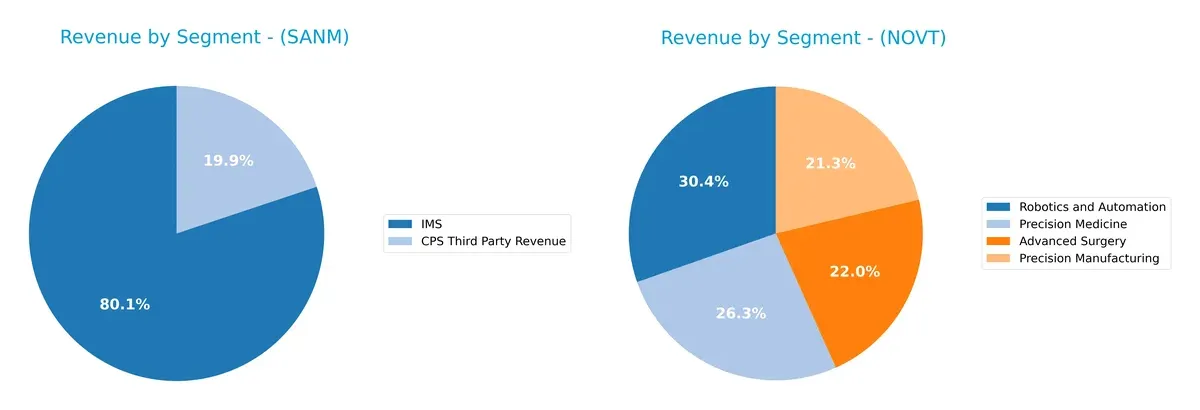
Sanmina anchors its revenue in IMS, generating over $6.5B in 2025, dwarfing its CPS Third Party Revenue at $1.6B. This indicates a concentrated focus on infrastructure solutions. Novanta, by contrast, spreads roughly $950M across Precision Manufacturing, Robotics, Advanced Surgery, and Precision Medicine, showing a balanced portfolio. Sanmina’s concentration risks contrast with Novanta’s diversified bets, which may offer more resilience against sector-specific downturns.
Strengths and Weaknesses Comparison
This table compares the strengths and weaknesses of Sanmina Corporation and Novanta Inc.:
Sanmina Strengths
- Strong global presence with $4.65B Americas and $2.61B Asia Pacific revenue
- Favorable liquidity ratios; current ratio 1.72 and quick ratio 1.02
- Low leverage with debt-to-assets at 6.73% and high interest coverage of 80
- Efficient asset turnover at 1.39 and fixed asset turnover at 11.91
Novanta Strengths
- Diversified product portfolio across Precision Manufacturing, Robotics, Advanced Surgery, and Precision Medicine
- Favorable liquidity with current ratio 2.58 and quick ratio 1.72
- Favorable fixed asset turnover at 6.08
- Solid global footprint including $487M US and $123M Germany revenue
Sanmina Weaknesses
- Low net margin at 3.03% flagged unfavorable
- PE ratio elevated at 25.59, considered unfavorable
- No dividend yield
- Neutral ROE at 10.45% and ROIC at 9.04% just above WACC at 8.42%
Novanta Weaknesses
- Unfavorable high PE at 85.7 and PB at 7.37
- ROE weak at 8.59% and WACC high at 10.97%
- Moderate leverage with debt-to-assets at 33.92%
- Interest coverage only neutral at 3.95
- No dividend yield
Sanmina’s strengths lie in strong operational efficiency and conservative financial structure supporting stable margins. Novanta shows strength in product diversification and liquidity but faces valuation and profitability concerns. Both companies lack dividend yield, affecting income-focused investors.
The Moat Duel: Analyzing Competitive Defensibility
A structural moat is the only reliable shield protecting long-term profits from relentless competitive erosion. Let’s dissect the moats of two tech hardware peers:
Sanmina Corporation: Integrated Manufacturing Scale and Supply Chain Expertise
Sanmina’s moat stems from its complex supply chain integration and scale economies. Its modest ROIC below WACC signals weak value creation. Expansion in cloud and defense could deepen the moat but profitability trends remain challenged in 2026.
Novanta Inc.: Precision Photonics Innovation and Niche Specialization
Novanta’s moat lies in proprietary photonics technologies and focused medical-industrial markets, enabling superior margins and growing ROIC despite current value erosion. Innovation and market expansion in advanced lasers support a strengthening competitive edge.
Verdict: Scale Integration vs. Specialized Innovation
Both firms currently fail to create economic value, but Novanta’s rising ROIC and niche leadership suggest a deeper moat. I see Novanta better positioned to defend and grow market share amid evolving tech demands.
Which stock offers better returns?
The past year shows Sanmina Corporation’s stock surging sharply with decelerating momentum, while Novanta Inc.’s shares have declined overall but gained strongly in recent months.
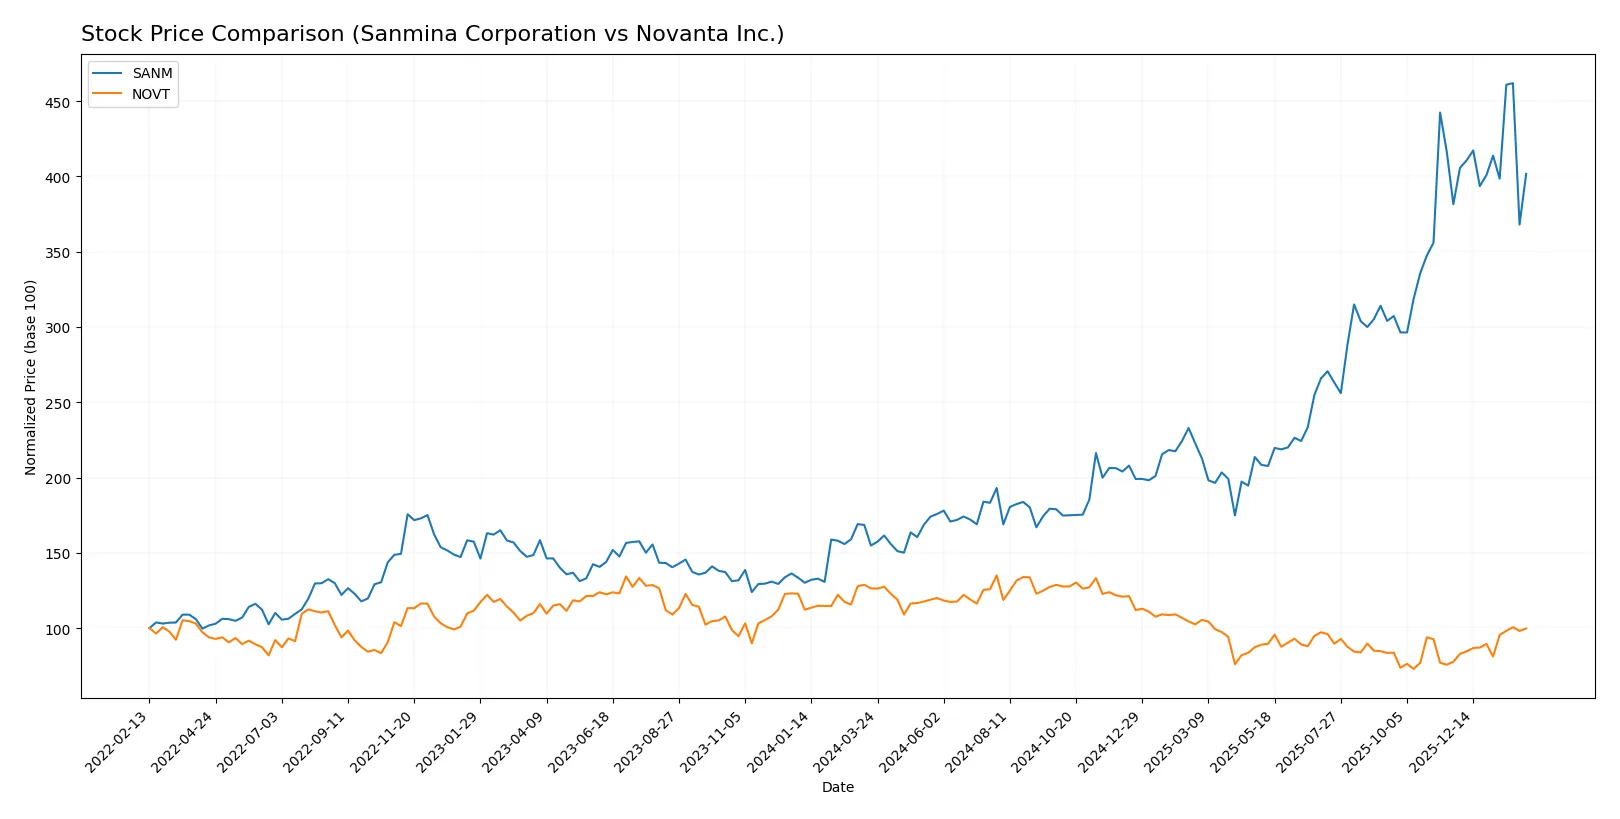
Trend Comparison
Sanmina’s stock climbed 159.44% over the past 12 months, marking a bullish trend with decelerating gains. It ranged between 57.79 and 177.83, reflecting high volatility (32.31 std dev).
Novanta’s stock fell 21.05% over the same period, defining a bearish trend despite accelerating price movement. It traded between 99.96 and 185.16 with moderate volatility (24.6 std dev).
Sanmina outperformed Novanta over the year, delivering the highest market return despite some recent deceleration in gains.
Target Prices
Analysts set clear target price consensus for both Sanmina Corporation and Novanta Inc.
| Company | Target Low | Target High | Consensus |
|---|---|---|---|
| Sanmina Corporation | 200 | 200 | 200 |
| Novanta Inc. | 160 | 160 | 160 |
The consensus targets suggest 29% upside for Sanmina and 17% upside for Novanta from current prices. Analysts expect solid growth ahead relative to today’s valuations.

Don’t Let Luck Decide Your Entry Point
Optimize your entry points with our advanced ProRealTime indicators. You’ll get efficient buy signals with precise price targets for maximum performance. Start outperforming now!
How do institutions grade them?
Sanmina Corporation Grades
The table below summarizes recent institutional grades for Sanmina Corporation.
| Grading Company | Action | New Grade | Date |
|---|---|---|---|
| Argus Research | Maintain | Buy | 2026-01-28 |
| B of A Securities | Maintain | Neutral | 2025-07-11 |
| B of A Securities | Maintain | Neutral | 2025-06-09 |
| B of A Securities | Upgrade | Neutral | 2025-01-29 |
| Craig-Hallum | Maintain | Hold | 2024-11-05 |
Novanta Inc. Grades
The table below summarizes recent institutional grades for Novanta Inc.
| Grading Company | Action | New Grade | Date |
|---|---|---|---|
| Baird | Maintain | Neutral | 2025-08-11 |
| Baird | Maintain | Neutral | 2025-03-03 |
| Baird | Maintain | Neutral | 2024-11-06 |
| Baird | Maintain | Neutral | 2024-08-07 |
| William Blair | Upgrade | Outperform | 2022-05-11 |
Which company has the best grades?
Sanmina holds a Buy rating from Argus Research but mostly Neutral or Hold from others. Novanta consistently receives Neutral grades with a notable Outperform upgrade in 2022. Novanta’s slightly stronger outlook could suggest more investor confidence.
Risks specific to each company
The following categories identify the critical pressure points and systemic threats facing both firms in the 2026 market environment:
1. Market & Competition
Sanmina Corporation
- Faces intense competition in integrated manufacturing solutions across diverse industrial sectors.
Novanta Inc.
- Operates in niche photonics and precision motion segments with high tech barriers but faces specialized rivals.
2. Capital Structure & Debt
Sanmina Corporation
- Maintains a conservative debt level with a debt-to-assets ratio of 6.7%, low financial risk.
Novanta Inc.
- Higher leverage with 33.9% debt-to-assets, increasing financial vulnerability amid rising interest rates.
3. Stock Volatility
Sanmina Corporation
- Exhibits moderate beta of 1.03, suggesting stock moves close to market averages.
Novanta Inc.
- Higher beta at 1.62, indicating greater stock price volatility and risk for investors.
4. Regulatory & Legal
Sanmina Corporation
- Subject to standard technology and manufacturing regulations, with exposure in defense sectors.
Novanta Inc.
- Faces complex regulations in medical devices and photonics, increasing compliance costs and risk.
5. Supply Chain & Operations
Sanmina Corporation
- Benefits from integrated supply chain services but exposed to global manufacturing disruptions.
Novanta Inc.
- Relies on specialized components, vulnerable to supply shortages and operational delays.
6. ESG & Climate Transition
Sanmina Corporation
- Moderate ESG risks inherent in manufacturing and defense supply chains.
Novanta Inc.
- Faces rising ESG scrutiny in medical and industrial tech, with pressure to innovate sustainably.
7. Geopolitical Exposure
Sanmina Corporation
- Global footprint with some exposure to trade tensions impacting supply chain costs.
Novanta Inc.
- Limited scale but exposed to US-China tech tensions affecting photonics components.
Which company shows a better risk-adjusted profile?
Sanmina’s conservative capital structure and moderate volatility provide a more balanced risk profile. Novanta’s higher leverage and stock volatility increase downside risk. Sanmina’s low debt ratio and strong interest coverage reduce financial distress probability, while Novanta’s high P/E and debt raise valuation and solvency concerns. Recent data confirm Sanmina’s stable liquidity and Novanta’s elevated financial risk, making Sanmina the preferable risk-adjusted choice.
Final Verdict: Which stock to choose?
Sanmina Corporation’s superpower lies in its operational efficiency and strong balance sheet, delivering consistent cash flow with conservative leverage. Its point of vigilance is a slightly declining profitability trend, suggesting careful monitoring. It fits well within an Aggressive Growth portfolio seeking resilient cash-generating companies with room for operational improvement.
Novanta Inc. commands a strategic moat through its high-margin niche and strong R&D investments, fueling innovation and recurring revenue streams. Though it carries higher valuation and financial risk, it offers better stability relative to Sanmina’s cyclical exposure. Novanta suits a GARP (Growth at a Reasonable Price) portfolio focused on innovation-driven growth with moderate risk tolerance.
If you prioritize operational resilience and cash flow strength, Sanmina appears the compelling choice due to its efficiency and capital discipline. However, if you seek innovation leadership and growth potential with a tolerance for premium valuation, Novanta offers better stability and strategic positioning despite its higher risk profile. Both present analytical scenarios tailored to different investor profiles.
Disclaimer: Investment carries a risk of loss of initial capital. The past performance is not a reliable indicator of future results. Be sure to understand risks before making an investment decision.
Go Further
I encourage you to read the complete analyses of Sanmina Corporation and Novanta Inc. to enhance your investment decisions: