Home > Comparison > Technology > SNDK vs NOVT
The strategic rivalry between Sandisk Corporation and Novanta Inc. shapes the evolution of the technology sector. Sandisk, a market-leading hardware provider specializing in NAND flash storage solutions, contrasts with Novanta’s diversified photonics and precision motion components business serving medical and industrial markets. This analysis pits Sandisk’s scale and innovation against Novanta’s niche specialization to determine which corporate trajectory offers a superior risk-adjusted return for a diversified portfolio.
Table of contents
Companies Overview
Sandisk Corporation and Novanta Inc. stand as key players in the hardware and equipment sector with distinct technological niches.
Sandisk Corporation: Leader in Flash Storage Solutions
Sandisk dominates the NAND flash technology market, generating revenue primarily through solid state drives and removable storage devices. In 2026, it focuses on advancing high-performance storage solutions for enterprise and consumer markets, reinforcing its competitive edge in data storage innovation.
Novanta Inc.: Specialist in Photonics and Precision Motion
Novanta excels in designing and manufacturing photonics, vision, and precision motion components for medical and industrial OEMs. Its 2026 strategy targets expanding its photonics and vision segments, enhancing advanced laser and imaging technologies for critical applications like DNA sequencing and medical procedures.
Strategic Collision: Similarities & Divergences
Both companies operate in hardware but diverge sharply: Sandisk emphasizes data storage with a closed ecosystem approach, while Novanta pursues a broad component portfolio in an open, integrative model. Their market battle centers on innovation-driven technology leadership. Investment profiles differ: Sandisk offers scale and market dominance; Novanta presents focused niche expertise with diversified applications.
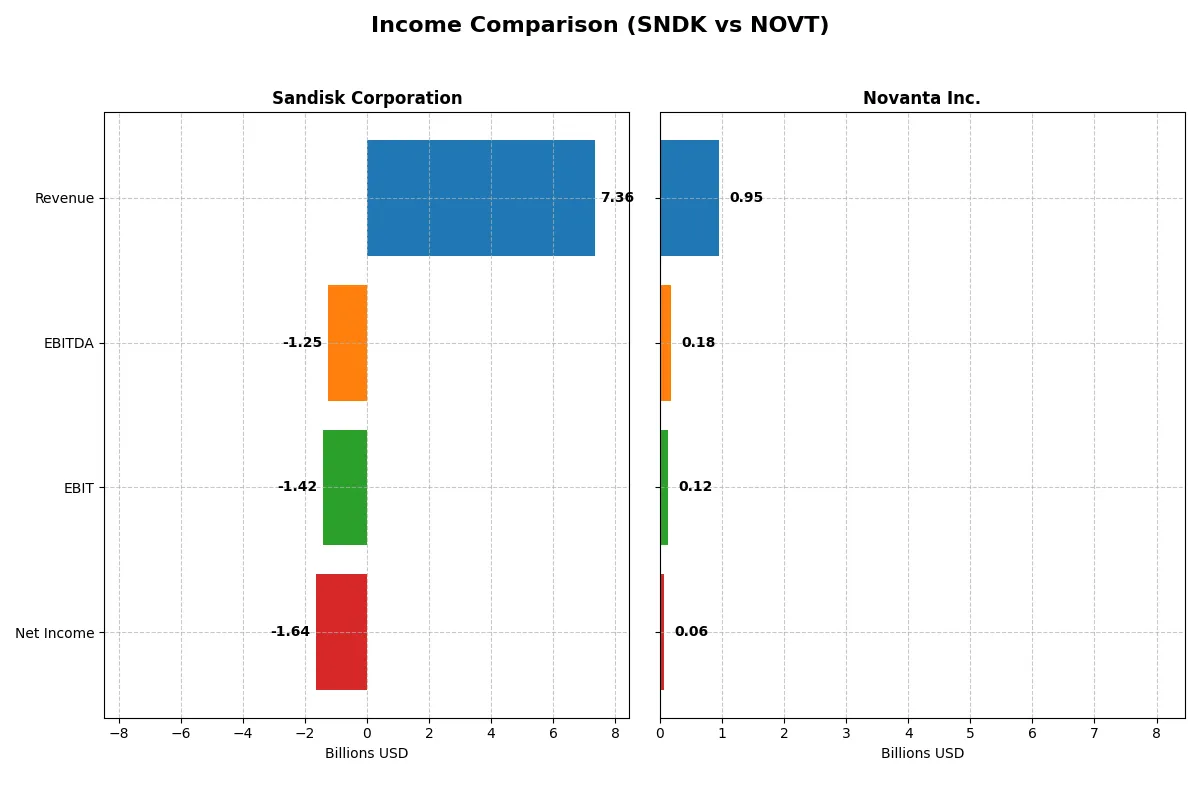
Income Statement Comparison
This data dissects the core profitability and scalability of both corporate engines to reveal who dominates the bottom line:
| Metric | Sandisk Corporation (SNDK) | Novanta Inc. (NOVT) |
|---|---|---|
| Revenue | 7.36B | 949M |
| Cost of Revenue | 5.14B | 528M |
| Operating Expenses | 3.59B | 311M |
| Gross Profit | 2.21B | 422M |
| EBITDA | -1.25B | 180M |
| EBIT | -1.42B | 124M |
| Interest Expense | 63M | 31M |
| Net Income | -1.64B | 64M |
| EPS | -11.32 | 1.78 |
| Fiscal Year | 2025 | 2024 |
Income Statement Analysis: The Bottom-Line Duel
This income statement comparison exposes which company operates with stronger efficiency and profitability over recent years.
Sandisk Corporation Analysis
Sandisk’s revenue rose 10.4% from 2024 to 2025, reaching $7.35B, but net income plunged deeper into a $1.64B loss. Gross margin recovered strongly to 30.1%, yet negative EBIT and net margins (-19.3% and -22.3%) reveal poor cost control and operational inefficiency in 2025. The ongoing losses mark a concerning momentum shift despite revenue growth.
Novanta Inc. Analysis
Novanta’s revenue grew moderately by 7.7% to $949M in 2024, with net income at $64M, showing stable profitability. The company maintains a solid gross margin of 44.4% and EBIT margin of 13.1%, reflecting healthy operational leverage. Although net margin declined slightly to 6.8%, Novanta sustains positive earnings and steady growth, underpinning its efficient cost management.
Margin Strength vs. Profitability Resilience
Novanta clearly outperforms Sandisk in margin health and profitability, posting consistent positive net income and expanding revenue. Sandisk’s severe net losses and negative EBIT margin undermine its efficiency despite recent revenue gains. For investors, Novanta’s profile offers superior fundamental stability and margin resilience compared to Sandisk’s ongoing turnaround challenges.
Financial Ratios Comparison
These vital ratios act as a diagnostic tool to expose the underlying fiscal health, valuation premiums, and capital efficiency of the companies compared below:
| Ratios | Sandisk Corporation (SNDK) | Novanta Inc. (NOVT) |
|---|---|---|
| ROE | -17.8% | 8.6% |
| ROIC | -11.9% | 7.3% |
| P/E | -4.2 | 85.7 |
| P/B | 0.74 | 7.37 |
| Current Ratio | 3.56 | 2.58 |
| Quick Ratio | 2.11 | 1.72 |
| D/E | 0.22 | 0.63 |
| Debt-to-Assets | 15.7% | 33.9% |
| Interest Coverage | -21.9 | 3.51 |
| Asset Turnover | 0.57 | 0.68 |
| Fixed Asset Turnover | 11.9 | 6.08 |
| Payout ratio | 0 | 0 |
| Dividend yield | 0 | 0 |
| Fiscal Year | 2025 | 2024 |
Efficiency & Valuation Duel: The Vital Signs
Financial ratios serve as a company’s DNA, uncovering hidden risks and revealing operational strengths critical to investment decisions.
Sandisk Corporation
Sandisk shows negative profitability with a -17.8% ROE and a -22.3% net margin, signaling operational distress. Its valuation metrics are attractive, with a low P/E of -4.17 and a P/B of 0.74, indicating undervaluation. The company pays no dividend, focusing resources on R&D, consuming 15.4% of revenue, to fuel future growth.
Novanta Inc.
Novanta posts moderate profitability, with 8.6% ROE and a 6.75% net margin, reflecting steady but unspectacular returns. The stock appears expensive, sporting a high P/E of 85.7 and a P/B of 7.37, suggesting market expectations are lofty. Novanta also forgoes dividends, reinvesting heavily in R&D at about 10% of revenue to sustain innovation.
Valuation Stretch vs. Operational Strain
Sandisk offers a value-oriented profile with weak profitability but cheap valuation, while Novanta trades at a premium with reasonable profitability. Investors seeking undervalued opportunities might prefer Sandisk’s deep discount, whereas those favoring operational stability and growth could lean toward Novanta’s growth-centric model.
Which one offers the Superior Shareholder Reward?
Sandisk Corporation (SNDK) pays no dividends and reports negative free cash flow in 2025, indicating weak internal funding for distributions. Novanta Inc. (NOVT) also pays no dividends but delivers consistent positive free cash flow around 3.9B and maintains robust operating cash flow coverage. Both firms rely on reinvestment over payouts; however, Novanta demonstrates a more sustainable capital allocation with moderate debt levels (debt-to-assets ~34%) and steady cash coverage ratios. Sandisk’s deteriorating margins and negative operating cash flow signal riskier fundamentals. I conclude Novanta offers a superior total shareholder return profile in 2026 due to its healthier cash flow generation and prudent reinvestment strategy.
Comparative Score Analysis: The Strategic Profile
The radar chart reveals the fundamental DNA and trade-offs of Sandisk Corporation and Novanta Inc., highlighting their core financial strengths and vulnerabilities:
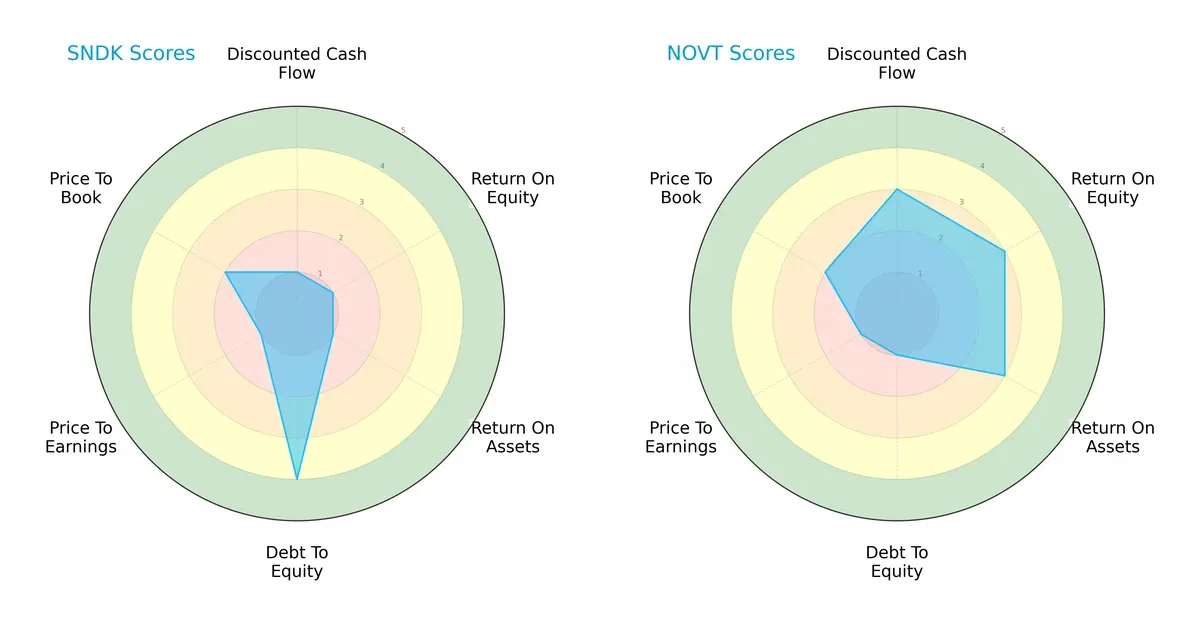
Sandisk shows a strong balance sheet with a favorable debt-to-equity score (4) but struggles on profitability and valuation metrics, scoring very unfavorable on DCF, ROE, ROA, and P/E. Novanta excels in profitability scores (ROE and ROA at 3) and a moderate DCF score (3), yet carries higher financial risk with a weak debt-to-equity score (1). Novanta relies on operational efficiency, while Sandisk leans on conservative leverage management. Overall, Novanta offers a more balanced profitability profile, whereas Sandisk’s strength lies in its capital structure stability.
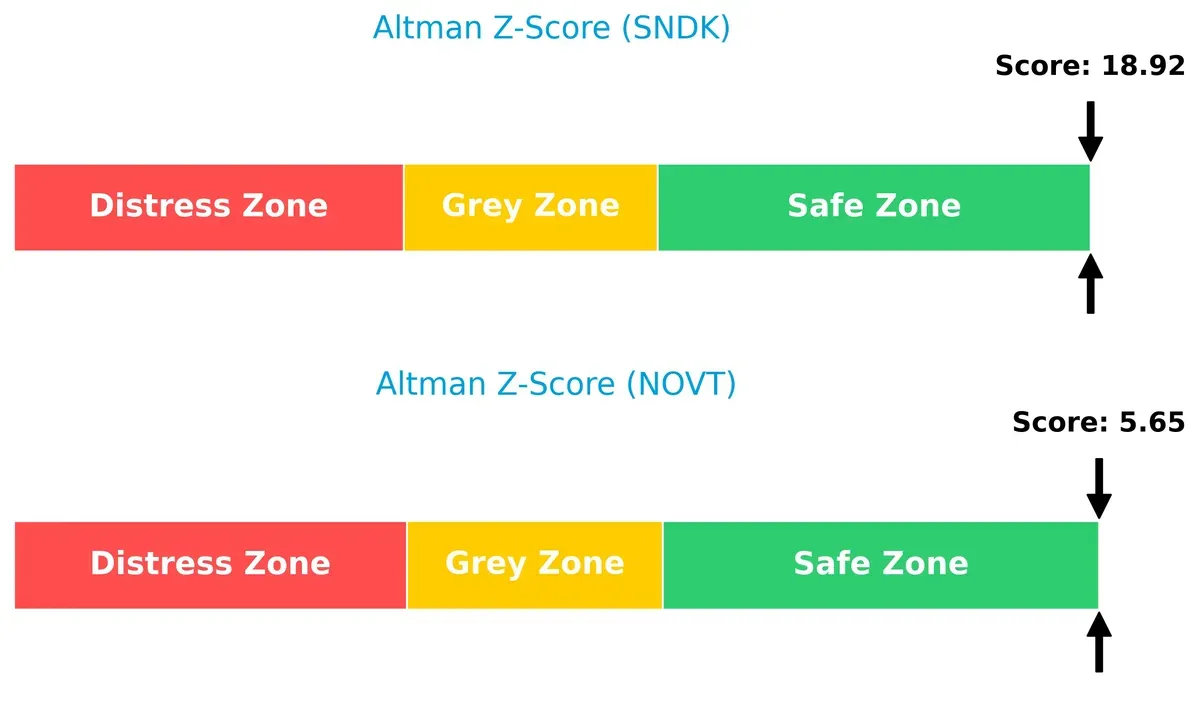
Bankruptcy Risk: Solvency Showdown
The Altman Z-Score gap shows both firms in the safe zone, but Sandisk’s extremely high score (18.9) versus Novanta’s modest 5.7 implies superior long-term solvency and resilience in this cycle:
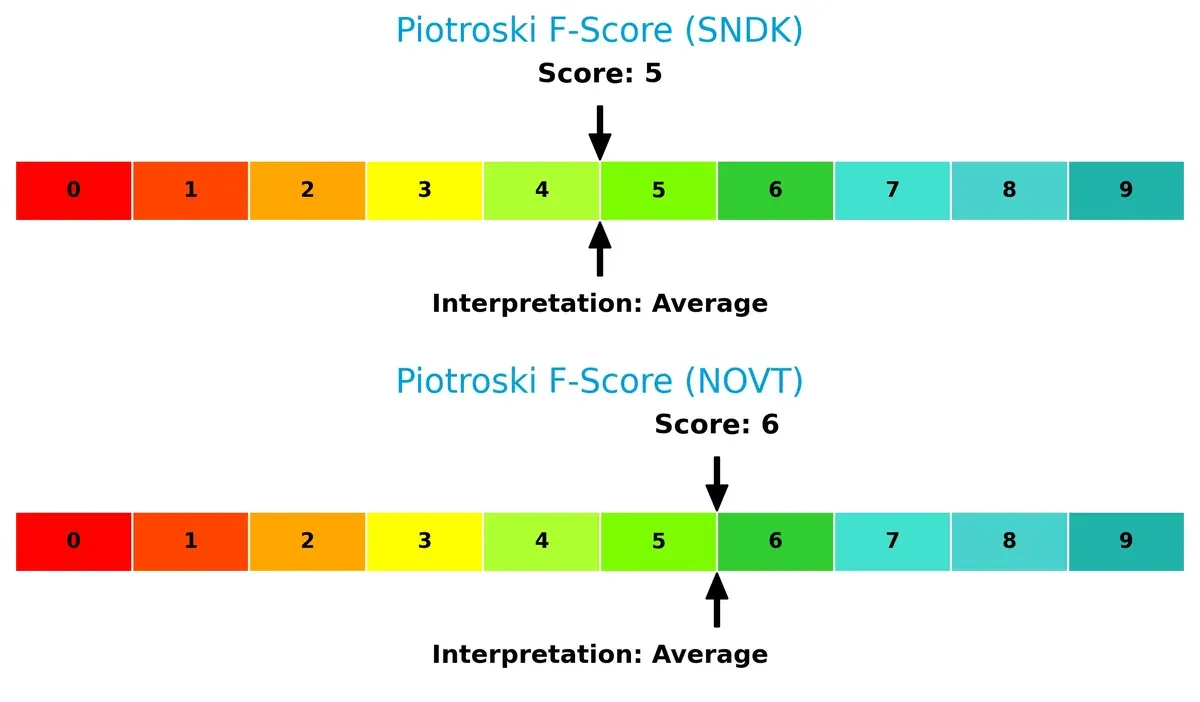
Financial Health: Quality of Operations
Both companies hold average Piotroski F-Scores, with Novanta slightly ahead at 6 versus Sandisk’s 5, indicating marginally better operational quality. Neither shows critical red flags, but Novanta’s internal metrics suggest slightly stronger financial health:
How are the two companies positioned?
This section dissects Sandisk and Novanta’s operational DNA by comparing revenue distribution and internal strengths and weaknesses. The goal is to confront their economic moats to reveal which model offers the most resilient competitive advantage today.
Revenue Segmentation: The Strategic Mix
This visual comparison dissects how Sandisk Corporation and Novanta Inc. diversify their income streams and where their primary sector bets lie:
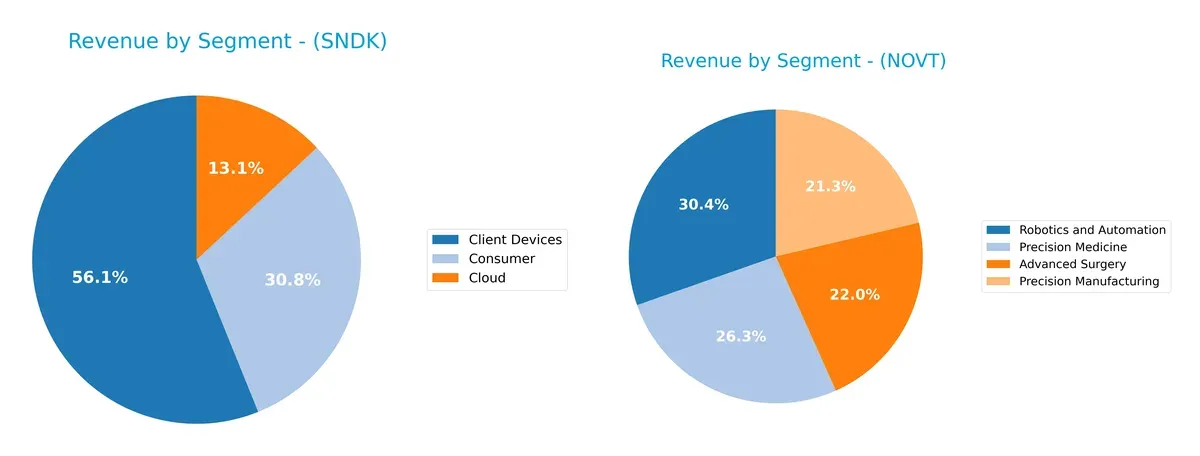
Sandisk’s revenue anchors heavily in Client Devices at $4.13B, dwarfing its Cloud ($960M) and Consumer ($2.27B) segments. Novanta shows a more balanced mix in 2024, with Robotics and Automation ($288M), Precision Medicine ($250M), and Advanced Surgery ($209M) all contributing significantly. Sandisk’s concentration signals strong ecosystem lock-in but heightens risk if device demand falters. Novanta’s diverse portfolio mitigates risk, leveraging precision tech across healthcare and manufacturing niches.
Strengths and Weaknesses Comparison
This table compares the strengths and weaknesses of Sandisk Corporation and Novanta Inc. based on key financial and market criteria:
Sandisk Corporation Strengths
- Strong diversification with significant revenue from Client Devices, Cloud, and Consumer segments
- Solid geographic presence including China, US, EMEA, and Asia
- Favorable fixed asset turnover indicating efficient use of fixed assets
- Low debt-to-equity and debt-to-assets ratios suggest conservative leverage
Novanta Inc. Strengths
- Diverse product segments in Precision Manufacturing, Robotics, Advanced Surgery, and Precision Medicine
- Balanced geographic presence with large US market and growing Europe and Asia exposure
- Favorable fixed asset turnover reflects asset efficiency
- Healthy liquidity ratios with strong current and quick ratios
Sandisk Corporation Weaknesses
- Negative profitability metrics: net margin, ROE, and ROIC all unfavorable
- High WACC at 26.01%, raising capital cost concerns
- Negative interest coverage ratio signals difficulty in covering interest expenses
- Slightly unfavorable global ratios with 50% unfavorable metrics
- No dividend yield limits income appeal
Novanta Inc. Weaknesses
- Modest profitability with neutral net margin and unfavorable ROE and WACC
- High valuation multiples with unfavorable PE and PB ratios
- Moderate leverage with debt-to-assets and debt-to-equity ratios neutral
- Dividend yield is zero, reducing income investor attraction
Sandisk shows broad diversification and strong asset efficiency but struggles with profitability and capital costs. Novanta maintains diverse product lines and solid liquidity yet faces valuation and profitability challenges. Both companies exhibit slightly unfavorable financial ratio profiles, which should inform cautious strategic planning.
The Moat Duel: Analyzing Competitive Defensibility
A structural moat is the only barrier protecting long-term profits from relentless competitive pressure in technology hardware firms:
Sandisk Corporation: Cost Advantage Moat
Sandisk’s moat stems from its manufacturing scale and NAND flash expertise, reflected in its sizable gross margin of 30%. However, declining ROIC signals weakening profitability in 2026, threatening this cost edge.
Novanta Inc.: Intangible Assets & Innovation Moat
Novanta leverages proprietary photonics and precision motion technologies, delivering a strong 44% gross margin and steadily improving ROIC. Unlike Sandisk, Novanta’s innovation pipeline supports expanding market presence and margin resilience.
Cost Leadership vs. Innovation-Driven Moats
Sandisk’s cost advantage is eroding amid shrinking returns, while Novanta’s growing ROIC highlights a deeper moat fueled by innovation. I see Novanta better positioned to defend and grow its market share through technological differentiation.
Which stock offers better returns?
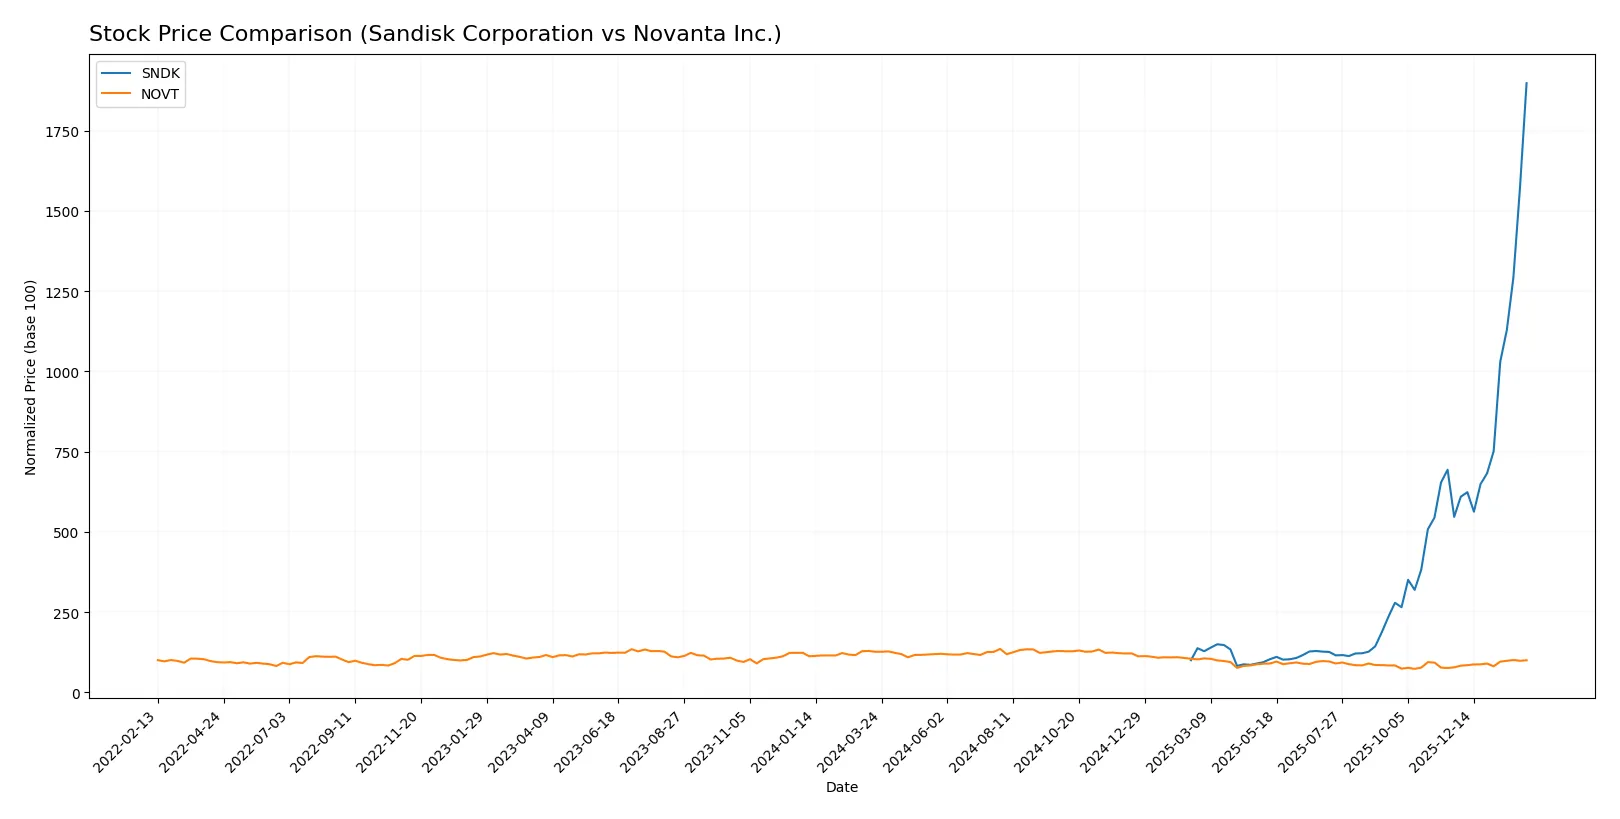
The past year showed stark contrasts: Sandisk surged with accelerating momentum, while Novanta faced a declining trend despite recent positive movement.
Trend Comparison
Sandisk’s stock soared 1797.71% over the past year, a clear bullish trend with accelerating gains and high volatility, peaking at 695.51 and bottoming at 30.11.
Novanta’s stock declined 21.05% over the same period, signaling a bearish trend despite recent 28.42% gains and accelerating recovery from a low of 99.96 to a high of 185.16.
Sandisk delivered substantially higher market performance, outpacing Novanta by a wide margin throughout the year.
Target Prices
Analysts present a solid target consensus for Sandisk Corporation and Novanta Inc., indicating varied upside potential.
| Company | Target Low | Target High | Consensus |
|---|---|---|---|
| Sandisk Corporation | 220 | 1000 | 675 |
| Novanta Inc. | 160 | 160 | 160 |
Sandisk’s target consensus of 675 sits just below its current price of 696, suggesting a cautious outlook despite a wide target range. Novanta’s target of 160 implies upside from its current 137, reflecting steady analyst confidence.

Don’t Let Luck Decide Your Entry Point
Optimize your entry points with our advanced ProRealTime indicators. You’ll get efficient buy signals with precise price targets for maximum performance. Start outperforming now!
How do institutions grade them?
Sandisk Corporation Grades
The following table summarizes recent grades from major financial institutions for Sandisk Corporation:
| Grading Company | Action | New Grade | Date |
|---|---|---|---|
| Barclays | Maintain | Equal Weight | 2026-02-02 |
| Citigroup | Maintain | Buy | 2026-02-02 |
| Jefferies | Maintain | Buy | 2026-01-30 |
| Wedbush | Maintain | Outperform | 2026-01-30 |
| RBC Capital | Maintain | Sector Perform | 2026-01-30 |
| Goldman Sachs | Maintain | Buy | 2026-01-30 |
| Morgan Stanley | Maintain | Overweight | 2026-01-30 |
| Cantor Fitzgerald | Maintain | Overweight | 2026-01-30 |
| Citigroup | Maintain | Buy | 2026-01-20 |
| Wells Fargo | Maintain | Equal Weight | 2026-01-15 |
Novanta Inc. Grades
The following table summarizes recent grades from major financial institutions for Novanta Inc.:
| Grading Company | Action | New Grade | Date |
|---|---|---|---|
| Baird | Maintain | Neutral | 2025-08-11 |
| Baird | Maintain | Neutral | 2025-03-03 |
| Baird | Maintain | Neutral | 2024-11-06 |
| Baird | Maintain | Neutral | 2024-08-07 |
| Baird | Maintain | Neutral | 2023-05-11 |
| Baird | Maintain | Neutral | 2023-05-10 |
| William Blair | Upgrade | Outperform | 2022-05-11 |
| William Blair | Upgrade | Outperform | 2022-05-10 |
| Berenberg | Maintain | Hold | 2020-11-13 |
| Baird | Maintain | Neutral | 2020-05-13 |
Which company has the best grades?
Sandisk Corporation consistently receives stronger grades including multiple “Buy,” “Outperform,” and “Overweight” ratings. Novanta’s ratings cluster around “Neutral” and occasional “Outperform,” but mostly remain moderate. This suggests Sandisk holds more bullish institutional sentiment, potentially attracting more investor interest.
Risks specific to each company
The following categories identify critical pressure points and systemic threats facing both firms in the 2026 market environment:
1. Market & Competition
Sandisk Corporation
- Faces intense competition in NAND flash storage, pressured by rapid tech evolution and commoditization.
Novanta Inc.
- Competes in specialized photonics and precision motion markets, facing niche but innovative rivals.
2. Capital Structure & Debt
Sandisk Corporation
- Low debt-to-equity ratio (0.22) signals conservative leverage and financial stability.
Novanta Inc.
- Higher debt-to-equity (0.63) increases financial risk and pressure on cash flows.
3. Stock Volatility
Sandisk Corporation
- Extremely high beta (4.8) indicates high stock price volatility and market sensitivity.
Novanta Inc.
- Moderate beta (1.62) suggests more stable share price fluctuations.
4. Regulatory & Legal
Sandisk Corporation
- Subject to global tech regulations impacting semiconductor manufacturing.
Novanta Inc.
- Faces regulatory scrutiny on medical device components and industrial tech compliance.
5. Supply Chain & Operations
Sandisk Corporation
- Dependent on complex semiconductor supply chains vulnerable to geopolitical disruptions.
Novanta Inc.
- Relies on diversified suppliers for photonics and precision parts, somewhat insulated operationally.
6. ESG & Climate Transition
Sandisk Corporation
- Under pressure to reduce carbon footprint in manufacturing processes.
Novanta Inc.
- Faces challenges integrating sustainability in advanced materials and energy usage.
7. Geopolitical Exposure
Sandisk Corporation
- High exposure to US-China trade tensions affecting semiconductor exports.
Novanta Inc.
- Moderate exposure with diversified global footprint in medical and industrial markets.
Which company shows a better risk-adjusted profile?
Sandisk’s most impactful risk is its extreme stock volatility, reflecting market uncertainty and tech cycle vulnerability. Novanta’s primary risk lies in its heavier debt load, raising financial leverage concerns. Despite Sandisk’s volatility, its strong balance sheet and safer leverage give it a marginally better risk-adjusted profile. Novanta’s moderate stock volatility is outweighed by its higher leverage and valuation risks, signaling caution. Recent data reveal Sandisk’s beta at 4.8 versus Novanta’s 1.6, underscoring Sandisk’s market sensitivity but stronger capital structure.
Final Verdict: Which stock to choose?
Sandisk Corporation’s superpower lies in its robust liquidity and efficient asset turnover despite recent profitability struggles. The steep decline in returns on capital signals a point of vigilance. It might suit investors focused on turnaround potential and aggressive growth in cyclical markets.
Novanta Inc. benefits from a clear strategic moat in specialized technology with steady revenue streams. Its improving profitability and solid liquidity offer a safer profile compared to Sandisk. It appears better aligned with a GARP (Growth at a Reasonable Price) approach, balancing growth with moderate risk.
If you prioritize aggressive growth and can tolerate operational setbacks, Sandisk might be compelling due to its potential rebound and liquidity cushion. However, if you seek stability with steady profitability, Novanta offers better stability and a more consistent growth trajectory, though at a premium valuation.
Disclaimer: Investment carries a risk of loss of initial capital. The past performance is not a reliable indicator of future results. Be sure to understand risks before making an investment decision.
Go Further
I encourage you to read the complete analyses of Sandisk Corporation and Novanta Inc. to enhance your investment decisions: