Novanta Inc. and Mesa Laboratories, Inc. are two prominent players in the hardware, equipment, and parts industry, each specializing in advanced technologies for medical and industrial markets. Novanta focuses on photonics and precision motion solutions, while Mesa Laboratories excels in life sciences tools and quality control products. This comparison highlights their innovation strategies and market reach, helping you identify which company presents the most compelling investment opportunity in 2026.
Table of contents
Companies Overview
I will begin the comparison between Novanta Inc. and Mesa Laboratories, Inc. by providing an overview of these two companies and their main differences.
Novanta Inc. Overview
Novanta Inc. designs, manufactures, and markets photonics, vision, and precision motion components and sub-systems for medical and industrial markets globally. Its products serve applications in laser processing, medical imaging, and robotic motion control. Headquartered in Bedford, Massachusetts, Novanta operates through multiple brands and focuses on delivering advanced technology solutions to original equipment manufacturers.
Mesa Laboratories, Inc. Overview
Mesa Laboratories, Inc. develops and sells life sciences tools and quality control products, including sterilization indicators, protein analysis systems, and genetic testing tools. Serving healthcare, pharmaceutical, and laboratory markets, Mesa has a diversified portfolio of calibration and clinical genomics products. The company is based in Lakewood, Colorado, and emphasizes innovation in measurement and quality assurance technologies.
Key similarities and differences
Both companies operate in the hardware and equipment sector with a focus on technology for healthcare and industrial applications. Novanta emphasizes photonics and precision motion technologies, while Mesa specializes in life sciences tools and quality control products. Novanta’s business model targets original equipment manufacturers globally, whereas Mesa provides specialized testing and calibration solutions across healthcare and biopharmaceutical industries.
Income Statement Comparison
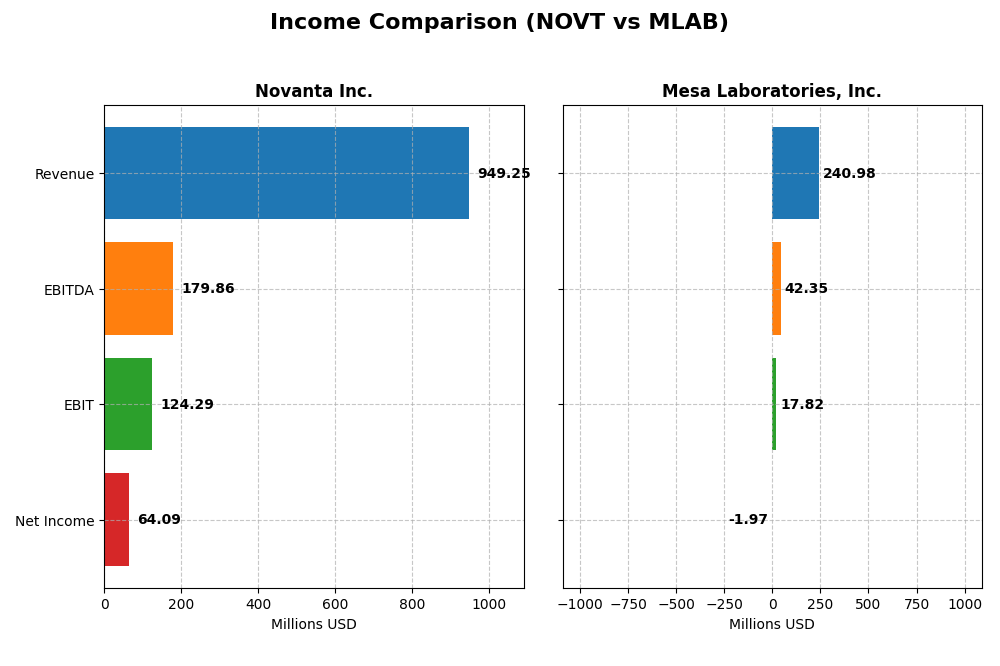
The following table presents a side-by-side comparison of key income statement metrics for Novanta Inc. and Mesa Laboratories, Inc. based on their most recent fiscal year reports.
| Metric | Novanta Inc. (NOVT) | Mesa Laboratories, Inc. (MLAB) |
|---|---|---|
| Market Cap | 4.0B | 439M |
| Revenue | 949M | 241M |
| EBITDA | 180M | 42M |
| EBIT | 124M | 18M |
| Net Income | 64M | -2M |
| EPS | 1.78 | -0.36 |
| Fiscal Year | 2024 | 2025 |
Income Statement Interpretations
Novanta Inc.
Novanta Inc. demonstrated steady revenue growth from 2020 to 2024, reaching $949M in 2024, with net income rising by 44% over the period to $64M. Margins showed relative stability; gross margin remained favorable at 44.4%, and EBIT margin was 13.1%. However, net margin declined slightly in 2024, reflecting a slowdown in net income growth despite a 7.7% revenue increase.
Mesa Laboratories, Inc.
Mesa Laboratories reported increasing revenue from $134M in 2021 to $241M in 2025, an overall growth of nearly 80%. Its gross margin was strong at 62.6%, though EBIT margin was moderate at 7.4%. Notably, the company posted a net loss of $2M in 2025, reversing prior small profits, indicating margin pressure despite recent improvements in revenue and EBIT growth.
Which one has the stronger fundamentals?
Both companies show favorable income statement trends, with Novanta maintaining positive net income and stable margins, while Mesa boasts higher gross margins but faces net losses recently. Novanta’s consistent profitability and manageable interest expenses contrast with Mesa’s volatile net income and declining net margins, suggesting more stable fundamentals for Novanta based on the latest financial data.
Financial Ratios Comparison
The table below presents the most recent key financial ratios for Novanta Inc. (NOVT) and Mesa Laboratories, Inc. (MLAB), reflecting their fiscal year 2024 and 2025 performances respectively.
| Ratios | Novanta Inc. (2024) | Mesa Laboratories, Inc. (2025) |
|---|---|---|
| ROE | 8.59% | -1.24% |
| ROIC | 7.19% | -1.45% |
| P/E | 85.7 | -326.3 |
| P/B | 7.37 | 4.03 |
| Current Ratio | 2.58 | 0.63 |
| Quick Ratio | 1.72 | 0.47 |
| D/E (Debt-to-Equity) | 0.63 | 1.14 |
| Debt-to-Assets | 33.9% | 41.9% |
| Interest Coverage | 3.51 | 1.38 |
| Asset Turnover | 0.68 | 0.56 |
| Fixed Asset Turnover | 6.08 | 7.45 |
| Payout Ratio | 0 | -175.7% |
| Dividend Yield | 0% | 0.54% |
Interpretation of the Ratios
Novanta Inc.
Novanta Inc. shows a mixed ratio profile with favorable liquidity ratios (current ratio 2.58, quick ratio 1.72) and a strong fixed asset turnover (6.08), indicating operational efficiency. However, profitability and valuation metrics such as ROE (8.59%), WACC (10.7%), PE (85.7), and PB (7.37) are unfavorable, suggesting valuation concerns and moderate returns. The company does not pay dividends, consistent with a possible reinvestment or growth strategy.
Mesa Laboratories, Inc.
Mesa Laboratories displays predominantly unfavorable financial ratios, including negative net margin (-0.82%), ROE (-1.24%), ROIC (-1.45%), low liquidity (current ratio 0.63, quick ratio 0.47), and high leverage (debt/equity 1.14). Despite a favorable WACC (6.57%) and fixed asset turnover (7.45), the overall financial health is weak. The company pays a small dividend yielding 0.54%, but this may be strained given the negative profitability and coverage ratios.
Which one has the best ratios?
Novanta Inc. presents a slightly unfavorable overall ratio profile but maintains better liquidity and operational efficiency compared to Mesa Laboratories. Mesa’s ratios indicate more significant financial stress with negative profitability and weak liquidity. Therefore, Novanta’s ratios are relatively stronger, despite some valuation and return concerns, while Mesa’s ratios suggest greater risk.
Strategic Positioning
This section compares the strategic positioning of Novanta Inc. and Mesa Laboratories, Inc., focusing on Market position, Key segments, and Exposure to technological disruption:
Novanta Inc.
- Market position and competitive pressure: Market cap 4B, operating in photonics and precision hardware with 3K employees, faces competitive pressure in tech hardware.
- Key segments and business drivers: Diverse segments including photonics, vision, precision motion, robotics, and advanced surgery driving revenues.
- Exposure to technological disruption: Operates in high-tech photonics and medical tech, requiring continuous innovation to maintain positioning.
Mesa Laboratories, Inc.
- Market cap 439M, smaller with 736 employees, focused on life sciences tools and quality control products globally.
- Concentrated in sterilization control, biopharmaceutical development, calibration, and clinical genomics segments.
- Focused on specialized life sciences and calibration technologies, facing moderate technological changes.
Novanta Inc. vs Mesa Laboratories, Inc. Positioning
Novanta follows a diversified approach across multiple advanced technology segments, offering broader market exposure but higher complexity. Mesa Labs concentrates on niche life sciences tools, enabling focused expertise but limiting diversification benefits.
Which has the best competitive advantage?
Both companies are shedding value, but Novanta shows growing profitability (slightly unfavorable), while Mesa Labs’ profitability declines (very unfavorable), indicating Novanta currently holds a comparatively stronger competitive advantage.
Stock Comparison
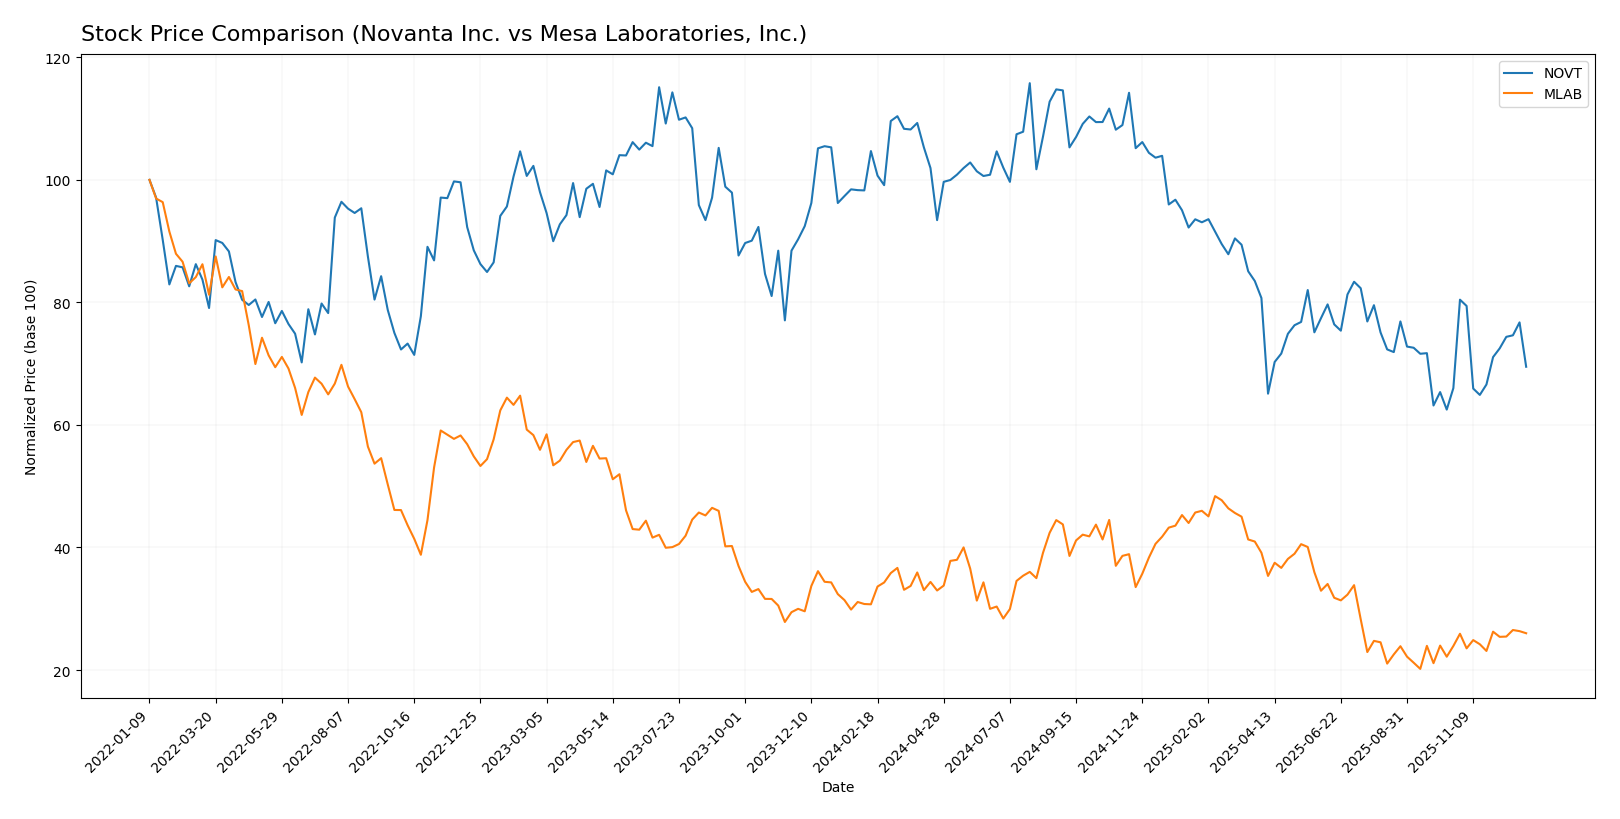
The stock price movements of Novanta Inc. (NOVT) and Mesa Laboratories, Inc. (MLAB) over the past 12 months reveal notable bearish trends with accelerating declines, followed by recent positive momentum in the last quarter.
Trend Analysis
Novanta Inc. experienced a -33.62% price decline over the past year, indicating a bearish trend with accelerating downward momentum; volatility was significant, with a standard deviation of 25.12. However, recent weeks show a 5.29% recovery, signaling a moderate upward slope.
Mesa Laboratories, Inc. also showed a bearish trend with a -15.36% price change over 12 months and accelerating decline, accompanied by a 23.08 standard deviation. Recently, MLAB’s stock gained 8.69%, reflecting a stronger short-term rebound compared to NOVT.
Comparing these trends, MLAB delivered higher market performance over the past year, with a smaller overall loss and a more pronounced recent uptrend than NOVT.
Target Prices
The consensus target prices from verified analysts suggest clear upside potential for both Novanta Inc. and Mesa Laboratories, Inc.
| Company | Target High | Target Low | Consensus |
|---|---|---|---|
| Novanta Inc. | 160 | 160 | 160 |
| Mesa Laboratories, Inc. | 83 | 83 | 83 |
Analysts expect Novanta’s stock to rise significantly from its current price of 111.14 to 160, while Mesa Laboratories shows a moderate increase from 79.43 to 83. This indicates optimism for growth in both equities.
Analyst Opinions Comparison
This section compares analysts’ ratings and grades for Novanta Inc. and Mesa Laboratories, Inc.:
Rating Comparison
Novanta Inc. Rating
- Rating: C+, rated Very Favorable overall.
- Discounted Cash Flow Score: Moderate at 3, indicating fair valuation.
- ROE Score: Moderate at 3, reflecting decent profit generation from equity.
- ROA Score: Moderate at 3, showing effective asset utilization.
- Debt To Equity Score: Very Unfavorable at 1, indicating higher financial risk.
- Overall Score: Moderate at 2, summarizing average financial standing.
Mesa Laboratories, Inc. Rating
- Rating: C+, rated Very Favorable overall.
- Discounted Cash Flow Score: Very Favorable at 5, showing strong future cash flow potential.
- ROE Score: Very Unfavorable at 1, indicating weak equity profit efficiency.
- ROA Score: Very Unfavorable at 1, suggesting poor earnings from assets.
- Debt To Equity Score: Very Unfavorable at 1, reflecting similar financial risk concerns.
- Overall Score: Moderate at 2, reflecting a comparable overall financial position.
Which one is the best rated?
Both Novanta Inc. and Mesa Laboratories, Inc. share the same overall rating of C+ and an overall score of 2. Mesa Labs scores higher on discounted cash flow but trails significantly on ROE and ROA, while Novanta displays more balanced scores across these metrics.
Scores Comparison
Here is a comparison of the Altman Z-Score and Piotroski Score for Novanta Inc. and Mesa Laboratories, Inc.:
Novanta Inc. Scores
- Altman Z-Score: 5.35, indicating a safe zone from distress
- Piotroski Score: 6, reflecting average financial strength
Mesa Laboratories, Inc. Scores
- Altman Z-Score: 0.92, indicating financial distress
- Piotroski Score: 4, reflecting average financial strength
Which company has the best scores?
Novanta Inc. shows a significantly higher Altman Z-Score, placing it in the safe zone, while Mesa Laboratories is in financial distress. Both companies have average Piotroski Scores, but Novanta’s stronger Z-Score suggests better financial stability.
Grades Comparison
Here is a comparison of the recent grades assigned to Novanta Inc. and Mesa Laboratories, Inc.:
Novanta Inc. Grades
The following table summarizes the recent grades from recognized grading companies for Novanta Inc.:
| Grading Company | Action | New Grade | Date |
|---|---|---|---|
| Baird | Maintain | Neutral | 2025-08-11 |
| Baird | Maintain | Neutral | 2025-03-03 |
| Baird | Maintain | Neutral | 2024-11-06 |
| Baird | Maintain | Neutral | 2024-08-07 |
| Baird | Maintain | Neutral | 2023-05-11 |
| Baird | Maintain | Neutral | 2023-05-10 |
| William Blair | Upgrade | Outperform | 2022-05-11 |
| William Blair | Upgrade | Outperform | 2022-05-10 |
| Berenberg | Maintain | Hold | 2020-11-13 |
| Baird | Maintain | Neutral | 2020-05-13 |
Overall, Novanta Inc. has consistently received neutral or hold ratings, with a notable upgrade to outperform by William Blair in 2022.
Mesa Laboratories, Inc. Grades
The following table presents recent grades from recognized grading companies for Mesa Laboratories, Inc.:
| Grading Company | Action | New Grade | Date |
|---|---|---|---|
| Wells Fargo | Maintain | Equal Weight | 2025-12-15 |
| Wells Fargo | Upgrade | Equal Weight | 2025-08-08 |
| Wells Fargo | Maintain | Underweight | 2025-05-30 |
| Evercore ISI Group | Maintain | Outperform | 2024-10-01 |
| Evercore ISI Group | Maintain | Outperform | 2024-08-06 |
| Evercore ISI Group | Maintain | Outperform | 2024-07-02 |
| Evercore ISI Group | Maintain | Outperform | 2024-04-04 |
| Evercore ISI Group | Upgrade | Outperform | 2024-01-04 |
| Evercore ISI Group | Downgrade | In Line | 2021-01-04 |
| Evercore ISI Group | Downgrade | In Line | 2021-01-03 |
Mesa Laboratories, Inc. shows a recent trend of mostly outperform and equal weight ratings, with some upgrades and downgrades over the years.
Which company has the best grades?
Mesa Laboratories, Inc. has received generally stronger grades than Novanta Inc., with multiple recent outperform ratings versus Novanta’s predominantly neutral ratings. This suggests a more favorable analyst outlook for Mesa Laboratories, potentially influencing investor sentiment toward growth prospects.
Strengths and Weaknesses
Below is a comparison table summarizing the key strengths and weaknesses of Novanta Inc. (NOVT) and Mesa Laboratories, Inc. (MLAB) based on their recent financial and operational data.
| Criterion | Novanta Inc. (NOVT) | Mesa Laboratories, Inc. (MLAB) |
|---|---|---|
| Diversification | High: Diverse segments including Precision Manufacturing, Robotics, Advanced Surgery, and Precision Medicine totaling over 950M USD in 2024 | Moderate: Product-focused with Service segment; 241M USD total revenue in 2025 |
| Profitability | Slightly unfavorable: ROIC below WACC (-3.5%) but improving trend; net margin 6.75% (neutral) | Very unfavorable: ROIC well below WACC (-8.0%) with declining trend; negative net margin (-0.82%) |
| Innovation | Strong: Growing ROIC indicates improving efficiency and potential innovation | Weak: Declining ROIC and profitability suggest challenges in innovation and operational efficiency |
| Global presence | Solid: Broad product portfolio suggesting global industrial and medical market exposure | Limited: Focused product and service offerings imply narrower market reach |
| Market Share | Moderate to strong in niche precision and medical tech markets | Niche player with stable but limited market share in biopharmaceutical and calibration sectors |
Key takeaways: Novanta shows a diversified portfolio with improving profitability despite current value destruction, suggesting potential for future growth. Mesa Laboratories faces profitability challenges and declining efficiency, indicating higher investment risk at present.
Risk Analysis
Below is a table summarizing key risk factors for Novanta Inc. (NOVT) and Mesa Laboratories, Inc. (MLAB) based on their most recent financial and market data.
| Metric | Novanta Inc. (NOVT) | Mesa Laboratories, Inc. (MLAB) |
|---|---|---|
| Market Risk | High beta (1.595) indicates higher volatility and sensitivity to market swings. | Moderate beta (0.9) suggests less volatility relative to the market. |
| Debt level | Moderate debt-to-assets at 33.92%, debt-to-equity neutral at 0.63. | Higher debt concerns with debt-to-assets 41.88% and debt-to-equity unfavorable at 1.14. |
| Regulatory Risk | Moderate, given medical and industrial sectors with complex compliance needs. | Moderate, due to healthcare and biopharma focus with strict regulatory environment. |
| Operational Risk | Diverse product lines mitigate risk but complexity may increase operational challenges. | Concentrated in life sciences tools, risk from technological obsolescence or production issues. |
| Environmental Risk | Moderate, industrial manufacturing may pose environmental compliance challenges. | Moderate, focus on life sciences and calibration products with some environmental impact. |
| Geopolitical Risk | Low to moderate, US-based with global sales but no major geopolitical exposure noted. | Low to moderate, similar US base and international market presence, exposure limited. |
In synthesis, Novanta faces significant market risk due to high volatility, with moderate leverage and operational complexity posing manageable risks. Mesa Laboratories’ biggest risks lie in elevated debt levels and weak profitability metrics, alongside operational concentration, suggesting higher financial vulnerability and risk of distress. Recent scores place Novanta in a safer financial zone, while Mesa Labs is in distress territory, highlighting the importance of cautious risk management for MLAB investors.
Which Stock to Choose?
Novanta Inc. (NOVT) shows a favorable income statement with 64% positive metrics, moderate revenue growth of 7.7% in 2024, but a slightly unfavorable global ratio profile with 36% unfavorable ratios. Its profitability is moderate, debt levels are neutral, and it has a very favorable C+ rating with strong financial stability indicated by a safe Altman Z-Score of 5.35 and average Piotroski score of 6. Its ROIC remains below WACC, signaling value destruction despite improving profitability.
Mesa Laboratories, Inc. (MLAB) also has a favorable income statement overall, with 64% favorable metrics and stronger recent revenue growth of 11.5%, but faces more challenges with 64% unfavorable financial ratios. Profitability is negative, debt and liquidity ratios are weak, and it holds a very favorable C+ rating despite distress-level Altman Z-Score of 0.92 and average Piotroski score of 4. Its ROIC is well below WACC with a declining trend, indicating sustained value destruction.
For investors, the choice might depend on risk tolerance and investment strategy. Those focused on companies with improving profitability and financial stability might view Novanta as more favorable, while investors willing to accept higher risk for potential turnaround scenarios might find Mesa Laboratories’ recent growth signals appealing, despite its financial challenges.
Disclaimer: Investment carries a risk of loss of initial capital. The past performance is not a reliable indicator of future results. Be sure to understand risks before making an investment decision.
Go Further
I encourage you to read the complete analyses of Novanta Inc. and Mesa Laboratories, Inc. to enhance your investment decisions: