Home > Comparison > Technology > TXN vs NVMI
The strategic rivalry between Texas Instruments Incorporated and Nova Ltd. shapes the semiconductor industry’s evolution. Texas Instruments operates as a diversified semiconductor giant with a broad analog and embedded processing portfolio. In contrast, Nova Ltd. focuses narrowly on advanced process control systems for semiconductor manufacturing. This analysis pits a capital-intensive sector leader against a specialized innovator, aiming to identify which trajectory delivers superior risk-adjusted returns for a diversified portfolio.
Table of contents
Companies Overview
Texas Instruments and Nova Ltd. both play pivotal roles in the semiconductor industry, shaping technology’s backbone globally.
Texas Instruments Incorporated: Analog and Embedded Processing Leader
Texas Instruments dominates as a semiconductor giant with a market cap of 203B. It generates revenue primarily through its Analog and Embedded Processing segments, offering power management and microcontroller products. In 2026, TI’s strategic focus remains on expanding industrial and automotive applications, leveraging its broad product portfolio to sustain its competitive advantage.
Nova Ltd.: Precision Metrology Specialist
Nova Ltd. stands out as a specialist in semiconductor process control systems, with a market cap of 12.4B. It develops advanced metrology platforms critical for manufacturing integrated circuits. The company’s 2026 strategy targets innovation in lithography and etch process control, aiming to deepen its footprint among logic, foundry, and memory manufacturers worldwide.
Strategic Collision: Similarities & Divergences
While Texas Instruments pursues a broad semiconductor product range with a focus on analog and embedded systems, Nova zeroes in on niche metrology technology. Their rivalry centers on semiconductor manufacturing precision versus component supply. TI’s scale contrasts with Nova’s specialized innovation, defining their distinct investment profiles in this dynamic sector.
Income Statement Comparison
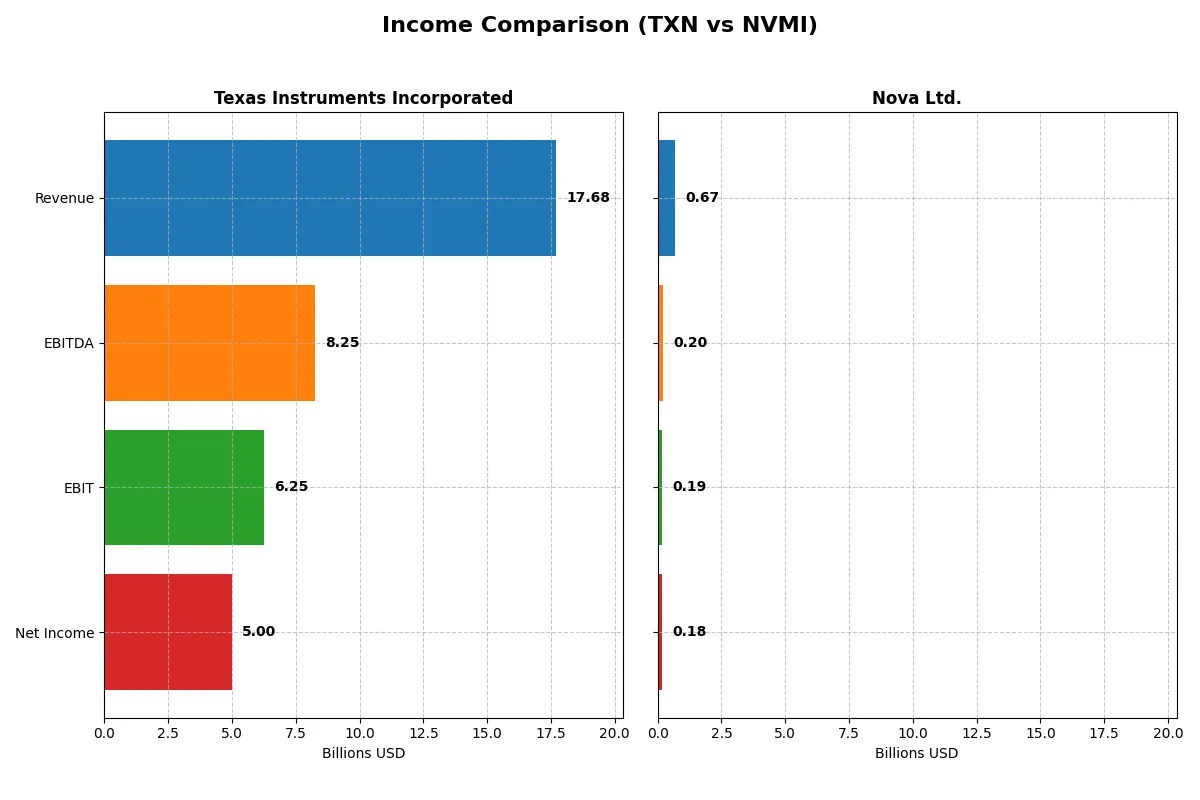
This data dissects the core profitability and scalability of both corporate engines to reveal who dominates the bottom line:
| Metric | Texas Instruments Incorporated (TXN) | Nova Ltd. (NVMI) |
|---|---|---|
| Revenue | 17.7B | 672M |
| Cost of Revenue | 7.6B | 285M |
| Operating Expenses | 4.1B | 200M |
| Gross Profit | 10.1B | 387M |
| EBITDA | 8.3B | 205M |
| EBIT | 6.3B | 188M |
| Interest Expense | 543M | 1.6M |
| Net Income | 5.0B | 184.9M |
| EPS | 5.45 | 6.31 |
| Fiscal Year | 2025 | 2024 |
Income Statement Analysis: The Bottom-Line Duel
This income statement comparison exposes the true efficiency and growth dynamics powering each company’s financial engine.
Texas Instruments Incorporated Analysis
Texas Instruments’ revenue dipped slightly over five years but rebounded 13% in 2025 to $17.7B. Net income fell 35% overall, yet recovered modestly last year to $5B. Margins remain strong, with a robust 57% gross margin and 28% net margin in 2025, signaling solid profitability despite top-line fluctuations. Efficiency gains slowed as EBIT growth stayed flat, but EPS climbed 4.8%.
Nova Ltd. Analysis
Nova Ltd. posted rapid revenue growth, surging nearly 30% in 2024 to $672M and expanding 150% since 2020. Net income exploded 284% over five years, hitting $184M in 2024. The company commands healthy margins, with a consistent 57.6% gross margin and 27.3% net margin last year. Nova accelerated EBIT growth by 20%, reflecting strong operational momentum and margin expansion.
Growth Momentum vs. Scale and Stability
Nova Ltd. clearly outpaces Texas Instruments in revenue and net income growth, driven by aggressive expansion and margin improvement. Texas Instruments, however, offers scale and consistent high margins but struggles with declining net income and slower EBIT growth. For investors, Nova’s growth profile appeals for momentum plays, while Texas Instruments suits those favoring established profitability with moderate growth.
Financial Ratios Comparison
These vital ratios act as a diagnostic tool to expose the underlying fiscal health, valuation premiums, and capital efficiency of the companies compared below:
| Ratios | Texas Instruments Incorporated (TXN) | Nova Ltd. (NVMI) |
|---|---|---|
| ROE | 30.7% | 19.8% |
| ROIC | 16.5% | 13.4% |
| P/E | 31.5 | 31.2 |
| P/B | 9.69 | 6.18 |
| Current Ratio | 4.35 | 2.32 |
| Quick Ratio | 2.83 | 1.92 |
| D/E | 0.86 | 0.25 |
| Debt-to-Assets | 40.6% | 17.0% |
| Interest Coverage | 11.1 | 116.2 |
| Asset Turnover | 0.51 | 0.48 |
| Fixed Asset Turnover | 1.44 | 5.06 |
| Payout ratio | 100.0% | 0.0% |
| Dividend yield | 3.17% | 0.00% |
| Fiscal Year | 2025 | 2024 |
Efficiency & Valuation Duel: The Vital Signs
Ratios act as the company’s DNA, revealing hidden risks and operational excellence that guide investors through complex financial landscapes.
Texas Instruments Incorporated
Texas Instruments (TXN) demonstrates strong profitability with a 30.7% ROE and a healthy 28.3% net margin, reflecting operational efficiency. However, its valuation appears stretched, with a P/E of 31.5 and a P/B of 9.7, signaling a premium price. TXN rewards shareholders with a 3.2% dividend yield, balancing growth and income.
Nova Ltd.
Nova Ltd. (NVMI) posts solid profitability, with a 19.8% ROE and a 27.3% net margin, though below TXN’s levels. Its valuation is similarly elevated at a P/E of 31.2 but with a lower P/B of 6.2. NVMI does not pay dividends, instead reinvesting heavily in R&D to fuel growth, supported by a favorable liquidity position.
Premium Valuation vs. Operational Safety
TXN offers higher profitability and shareholder returns but at a stretched valuation and weaker liquidity. NVMI shows a more conservative balance sheet and reinvests in growth but with lower returns. Investors seeking income may prefer TXN, while those favoring growth and financial prudence might lean towards NVMI.
Which one offers the Superior Shareholder Reward?
I compare Texas Instruments (TXN) and Nova Ltd. (NVMI) on distribution philosophies and shareholder returns. TXN pays a steady dividend with a 3.17% yield and a near 100% payout ratio, supported by strong free cash flow of 2.86B in 2025. Its buyback program is modest but consistent, reinforcing shareholder value. NVMI pays no dividend but delivers higher free cash flow per share (7.49) and aggressively reinvests in growth, reflected by a low capex per share (0.59) versus TXN’s 5B. NVMI’s buybacks appear limited but it maintains robust cash reserves (20.1/share). TXN’s dividend is sustainable given its coverage ratio (~0.75), but its high payout may constrain growth. NVMI’s reinvestment strategy suggests a longer runway for capital appreciation but less immediate income. For 2026, TXN offers superior total return for income-focused investors, while NVMI suits growth seekers willing to forgo dividends. I favor TXN for balanced shareholder reward and sustainability.
Comparative Score Analysis: The Strategic Profile
The radar chart reveals the fundamental DNA and trade-offs of Texas Instruments and Nova Ltd., highlighting their distinct financial strengths and valuation challenges:
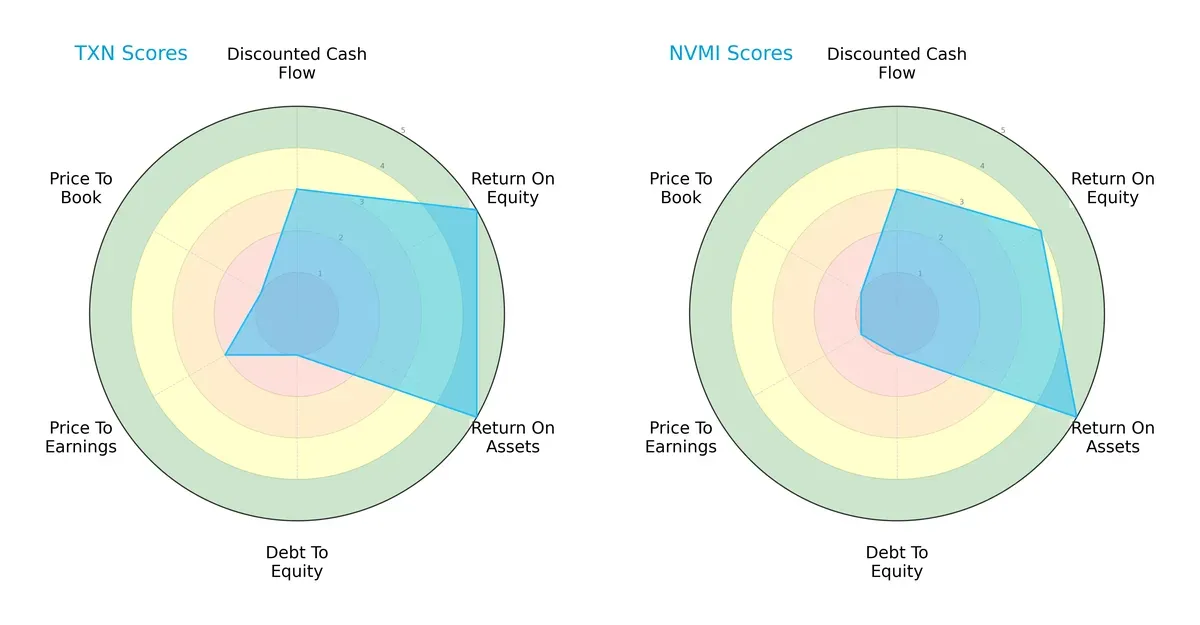
Texas Instruments shows superior efficiency with top ROE and ROA scores of 5 each, reflecting excellent asset and equity utilization. Nova Ltd. matches on ROA but trails slightly on ROE with a 4, indicating marginally less equity efficiency. Both firms share weak debt-to-equity scores at 1, signaling high leverage risk. Texas Instruments holds a moderate valuation edge with a P/E score of 2 versus Nova’s 1, though both suffer equally weak price-to-book scores. Overall, Texas Instruments presents a more balanced profile, while Nova relies more heavily on operational efficiency.
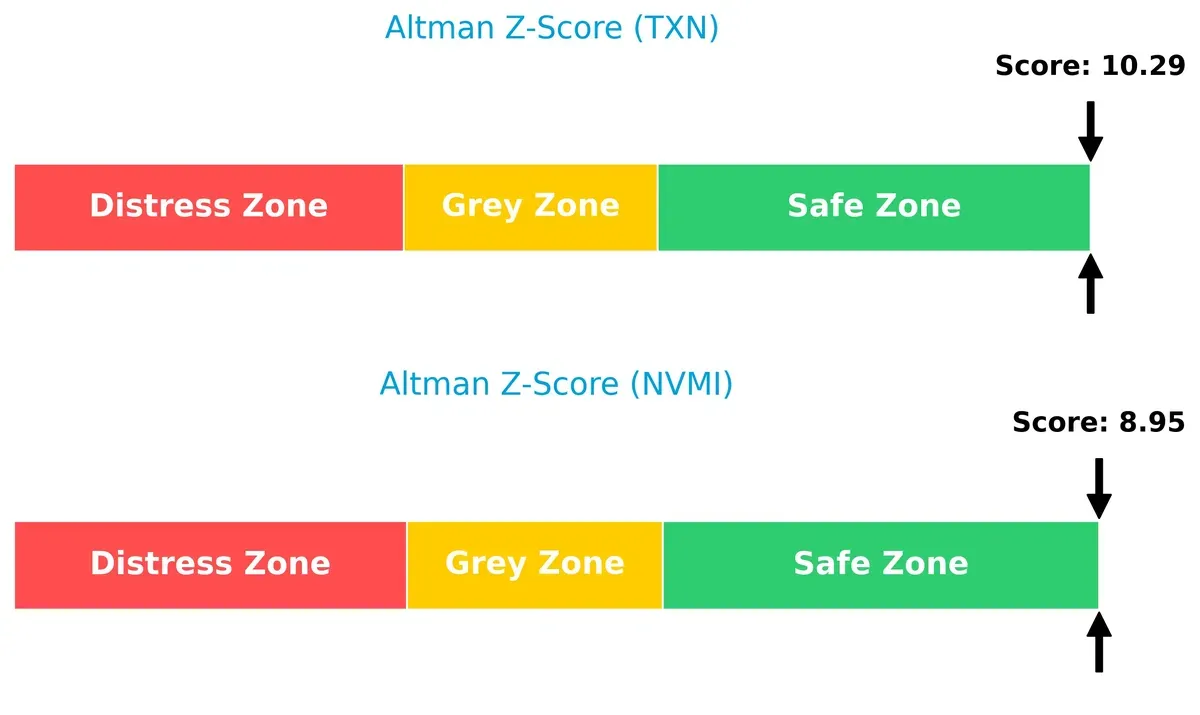
Bankruptcy Risk: Solvency Showdown
Texas Instruments’ Altman Z-Score of 10.3 versus Nova Ltd.’s 8.95 places both well in the safe zone, signaling strong solvency and low bankruptcy risk in this cycle:
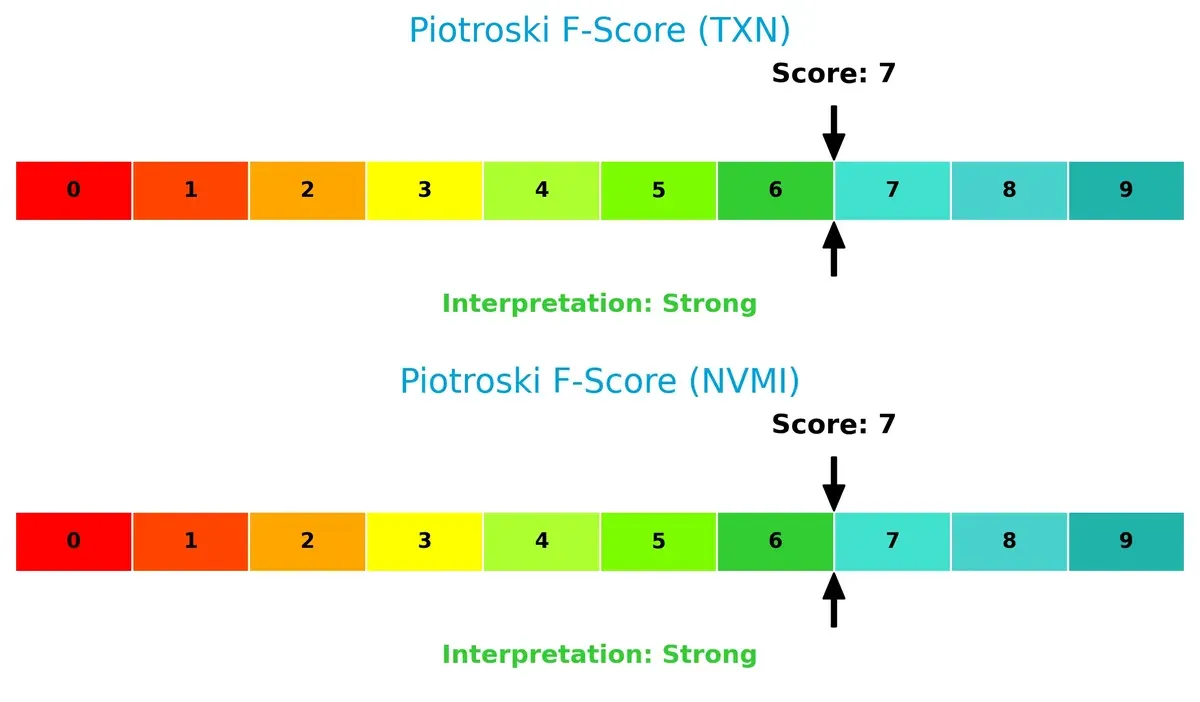
Financial Health: Quality of Operations
Both companies score a robust 7 on the Piotroski F-Score, indicating strong financial health and operational quality. Neither shows internal red flags, suggesting both maintain solid profitability and efficiency metrics:
How are the two companies positioned?
This section dissects TXN and NVMI’s operational DNA by comparing revenue distribution and internal dynamics, including strengths and weaknesses. The goal is to confront their economic moats to identify which model offers the most resilient competitive advantage today.
Revenue Segmentation: The Strategic Mix
This comparison breaks down how Texas Instruments Incorporated and Nova Ltd. diversify income streams and highlights their main sector focuses:
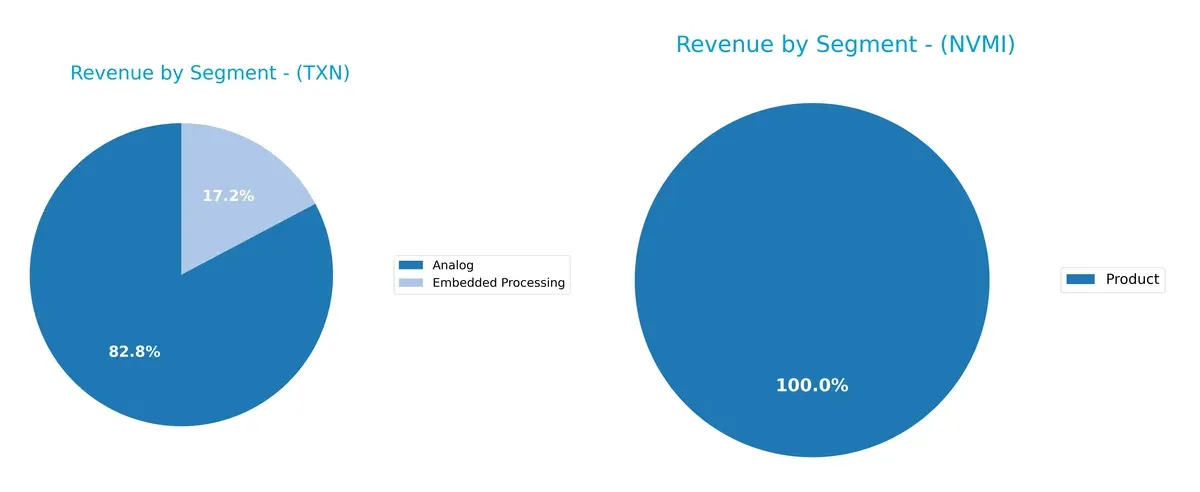
Texas Instruments anchors revenue in Analog, with $12.2B in 2024, complemented by $2.5B from Embedded Processing. This mix shows strong ecosystem lock-in and infrastructure dominance. Nova Ltd. relies solely on one segment, Product, generating $538M in 2024, indicating high concentration risk and limited diversification. TI’s broader base reduces volatility, while Nova’s focus demands vigilance on product cycle shifts.
Strengths and Weaknesses Comparison
This table compares the strengths and weaknesses of Texas Instruments and Nova Ltd.:
Texas Instruments Strengths
- Diverse revenue streams including Analog, Embedded Processing, and All Other Segments
- Strong net margin at 28.28%
- High ROE of 30.73% indicating efficient equity use
- Favorable quick ratio at 2.83 supports liquidity
- Global presence with significant sales across US, China, EMEA, and Asia
- Consistent dividend yield of 3.17%
Nova Ltd. Strengths
- Favorable net margin at 27.33% close to Texas Instruments
- Strong ROE at 19.81% with solid capital returns
- Very low debt-to-equity ratio at 0.25 supporting financial stability
- Exceptional interest coverage of 116.2 indicating strong earnings vs. interest costs
- High fixed asset turnover at 5.06 shows efficient asset use
- Favorable current and quick ratios indicate good liquidity
Texas Instruments Weaknesses
- Unfavorable P/E of 31.53 and P/B of 9.69 suggest high valuation risk
- High current ratio at 4.35 could indicate inefficient asset use
- Moderate debt with 40.62% debt to assets ratio
- Neutral WACC at 8.2% could pressure ROIC spread
- Asset turnover is average at 0.51, limiting operational leverage
- Market concentration risk given Analog dominates revenue
Nova Ltd. Weaknesses
- Unfavorable WACC at 12.25% raises capital cost concerns
- Higher P/E at 31.2 and P/B of 6.18 also indicate valuation risk
- Zero dividend yield may deter income-focused investors
- Asset turnover at 0.48 is below Texas Instruments, less efficient sales generation
- Higher percentage of unfavorable ratios (35.71%) than Texas Instruments
- Smaller scale with revenue concentrated in a single product line
Texas Instruments shows diversified revenue and global reach, supporting stable profitability despite some valuation concerns. Nova Ltd. excels in financial stability and asset efficiency but faces higher capital costs and limited diversification. Both companies have clear strengths and areas to monitor for strategic positioning.
The Moat Duel: Analyzing Competitive Defensibility
A structural moat is the only thing protecting long-term profits from the erosion of competition. Let’s examine how Texas Instruments and Nova Ltd. defend their turf:
Texas Instruments Incorporated: Analog Powerhouse with Cost Advantage
Texas Instruments leverages a cost advantage moat through scale in analog semiconductors. Its stable 35% EBIT margin and 8.3% ROIC premium confirm efficient capital use. Yet, a declining ROIC trend signals margin pressure in 2026 from intensifying global competition and supply chain challenges.
Nova Ltd.: Precision Metrology with Emerging Innovation Moat
Nova’s moat stems from specialized process control systems enabling semiconductor manufacturing precision. Though currently shedding value with ROIC near WACC, a robust 70% ROIC growth trend and 30%+ revenue growth highlight an emerging moat fueled by innovation and expanding markets in 2026.
Cost Leadership vs. Innovation Momentum
Texas Instruments holds a deeper moat with consistent value creation despite margin headwinds. Nova rides an upward profitability trajectory but lacks a wide moat today. TI’s scale and entrenched customer base better defend market share over the long term.
Which stock offers better returns?
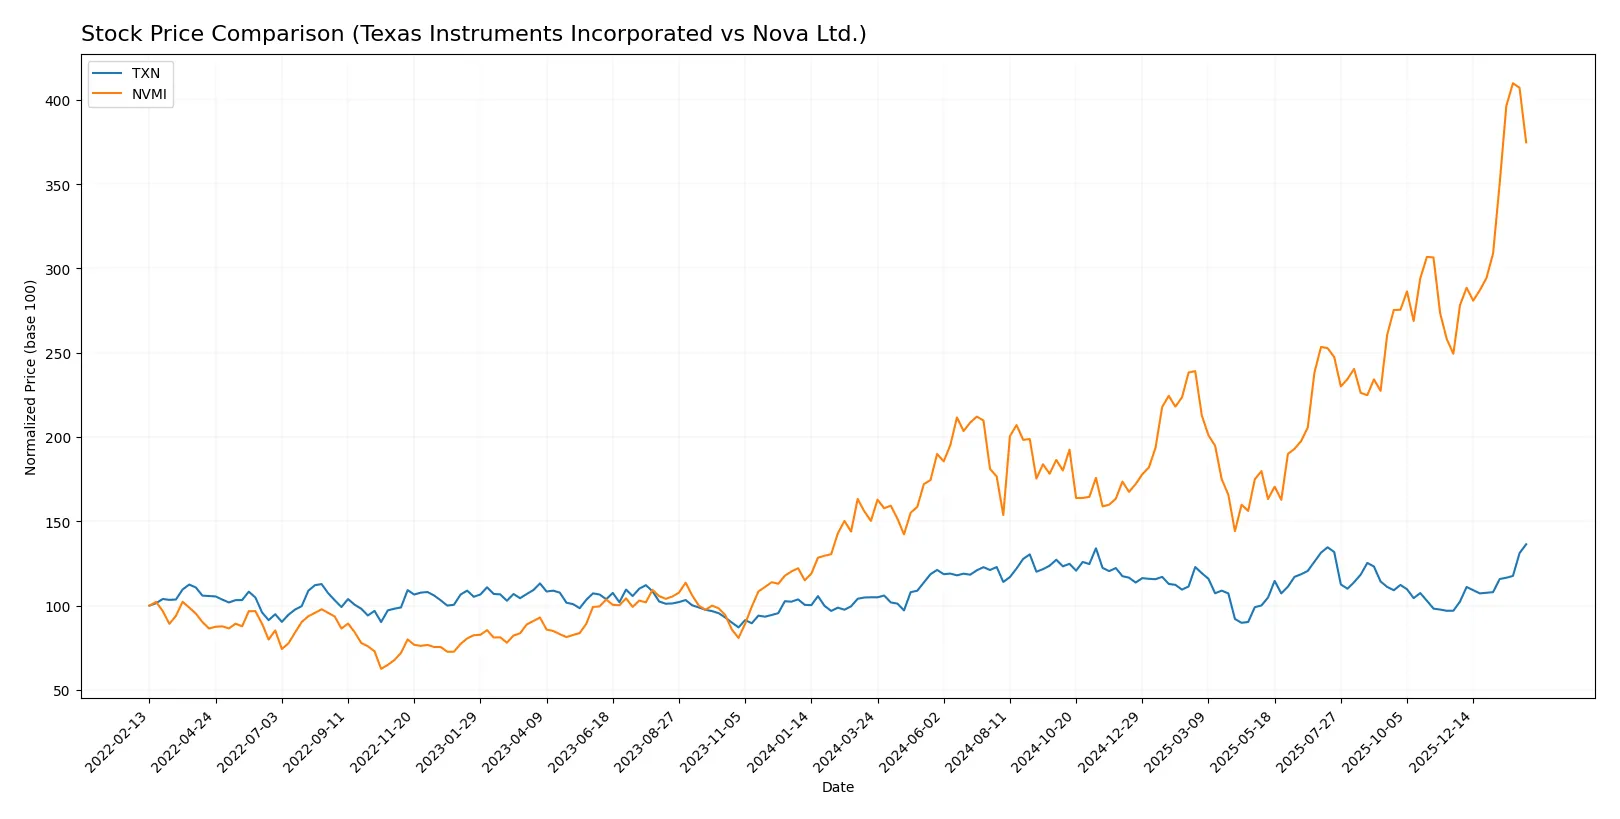
Over the past year, both Texas Instruments Incorporated and Nova Ltd. showed strong price appreciation, with notable acceleration in their upward trends reflecting robust trading dynamics.
Trend Comparison
Texas Instruments’ stock rose 29.95% over the last 12 months, showing a bullish trend with accelerating momentum and moderate volatility, peaking at 224.19 and bottoming at 147.6.
Nova Ltd. delivered a 149.46% price increase over the same period, also bullish with acceleration, but exhibited much higher volatility, ranging from 159.92 to a high of 460.91.
Comparing both, Nova Ltd. significantly outperformed Texas Instruments in market returns, demonstrating a stronger price surge despite greater price fluctuations.
Target Prices
The consensus target prices indicate cautious optimism among analysts for Texas Instruments and Nova Ltd.
| Company | Target Low | Target High | Consensus |
|---|---|---|---|
| Texas Instruments Incorporated | 160 | 260 | 204.64 |
| Nova Ltd. | 335 | 500 | 408.33 |
Analysts expect Texas Instruments to trade below the current price of 224.22, suggesting limited near-term upside. Nova Ltd.’s consensus target at 408.33 is slightly below its current price of 418.07, reflecting some caution despite its growth potential.

Don’t Let Luck Decide Your Entry Point
Optimize your entry points with our advanced ProRealTime indicators. You’ll get efficient buy signals with precise price targets for maximum performance. Start outperforming now!
How do institutions grade them?
I present the recent institutional grades for Texas Instruments Incorporated and Nova Ltd.:
Texas Instruments Incorporated Grades
This table summarizes the latest grades from leading financial institutions for TXN.
| Grading Company | Action | New Grade | Date |
|---|---|---|---|
| Jefferies | Maintain | Hold | 2026-01-28 |
| Cantor Fitzgerald | Maintain | Neutral | 2026-01-28 |
| Goldman Sachs | Maintain | Sell | 2026-01-28 |
| Truist Securities | Maintain | Hold | 2026-01-28 |
| Deutsche Bank | Maintain | Hold | 2026-01-28 |
| Stifel | Maintain | Hold | 2026-01-28 |
| UBS | Maintain | Buy | 2026-01-28 |
| B of A Securities | Upgrade | Neutral | 2026-01-28 |
| Wells Fargo | Maintain | Equal Weight | 2026-01-28 |
| JP Morgan | Maintain | Overweight | 2026-01-28 |
Nova Ltd. Grades
Below are the most recent institutional grades for NVMI from respected firms.
| Grading Company | Action | New Grade | Date |
|---|---|---|---|
| Needham | Upgrade | Buy | 2026-01-20 |
| B of A Securities | Maintain | Buy | 2026-01-13 |
| Jefferies | Maintain | Buy | 2025-12-15 |
| Evercore ISI Group | Maintain | Outperform | 2025-11-07 |
| Benchmark | Maintain | Buy | 2025-11-07 |
| Cantor Fitzgerald | Maintain | Overweight | 2025-06-24 |
| B of A Securities | Maintain | Buy | 2025-06-24 |
| Citigroup | Maintain | Buy | 2025-05-09 |
| Benchmark | Maintain | Buy | 2025-05-09 |
| B of A Securities | Maintain | Buy | 2025-04-16 |
Which company has the best grades?
Nova Ltd. consistently receives “Buy” and “Outperform” ratings, signaling stronger institutional confidence. Texas Instruments shows mixed grades, with several “Hold” and one “Sell,” indicating greater caution. These grading patterns suggest differing risk-return profiles for investors.
Risks specific to each company
The following categories identify the critical pressure points and systemic threats facing both firms in the 2026 market environment:
1. Market & Competition
Texas Instruments Incorporated
- Large market cap (203B) supports scale advantage, but pressure from diversified semiconductor peers remains intense.
Nova Ltd.
- Smaller cap (12.4B) limits scale; faces fierce competition in niche metrology systems and semiconductor process control.
2. Capital Structure & Debt
Texas Instruments Incorporated
- Moderate leverage with debt/equity at 0.86; interest coverage solid at 11.5x, signaling manageable debt risk.
Nova Ltd.
- Low leverage (debt/equity 0.25) and very strong interest coverage (116x) highlight conservative capital structure.
3. Stock Volatility
Texas Instruments Incorporated
- Beta near 1 (0.995) indicates stock volatility tracks market, offering predictable risk profile.
Nova Ltd.
- Elevated beta (1.82) signals heightened volatility and sensitivity to market swings.
4. Regulatory & Legal
Texas Instruments Incorporated
- US-based, exposed to evolving semiconductor export restrictions and IP litigation risks.
Nova Ltd.
- Operates internationally including Israel and Asia, facing complex regulatory landscapes and potential geopolitical trade restrictions.
5. Supply Chain & Operations
Texas Instruments Incorporated
- Integrated manufacturing and distribution infrastructure mitigate supply chain shocks.
Nova Ltd.
- Reliance on global semiconductor manufacturing hubs creates vulnerability to supply disruptions.
6. ESG & Climate Transition
Texas Instruments Incorporated
- Larger firm with established ESG programs; transition risks mitigated by diversified product lines.
Nova Ltd.
- Smaller scale may limit ESG investments; exposure to climate regulation in multiple jurisdictions increases risk.
7. Geopolitical Exposure
Texas Instruments Incorporated
- Primarily US operations; risks stem from US-China trade tensions affecting semiconductor exports.
Nova Ltd.
- High geopolitical risk given operations across Israel, Taiwan, China, and Korea amid escalating regional tensions.
Which company shows a better risk-adjusted profile?
Texas Instruments faces significant competition and geopolitical risks but benefits from scale, stable leverage, and moderate volatility. Nova Ltd. exhibits stronger capital discipline and financial health but endures higher stock volatility and pronounced geopolitical exposure. The most impactful risk for Texas Instruments is geopolitical trade tensions, while Nova’s key risk is its sensitive geopolitical footprint. The difference in beta—1.0 vs. 1.8—justifies concern over Nova’s stock volatility and operational risks. Overall, Texas Instruments shows a better risk-adjusted profile in 2026.
Final Verdict: Which stock to choose?
Texas Instruments wields unmatched operational efficiency, generating robust cash flows despite a slight decline in profitability. Its high current ratio signals ample liquidity but also suggests capital tied up in working assets—a point of vigilance. TXN suits portfolios seeking stable, established semiconductor exposure with moderate growth appetite.
Nova Ltd. boasts a strategic moat through accelerating profitability and an expanding ROIC trend, indicating improving capital efficiency. It offers a safer balance sheet and stronger recent earnings growth than TXN, appealing to investors favoring growth with a margin of safety. NVMI fits well in GARP portfolios aiming to capture emerging market leadership.
If you prioritize steady, cash-generative businesses with resilient margins, Texas Instruments outshines due to its entrenched market position and consistent returns. However, if you seek higher growth potential underpinned by improving capital efficiency and revenue momentum, Nova Ltd. offers better stability in scaling profitability. Both present analytical scenarios worth tailoring to your risk tolerance and investment horizon.
Disclaimer: Investment carries a risk of loss of initial capital. The past performance is not a reliable indicator of future results. Be sure to understand risks before making an investment decision.
Go Further
I encourage you to read the complete analyses of Texas Instruments Incorporated and Nova Ltd. to enhance your investment decisions: