Home > Comparison > Technology > TER vs NVMI
The strategic rivalry between Teradyne, Inc. and Nova Ltd. shapes the semiconductor industry’s evolution. Teradyne operates as a diversified technology powerhouse, spanning semiconductor test, industrial automation, and wireless test systems. In contrast, Nova Ltd. specializes in precision metrology solutions critical for semiconductor manufacturing process control. This analysis evaluates which company’s operational model and market positioning deliver superior risk-adjusted returns, guiding investors toward the optimal choice for a balanced portfolio.
Table of contents
Companies Overview
Teradyne and Nova Ltd. stand as pivotal players in the semiconductor equipment market, each shaping critical manufacturing processes.
Teradyne, Inc.: Industry-Leading Test Equipment Innovator
Teradyne dominates the automatic test equipment sector with a diversified portfolio across semiconductor, system, industrial automation, and wireless test segments. Its core revenue stems from selling advanced test systems for wafer-level devices and memory chips, serving fabs, foundries, and fabless manufacturers. In 2026, Teradyne emphasizes scaling its industrial automation and wireless test solutions amid expanding IoT and 5G applications.
Nova Ltd.: Precision Metrology Specialist
Nova Ltd. excels in process control systems essential to semiconductor manufacturing, offering metrology platforms that measure dimensional, film, and chemical properties. Its revenue base comes from supplying critical tools for lithography, etch, and packaging steps to logic, memory, and foundry sectors worldwide. Nova’s 2026 strategy focuses on refining metrology capabilities to support advanced node process control and packaging innovations.
Strategic Collision: Similarities & Divergences
Teradyne follows a broad-spectrum test equipment approach, while Nova concentrates on precision metrology, reflecting contrasting business philosophies. They compete mainly in enabling semiconductor yield and quality but target different manufacturing stages. Teradyne’s scale and diversification contrast with Nova’s specialized focus, creating distinct investment profiles balancing breadth versus niche expertise.
Income Statement Comparison
This data dissects the core profitability and scalability of both corporate engines to reveal who dominates the bottom line:
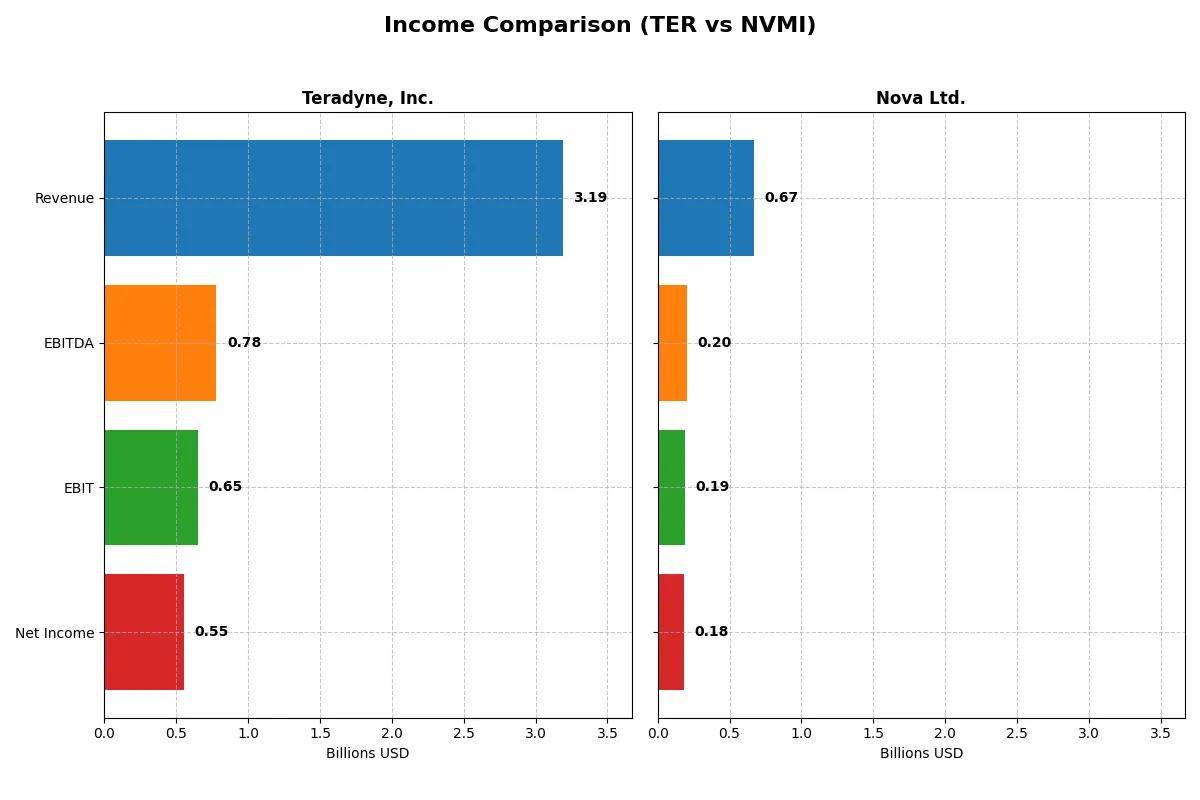
| Metric | Teradyne, Inc. (TER) | Nova Ltd. (NVMI) |
|---|---|---|
| Revenue | 3.19B | 672M |
| Cost of Revenue | 1.32B | 285M |
| Operating Expenses | 1.17B | 200M |
| Gross Profit | 1.87B | 387M |
| EBITDA | 780M | 205M |
| EBIT | 653M | 188M |
| Interest Expense | 8.0M | 1.6M |
| Net Income | 554M | 185M |
| EPS | 3.49 | 6.31 |
| Fiscal Year | 2025 | 2024 |
Income Statement Analysis: The Bottom-Line Duel
This income statement comparison reveals which company operates more efficiently and delivers stronger bottom-line results through their corporate engines.
Teradyne, Inc. Analysis
Teradyne’s revenue climbed from $2.68B in 2023 to $3.19B in 2025, showing solid top-line momentum. Gross margins remain robust near 58.5%, while net margins hover around 17.4%, reflecting consistent profitability despite a slight net margin dip last year. The 2025 net income of $554M indicates steady operational efficiency amid moderate EBIT growth.
Nova Ltd. Analysis
Nova Ltd. surged revenue by nearly 30% from $518M in 2023 to $672M in 2024, underpinned by strong margin expansion. Gross margin at 57.6% and an impressive net margin of 27.3% highlight superior cost control and earning power. Its net income rose to $185M in 2024, driven by a 20% EBIT growth, showcasing accelerating profitability and capital allocation prowess.
Growth Momentum vs. Scale and Stability
Nova Ltd. demonstrates faster revenue and net income growth with higher net margins, reflecting agile expansion and operational leverage. Teradyne offers scale with stable gross margins but faces long-term margin compression and net income decline. For investors, Nova’s high-growth, margin-rich profile looks more attractive, while Teradyne appeals as a stable, large-cap performer.
Financial Ratios Comparison
These vital ratios act as a diagnostic tool to expose the underlying fiscal health, valuation premiums, and capital efficiency of the companies compared below:
| Ratios | Teradyne, Inc. (TER) | Nova Ltd. (NVMI) |
|---|---|---|
| ROE | 19.2% (2024) | 19.8% (2024) |
| ROIC | 17.2% (2024) | 13.4% (2024) |
| P/E | 36.9 (2024) | 31.2 (2024) |
| P/B | 7.1 (2024) | 6.2 (2024) |
| Current Ratio | 2.91 (2024) | 2.32 (2024) |
| Quick Ratio | 1.84 (2024) | 1.92 (2024) |
| D/E | 0.05 (2024) | 0.25 (2024) |
| Debt-to-Assets | 3.6% (2024) | 17.0% (2024) |
| Interest Coverage | 166 (2024) | 116 (2024) |
| Asset Turnover | 0.76 (2024) | 0.48 (2024) |
| Fixed Asset Turnover | 4.88 (2024) | 5.06 (2024) |
| Payout ratio | 13.9% (2024) | 0% (2024) |
| Dividend yield | 0.38% (2024) | 0% (2024) |
| Fiscal Year | 2024 | 2024 |
Efficiency & Valuation Duel: The Vital Signs
Financial ratios act as a company’s DNA, exposing hidden risks and operational excellence behind headline numbers.
Teradyne, Inc.
Teradyne posts a solid net margin of 17.37%, signaling operational strength despite a reported 0% ROE, which raises concerns. Its P/E ratio of 54.64 suggests the stock is expensive relative to earnings. Shareholder returns rely on a modest 0.25% dividend yield, indicating limited cash returned to investors amid reinvestment or cautious capital allocation.
Nova Ltd.
Nova Ltd. demonstrates robust profitability with a 27.33% net margin and a healthy 19.81% ROE, reflecting efficient capital use. The company trades at a P/E of 31.2, expensive but more reasonable than Teradyne. It pays no dividend, instead channeling resources into growth via R&D, which accounts for 16.4% of revenue, emphasizing expansion over immediate returns.
Favorable Profitability Meets Valuation Discipline
Nova offers a stronger balance of profitability and efficient capital deployment with fewer unfavorable ratios than Teradyne. Teradyne’s high valuation and weak ROE contrast with Nova’s disciplined operational metrics. Investors focused on growth and operational efficiency may find Nova a better fit, while those prioritizing stability face more risk with Teradyne.
Which one offers the Superior Shareholder Reward?
Teradyne, Inc. (TER) and Nova Ltd. (NVMI) contrast sharply in their shareholder reward strategies. Teradyne pays a modest dividend yield of 0.38%, with a conservative payout ratio near 14%, backed by strong free cash flow coverage exceeding 2.4x. It also executes buybacks, reducing share count and enhancing total returns sustainably. Nova Ltd. pays no dividends, instead reinvesting aggressively in growth, reflected in a high free cash flow conversion ratio of 93%. However, its higher debt ratios and weaker coverage ratios signal elevated financial risk. I see Teradyne’s balanced dividend-plus-buyback model as more sustainable and rewarding in 2026, offering superior total return potential amid market uncertainty.
Comparative Score Analysis: The Strategic Profile
The radar chart reveals the core financial DNA and strategic trade-offs of Teradyne, Inc. and Nova Ltd., highlighting their strengths and vulnerabilities:
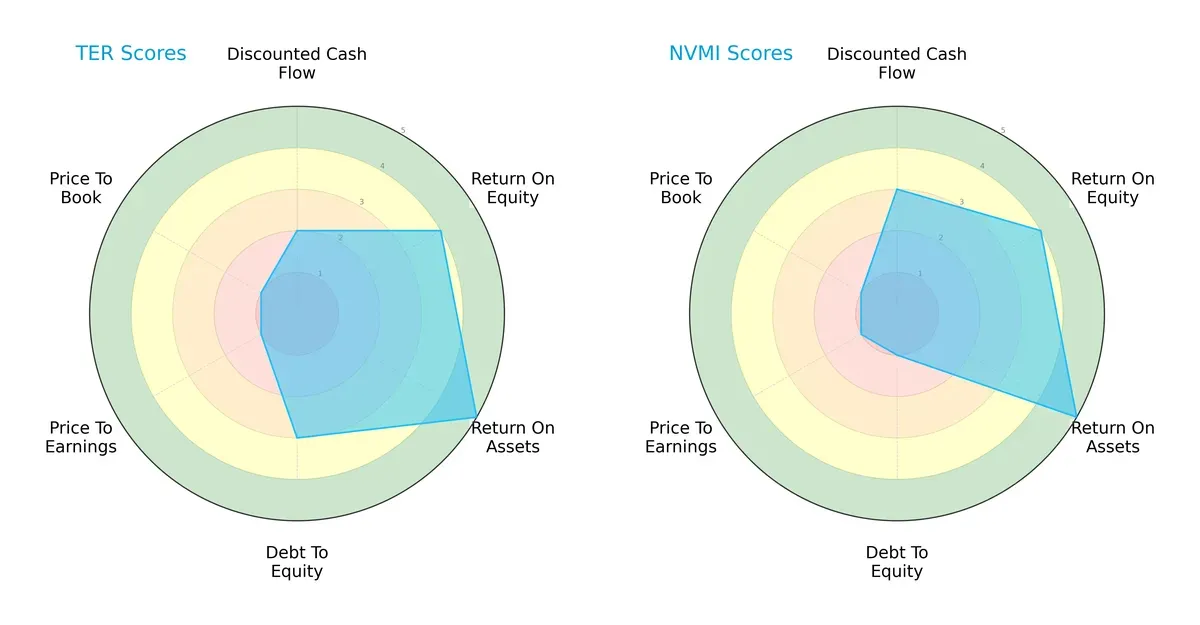
Teradyne and Nova score equally on overall metrics with balanced ROE (4) and ROA (5) scores, signaling efficient profit generation and asset use. Teradyne holds a moderate edge in debt management (3 vs. 1), indicating a healthier balance sheet. Nova outperforms slightly in discounted cash flow (3 vs. 2), suggesting better valuation potential. Both suffer from very unfavorable valuation scores (P/E and P/B), signaling possible overpricing risks. Teradyne’s profile is more balanced, while Nova relies heavily on operational efficiency but carries higher financial risk.
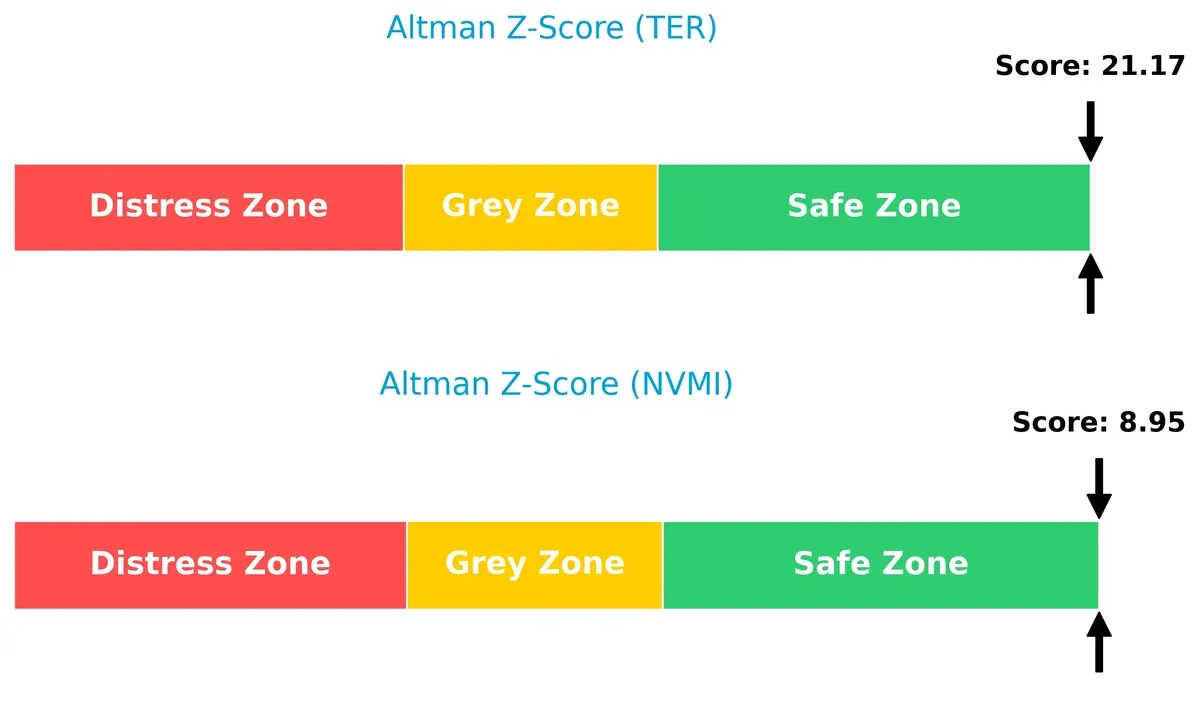
Bankruptcy Risk: Solvency Showdown
Teradyne’s Altman Z-Score of 21.17 dwarfs Nova’s 8.95, placing both in the safe zone but showing Teradyne’s superior solvency and lower bankruptcy risk in this cycle:
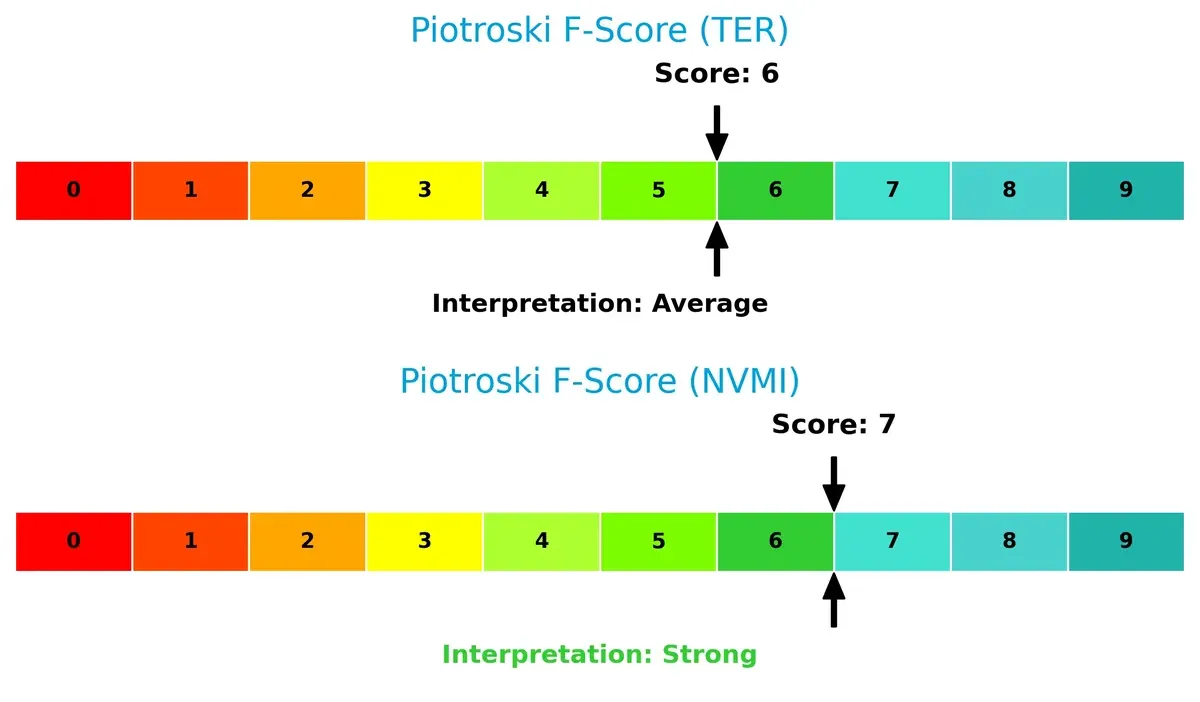
Financial Health: Quality of Operations
Nova’s Piotroski score of 7 outperforms Teradyne’s 6, indicating stronger operational quality and fewer internal red flags, suggesting Nova might be managing its financial health more effectively:
How are the two companies positioned?
This section dissects the operational DNA of Teradyne and Nova by comparing their revenue distribution and internal dynamics. The goal is to confront their economic moats to reveal which business model delivers a more resilient, sustainable competitive advantage today.
Revenue Segmentation: The Strategic Mix
This visual comparison dissects how Teradyne, Inc. and Nova Ltd. diversify their income streams and where their primary sector bets lie:
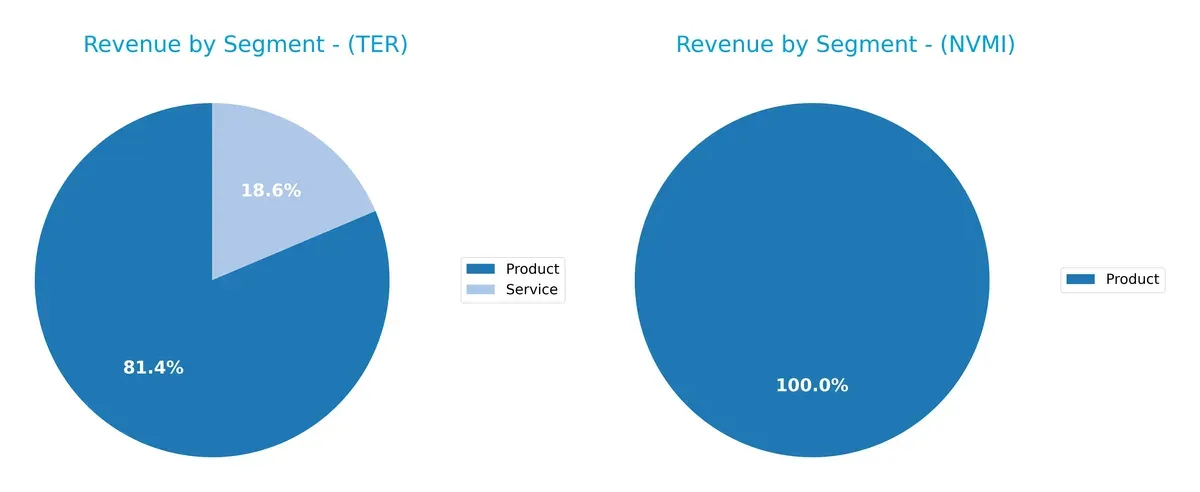
Teradyne anchors its revenue in a dual stream: $2.3B from Products and $525M from Services in 2024, showing a balanced diversification that reduces concentration risk. Nova Ltd. pivots entirely on its product line, generating $538M, exposing it to single-segment cyclicality. Teradyne’s mix suggests ecosystem lock-in and infrastructure dominance, while Nova faces higher vulnerability due to lack of segment breadth.
Strengths and Weaknesses Comparison
This table compares the strengths and weaknesses of Teradyne, Inc. and Nova Ltd.:
Teradyne, Inc. Strengths
- Strong product revenue base at 2.29B USD
- Diverse geographic sales across Asia, EMEA, and US
- Favorable net margin at 17.37%
- Low debt-to-assets ratio supports financial stability
- High interest coverage ratio at 81.43
- Favorable price-to-book ratio
Nova Ltd. Strengths
- Higher net margin at 27.33% indicating strong profitability
- Favorable ROE and ROIC above 10% indicate effective capital use
- Healthy current and quick ratios above 1.9 signal liquidity
- Low debt-to-assets ratio with favorable debt levels
- High fixed asset turnover at 5.06 evidences operational efficiency
- High interest coverage ratio at 116.2
Teradyne, Inc. Weaknesses
- Unfavorable ROE and ROIC at 0%, signaling poor capital returns
- Unavailable WACC complicates cost of capital assessment
- Poor liquidity ratios at 0, a red flag for short-term solvency
- High P/E ratio at 54.64 may indicate overvaluation
- Low dividend yield at 0.25%
- Unfavorable asset turnover metrics
Nova Ltd. Weaknesses
- Unfavorable WACC at 12.25%, higher than ROIC, reducing value creation
- Elevated P/E and P/B ratios suggest premium valuation risk
- Asset turnover below 0.5 flags potential underutilization
- No dividend yield limits income appeal
Both companies show distinct strengths: Teradyne benefits from a broad product portfolio and global presence, while Nova excels in profitability and liquidity. However, Teradyne’s weak returns on capital and liquidity ratios contrast with Nova’s higher valuation and asset use concerns. These factors highlight different strategic challenges each must address.
The Moat Duel: Analyzing Competitive Defensibility
A structural moat shields long-term profits from competitive erosion. Without it, market share and margins inevitably decline:
Teradyne, Inc.: Diverse Industry Footprint with Operational Scale
Teradyne’s moat hinges on intangible assets and product breadth across semiconductor testing and industrial automation. It delivers stable margins near 20% EBIT, yet declining ROIC signals mounting pressure. Expansion into robotics in 2026 could strengthen its competitive barrier but also faces intensifying rivals.
Nova Ltd.: Precision Metrology with Expanding Profitability
Nova’s moat relies on specialized process control technology, creating high switching costs. Its EBIT margin tops 27% with a growing ROIC trend, reflecting efficiency gains. Unlike Teradyne, Nova’s focus on semiconductor metrology offers a narrower but deepening moat, poised to capture rising demand in advanced chip manufacturing.
Moat Strength: Diversification vs. Specialized Precision
Teradyne’s broad product portfolio faces scaling challenges, reflected in falling ROIC. Nova’s focused precision tech shows improving capital returns despite shedding some value overall. I see Nova with a deeper moat, better positioned to defend and grow market share amid semiconductor innovation.
Which stock offers better returns?
The past year reveals strong bullish momentum for both stocks, with Teradyne showing faster acceleration and higher buyer dominance in recent trading. Nova Ltd. also gains but with greater volatility and milder buyer control.
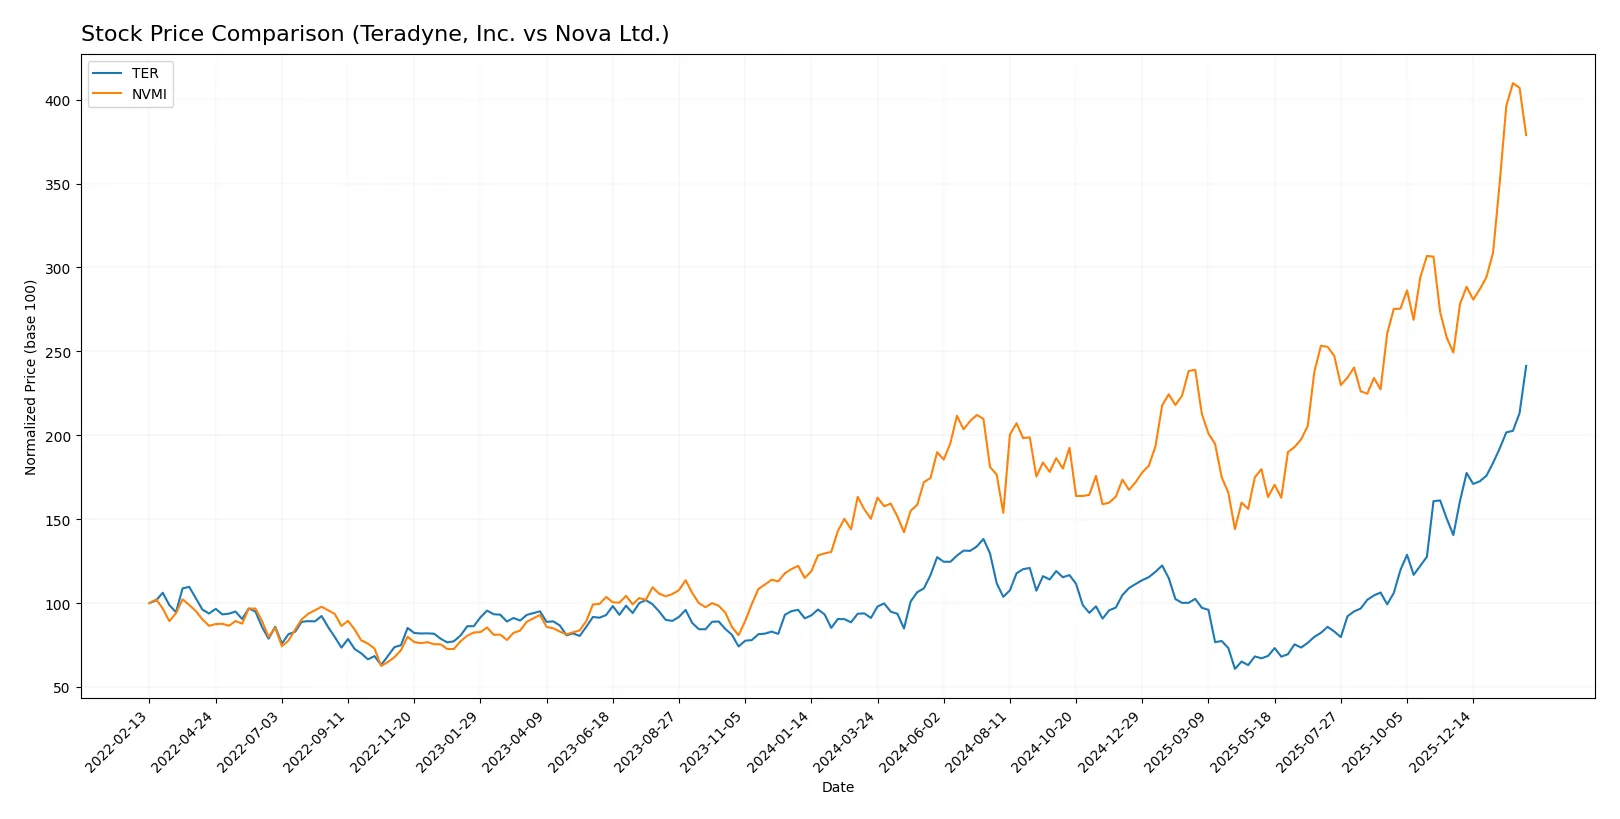
Trend Comparison
Teradyne’s stock surged 165% over the past 12 months, accelerating with a 71.75% gain from November 2025 to February 2026. Volatility is moderate at a 39.34 std deviation, with a peak near $273.
Nova Ltd. rose 152% over the same period, also accelerating but with higher volatility at 66.06 std deviation. Recent gains measure 51.95%, showing a steeper slope but less buyer dominance.
While both stocks post strong returns, Teradyne leads with a higher total price appreciation and stronger buyer volume dominance, outpacing Nova Ltd. in market performance.
Target Prices
Analysts present a bullish consensus for Teradyne and Nova, with targets reflecting growth potential despite recent stock price dips.
| Company | Target Low | Target High | Consensus |
|---|---|---|---|
| Teradyne, Inc. | 175 | 335 | 276.08 |
| Nova Ltd. | 335 | 500 | 408.33 |
Teradyne’s consensus target of 276.08 slightly exceeds its current 273.55 price, indicating modest upside. Nova’s 408.33 target sits below its 421.28 price, signaling possible market correction or overvaluation risk.

Don’t Let Luck Decide Your Entry Point
Optimize your entry points with our advanced ProRealTime indicators. You’ll get efficient buy signals with precise price targets for maximum performance. Start outperforming now!
How do institutions grade them?
Institutional grades provide insight into the recent analyst sentiment for these two companies:
Teradyne, Inc. Grades
The following table shows recent grades and actions from notable grading companies for Teradyne, Inc.:
| Grading Company | Action | New Grade | Date |
|---|---|---|---|
| Evercore ISI Group | Maintain | Outperform | 2026-02-04 |
| Cantor Fitzgerald | Maintain | Overweight | 2026-02-04 |
| Stifel | Maintain | Buy | 2026-02-04 |
| UBS | Maintain | Buy | 2026-01-26 |
| B of A Securities | Maintain | Buy | 2026-01-22 |
Nova Ltd. Grades
The following table summarizes recent grades and changes from recognized grading firms for Nova Ltd.:
| Grading Company | Action | New Grade | Date |
|---|---|---|---|
| Needham | Upgrade | Buy | 2026-01-20 |
| B of A Securities | Maintain | Buy | 2026-01-13 |
| Jefferies | Maintain | Buy | 2025-12-15 |
| Evercore ISI Group | Maintain | Outperform | 2025-11-07 |
| Cantor Fitzgerald | Maintain | Overweight | 2025-06-24 |
Which company has the best grades?
Teradyne, Inc. and Nova Ltd. both receive strong buy-related grades from respected firms. Teradyne’s most recent updates confirm stable Outperform and Buy ratings. Nova shows a recent upgrade to Buy and consistent Outperform and Buy grades. Investors may view Teradyne as slightly more consistently rated in early 2026, while Nova’s recent upgrade signals growing analyst confidence.
Risks specific to each company
The following categories identify the critical pressure points and systemic threats facing both firms in the 2026 market environment:
1. Market & Competition
Teradyne, Inc.
- Faces intense competition in semiconductor and industrial automation segments, risking margin pressure.
Nova Ltd.
- Operates in niche semiconductor process control, benefiting from specialization but exposed to rapid tech shifts.
2. Capital Structure & Debt
Teradyne, Inc.
- Exhibits a strong balance sheet with minimal debt and high interest coverage, reducing financial risk.
Nova Ltd.
- Carries moderate debt (D/E 0.25), manageable but less conservative than Teradyne’s, increasing leverage risk.
3. Stock Volatility
Teradyne, Inc.
- Beta at 1.82 signals elevated volatility relative to the market, increasing risk for risk-averse investors.
Nova Ltd.
- Beta 1.82 similarly reflects high volatility, typical in semiconductor stocks but demanding careful timing.
4. Regulatory & Legal
Teradyne, Inc.
- U.S. based, subject to evolving tech export controls and IP regulations impacting global sales.
Nova Ltd.
- Israeli-headquartered with exposure to complex international trade laws and geopolitical regulatory risks.
5. Supply Chain & Operations
Teradyne, Inc.
- Global manufacturing footprint vulnerable to semiconductor supply disruptions and logistics bottlenecks.
Nova Ltd.
- Concentrated in key semiconductor hubs, exposed to regional supply chain fragilities and geopolitical tensions.
6. ESG & Climate Transition
Teradyne, Inc.
- Faces increasing pressure to reduce carbon footprint in industrial automation and semiconductor testing.
Nova Ltd.
- Needs to enhance ESG disclosures and climate risk strategies amid rising investor scrutiny.
7. Geopolitical Exposure
Teradyne, Inc.
- U.S.-China tensions pose risks to sales and supply chain in critical Asian markets.
Nova Ltd.
- Higher geopolitical risk due to Israel location, with potential disruptions from regional conflicts.
Which company shows a better risk-adjusted profile?
Teradyne’s most impactful risk is competitive pressure eroding margins, despite a robust balance sheet and low leverage. Nova’s principal risk lies in geopolitical exposure and moderate debt increasing financial vulnerability. Teradyne’s conservative capital structure and superior interest coverage provide a safer risk-adjusted profile. Notably, Teradyne’s Altman Z-score of 21.17 signals exceptional financial stability, while Nova’s score, though safe at 8.95, is comparatively lower. This contrast justifies greater caution with Nova in the current volatile geopolitical climate.
Final Verdict: Which stock to choose?
Teradyne’s superpower lies in its robust cash generation and operational efficiency, supporting sustained innovation in a capital-intensive sector. A point of vigilance is its declining ROIC trend, signaling potential challenges in value creation. It fits well with aggressive growth portfolios willing to tolerate some operational headwinds.
Nova Ltd. boasts a strategic moat through steadily improving profitability and a growing ROIC, reflecting a strengthening competitive position. It offers a safer financial profile than Teradyne, with better balance sheet stability. This makes it suitable for GARP investors seeking growth with a margin of prudence.
If you prioritize aggressive growth fueled by operational cash strength, Teradyne is the compelling choice due to its cash machine profile despite some waning capital efficiency. However, if you seek better stability combined with improving profitability, Nova Ltd. outshines as a slightly more prudent growth play with a clearer path to value creation.
Disclaimer: Investment carries a risk of loss of initial capital. The past performance is not a reliable indicator of future results. Be sure to understand risks before making an investment decision.
Go Further
I encourage you to read the complete analyses of Teradyne, Inc. and Nova Ltd. to enhance your investment decisions: