Home > Comparison > Technology > STM vs NVMI
The strategic rivalry between STMicroelectronics N.V. and Nova Ltd. shapes the semiconductor industry’s innovation frontier. STMicroelectronics operates as a diversified semiconductor manufacturer with a broad product portfolio across automotive, industrial, and consumer segments. Nova Ltd. focuses narrowly on advanced metrology systems critical for semiconductor process control. This analysis pits ST’s scale and scope against Nova’s specialized precision to identify which trajectory delivers superior risk-adjusted returns for a balanced portfolio.
Table of contents
Companies Overview
STMicroelectronics N.V. and Nova Ltd. stand as pivotal players shaping the semiconductor industry.
STMicroelectronics N.V.: Semiconductor Powerhouse
STMicroelectronics dominates as a global semiconductor designer and manufacturer with a broad product portfolio. Its core revenue stems from automotive ICs, analog sensors, and microcontrollers. In 2026, STMicroelectronics sharpens its focus on integrated power solutions and MEMS technology to address automotive and industrial market demands.
Nova Ltd.: Precision in Process Control
Nova Ltd. excels in semiconductor process control systems, supplying critical metrology platforms for chip manufacturing. It generates revenue by selling advanced measurement tools to logic, foundry, and memory sectors. The company’s 2026 strategy prioritizes expanding its metrology technology footprint across key semiconductor hubs worldwide.
Strategic Collision: Similarities & Divergences
Both firms compete in semiconductor technology but pursue different philosophies: STMicroelectronics offers broad hardware integration, while Nova specializes in precise process control. Their primary battleground is the semiconductor production ecosystem, with ST focused on device components and Nova on manufacturing accuracy. These distinctions define their unique investment profiles—one broad and diversified, the other niche and specialized.
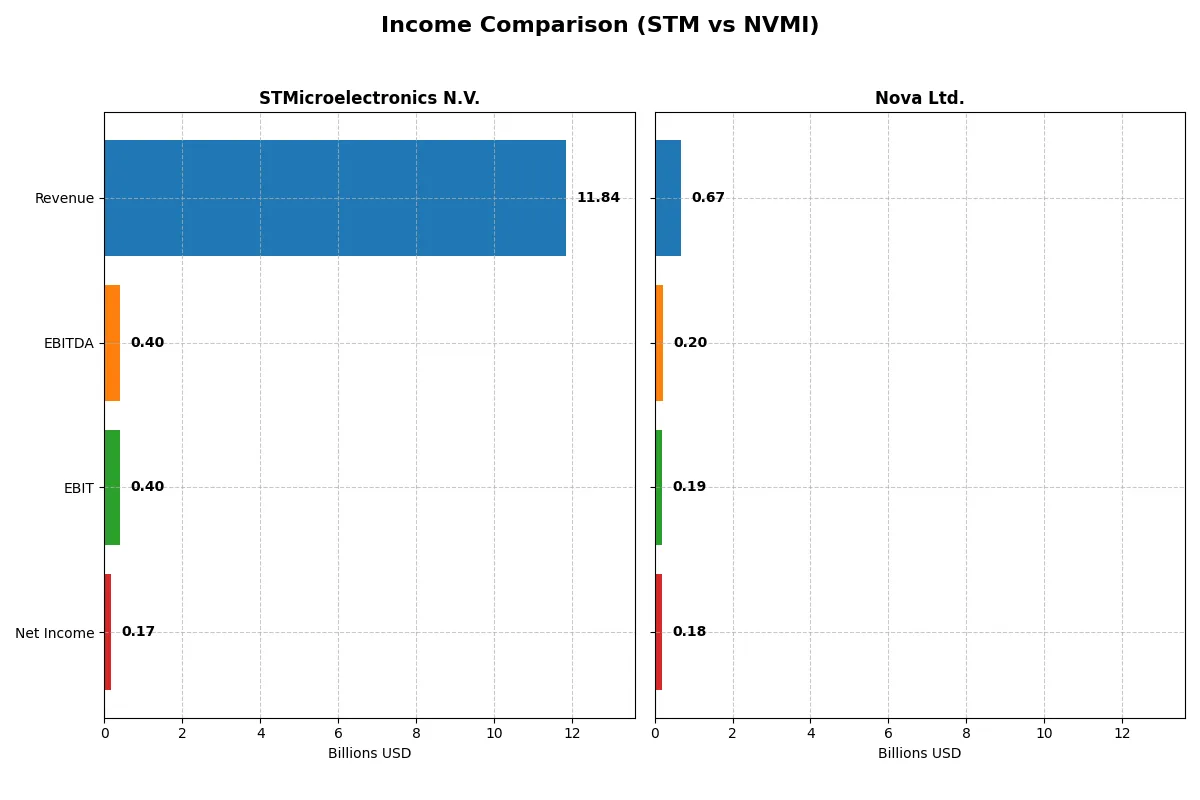
Income Statement Comparison
The following data dissects the core profitability and scalability of both corporate engines to reveal who dominates the bottom line:
| Metric | STMicroelectronics N.V. (STM) | Nova Ltd. (NVMI) |
|---|---|---|
| Revenue | 11.8B | 672M |
| Cost of Revenue | 7.8B | 285M |
| Operating Expenses | 3.7B | 200M |
| Gross Profit | 4.0B | 387M |
| EBITDA | 401M | 205M |
| EBIT | 401M | 188M |
| Interest Expense | 0 | 1.6M |
| Net Income | 167M | 184.9M |
| EPS | 0.19 | 6.31 |
| Fiscal Year | 2025 | 2024 |
Income Statement Analysis: The Bottom-Line Duel
This income statement comparison unveils which company operates with greater efficiency and delivers stronger profitability momentum.
STMicroelectronics N.V. Analysis
STMicroelectronics’ revenue declined from 17.3B in 2023 to 11.8B in 2025, with net income plunging sharply from 4.2B to 167M. Gross margin contracted to 33.9%, reflecting margin pressure, while net margin fell below 2%. The 2025 results highlight a significant deterioration in profitability and operational efficiency.
Nova Ltd. Analysis
Nova Ltd. grew revenue robustly from 416M in 2021 to 672M in 2024, with net income rising from 93M to 184M. Its gross margin stands strong at 57.6%, and net margin remains impressive near 27%. The latest year sustains solid margin expansion and healthy earnings growth, demonstrating operational strength and momentum.
Margin Power vs. Revenue Scale
Nova Ltd. outperforms STMicroelectronics in margin resilience and consistent earnings growth. STM’s shrinking top line and eroding profitability contrast sharply with Nova’s expanding revenue and robust net margins. For investors, Nova’s profile offers superior efficiency and growth potential, while STM faces mounting challenges in preserving its earnings base.
Financial Ratios Comparison
These vital ratios act as a diagnostic tool to expose the underlying fiscal health, valuation premiums, and capital efficiency of the companies compared below:
| Ratios | STMicroelectronics N.V. (STM) | Nova Ltd. (NVMI) |
|---|---|---|
| ROE | 8.92% (2024) | 19.81% (2024) |
| ROIC | 6.34% (2024) | 13.39% (2024) |
| P/E | 14.43 (2024) | 31.20 (2024) |
| P/B | 1.29 (2024) | 6.18 (2024) |
| Current Ratio | 3.11 (2024) | 2.32 (2024) |
| Quick Ratio | 2.37 (2024) | 1.92 (2024) |
| D/E | 0.18 (2024) | 0.25 (2024) |
| Debt-to-Assets | 12.80% (2024) | 17.00% (2024) |
| Interest Coverage | 19.72 (2024) | 116.20 (2024) |
| Asset Turnover | 0.54 (2024) | 0.48 (2024) |
| Fixed Asset Turnover | 1.22 (2024) | 5.06 (2024) |
| Payout ratio | 18.50% (2024) | 0.00% (2024) |
| Dividend yield | 1.28% (2024) | 0.00% (2024) |
| Fiscal Year | 2024 | 2024 |
Efficiency & Valuation Duel: The Vital Signs
Financial ratios act as a company’s DNA, revealing hidden risks and operational strengths essential for investment decisions.
STMicroelectronics N.V.
STMicroelectronics shows weak profitability with a 0.93% ROE and a slim 1.41% net margin, indicating operational challenges. Its valuation metrics, including P/E and P/B, appear favorable due to zero values reported. The company lacks dividends, focusing instead on robust R&D investment at 15.7% of revenue, signaling a growth-oriented reinvestment approach.
Nova Ltd.
Nova Ltd. demonstrates strong profitability with a 19.81% ROE and a 27.33% net margin, reflecting operational efficiency. However, it trades at a stretched valuation with a 31.2 P/E and 6.18 P/B ratios. The absence of dividends suggests reinvestment into growth, supported by a heavy 16.4% R&D-to-revenue ratio, emphasizing innovation.
Premium Valuation vs. Operational Safety
Nova offers superior profitability but at a significantly higher valuation risk compared to STMicroelectronics’ conservative market multiples. ST’s focus on R&D and favorable valuation suits investors prioritizing operational safety, while Nova fits those seeking growth with tolerance for premium pricing.
Which one offers the Superior Shareholder Reward?
I observe that STMicroelectronics (STM) pays a modest dividend yield of 1.28% in 2024 with a sustainable payout ratio near 18%, supported by positive free cash flow coverage. STM’s buyback intensity is moderate, balancing growth and returns. Nova Ltd. (NVMI) pays no dividends but channels substantial free cash flow (7.5/share) into reinvestment and aggressive buybacks, fueling higher operating margins and growth. NVMI’s absence of dividend and focus on capital allocation through buybacks suggests a more growth-oriented strategy but with higher valuation multiples. For risk-conscious investors prioritizing consistent income and sustainability, STM’s balanced dividend and buyback approach offers steadier total returns in 2026. Growth-focused investors willing to accept valuation risk may prefer NVMI’s aggressive capital reinvestment and buybacks for superior long-term capital appreciation. Overall, I favor STM for superior shareholder reward through a more sustainable, income-inclusive model.
Comparative Score Analysis: The Strategic Profile
The radar chart reveals the fundamental DNA and trade-offs of both STMicroelectronics and Nova Ltd., highlighting their core strengths and vulnerabilities:
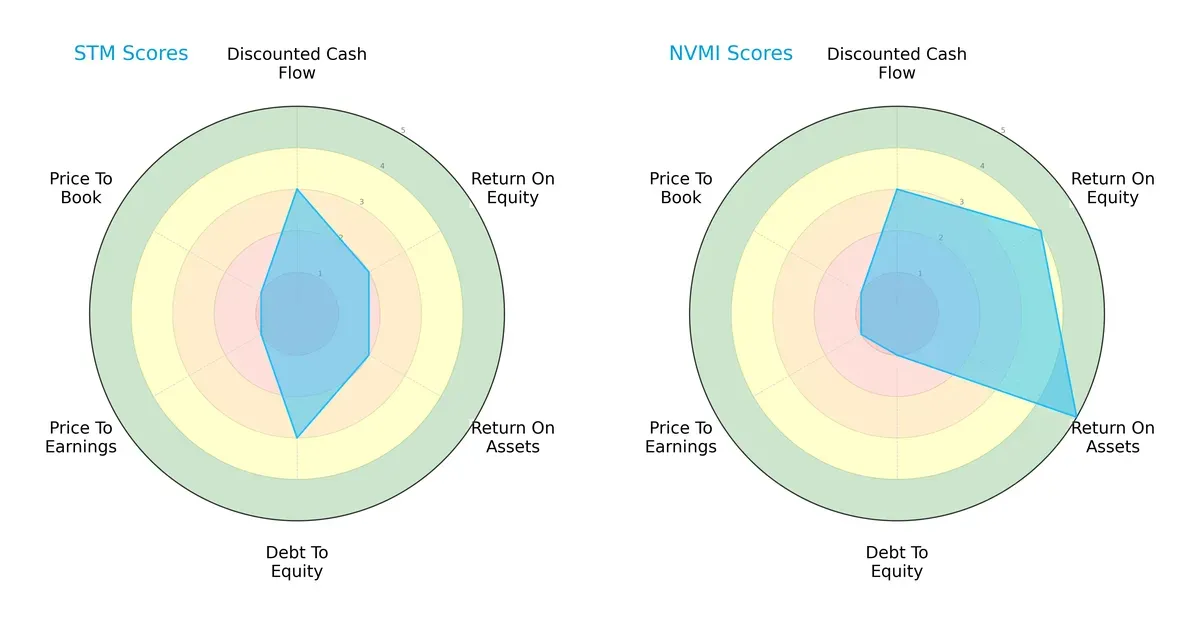
STMicroelectronics shows a balanced profile with moderate DCF, ROE, ROA, and debt-to-equity scores, but suffers from very unfavorable valuation metrics (PE/PB). Nova Ltd. leverages superior profitability with high ROE (4) and ROA (5) scores but carries significant financial risk with a very unfavorable debt-to-equity score (1). Nova relies heavily on operational efficiency, while STMicroelectronics presents steadier leverage management.
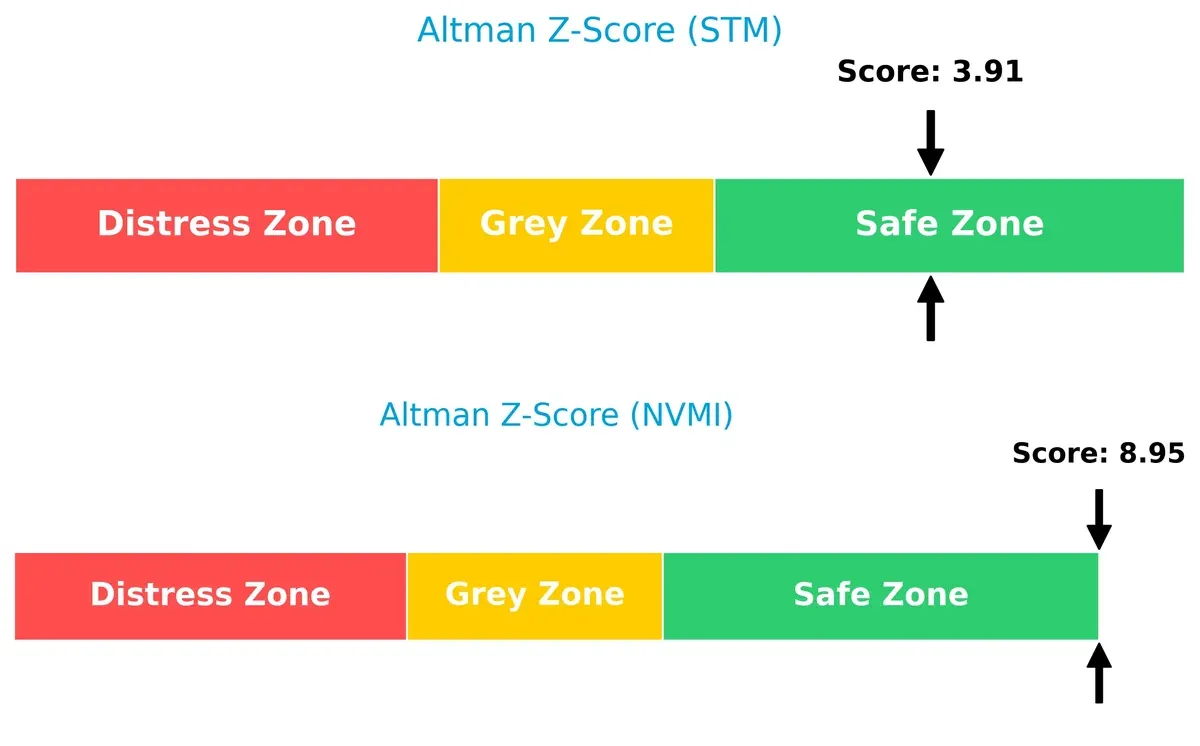
Bankruptcy Risk: Solvency Showdown
Nova Ltd.’s Altman Z-Score (8.95) far exceeds STMicroelectronics’ 3.91, signaling a stronger solvency position and a lower bankruptcy risk in this economic cycle:
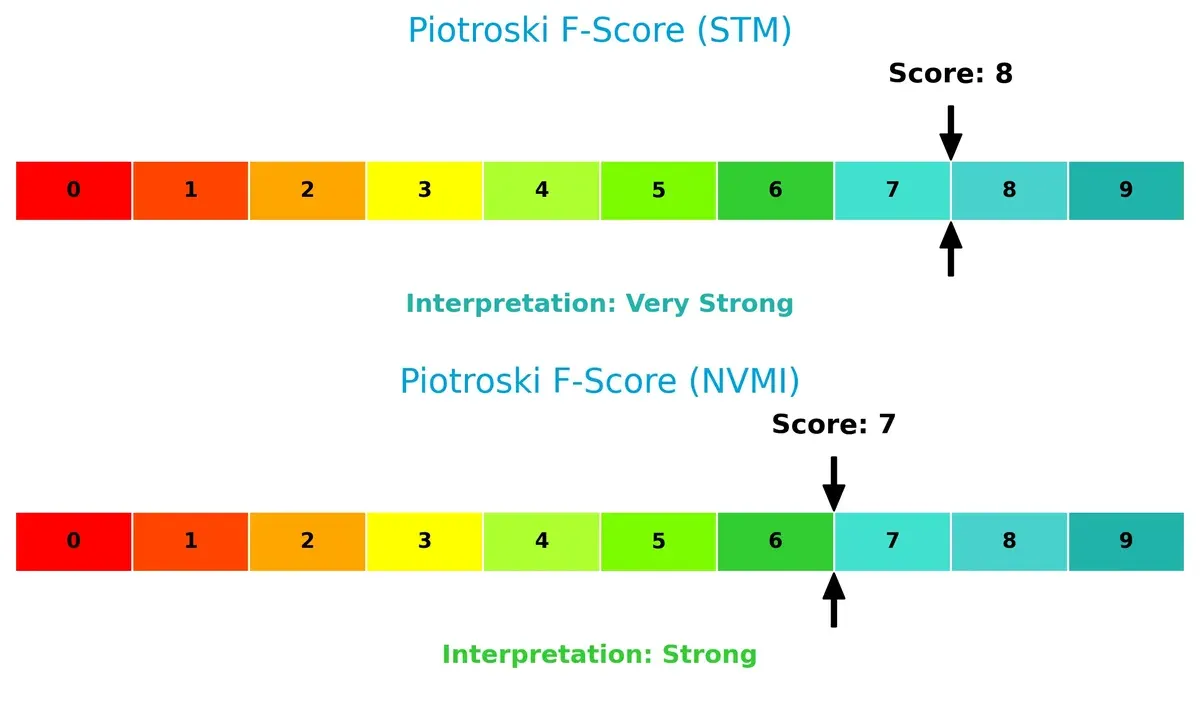
Financial Health: Quality of Operations
STMicroelectronics leads with a Piotroski F-Score of 8, indicating very strong operational quality. Nova Ltd.’s score of 7 is strong but suggests slightly less robustness in financial health metrics:
How are the two companies positioned?
This section dissects the operational DNA of STM and NVMI by comparing their revenue distribution and internal dynamics—strengths and weaknesses. The goal is to confront their economic moats and identify which model offers the most resilient, sustainable competitive advantage today.
Revenue Segmentation: The Strategic Mix
This visual comparison dissects how STMicroelectronics and Nova Ltd. diversify their income streams and where their primary sector bets lie:
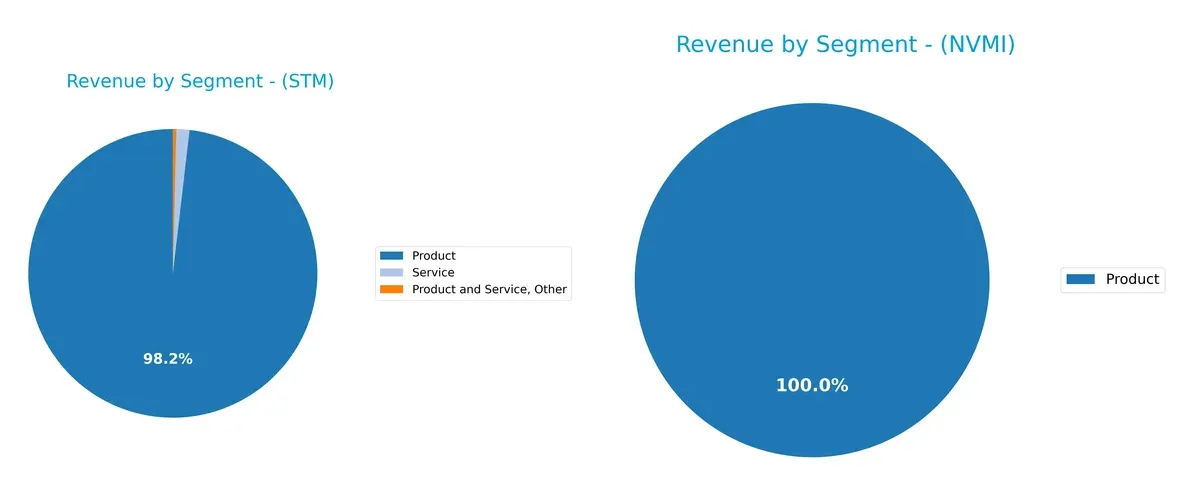
STMicroelectronics anchors revenue heavily in its Product segment, with $13.2B in 2024, supplemented by modest Service and Other streams. Nova Ltd. relies entirely on Product revenue, $538M in 2024, showing no diversification. STM’s broader mix reduces concentration risk and underpins ecosystem lock-in. In contrast, Nova’s single-segment focus exposes it to market swings, lacking the infrastructure dominance STM enjoys.
Strengths and Weaknesses Comparison
This table compares the Strengths and Weaknesses of STMicroelectronics N.V. (STM) and Nova Ltd. (NVMI):
STM Strengths
- Low debt-to-assets ratio at 8.6%
- Strong interest coverage ratio (infinite)
- Favorable quick ratio at 2.43
- Diverse geographic revenue with strong Asia Pacific presence
- Favorable valuation metrics (PE and PB at 0)
NVMI Strengths
- High net margin of 27.33%
- Strong ROE at 19.81% and ROIC at 13.39%
- Favorable current and quick ratios
- Low debt-to-assets ratio at 16.98%
- High fixed asset turnover at 5.06
STM Weaknesses
- Unfavorable profitability ratios: net margin 1.41%, ROE 0.93%, ROIC 0.67%
- High current ratio at 3.36 may indicate inefficient asset use
- Unfavorable asset turnover at 0.48
- No dividend yield
- Limited product diversification, mainly products and small services segment
NVMI Weaknesses
- High weighted average cost of capital (12.26%)
- Unfavorable valuation multiples: PE 31.2, PB 6.18
- Unfavorable asset turnover at 0.48
- No dividend yield
- Limited geographic diversification, no reported international revenue
STM benefits from strong liquidity and low leverage alongside diversified international sales, particularly in Asia. However, its profitability and asset efficiency lag behind NVMI. NVMI shows robust profitability and efficient asset use but faces valuation and cost of capital challenges, with limited geographic reach. These contrasts shape each company’s strategic focus on either operational improvement or market expansion.
The Moat Duel: Analyzing Competitive Defensibility
A structural moat safeguards long-term profits from relentless competition and market shifts. Let’s dissect the nature and durability of moats for these two semiconductor players:
STMicroelectronics N.V.: Diverse Product Portfolio with Weak ROIC
STM’s primary moat lies in its broad product range across automotive, industrial, and consumer markets. Historically, this diversification supports stable margins but STM’s negative ROIC trend signals weakening capital efficiency. New technologies like MasterGaN could deepen the moat if commercialized successfully, but current profitability erosion threatens its resilience in 2026.
Nova Ltd.: Precision Metrology with Growing Profitability
Nova’s moat centers on intangible assets and specialized metrology systems critical in semiconductor manufacturing. Unlike STM, NVMI sustains a rising ROIC and robust margins, reflecting strong pricing power and operational leverage. Its expanding product applications in advanced packaging position it well for market disruption and growth in 2026.
Moat Strength: Diversification vs. Specialization
Nova’s specialized, high-margin niche yields a deeper, more sustainable moat compared to STM’s sprawling but weakening portfolio. NVMI is better equipped to defend its market share through innovation and operational efficiency. STM faces an uphill battle restoring value amid declining returns.
Which stock offers better returns?
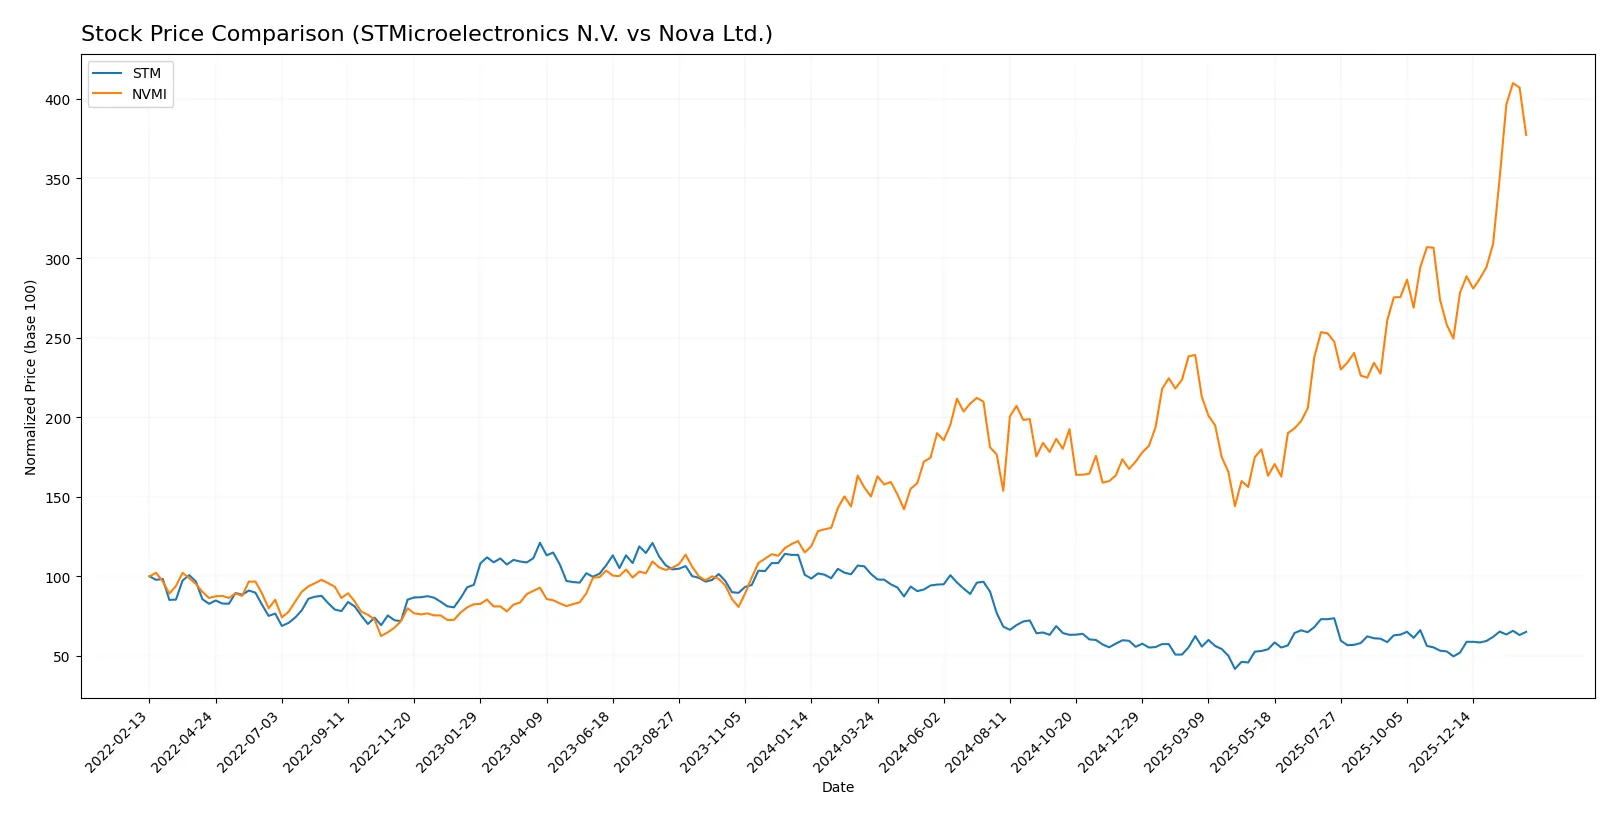
The past year shows starkly divergent stock price trajectories for STM and NVMI, with STM facing sustained declines and NVMI experiencing rapid growth and heightened trading activity.
Trend Comparison
STMicroelectronics N.V. (STM) shows a bearish trend over the past 12 months with a -35.86% price change, accelerating downward from a high of 44.85 to a low of 18.49. Recent months indicate a 30.93% recovery, suggesting short-term upward momentum.
Nova Ltd. (NVMI) exhibits a strong bullish trend with a 151.22% price increase over the same period, accelerating sharply despite high volatility (std dev 66.01). Recent gains of 51.34% reinforce robust upward momentum from 159.92 to 460.91.
NVMI’s stock outperforms STM significantly, delivering the highest market returns over the past year with sustained acceleration and dominant buyer activity, contrasting STM’s overall decline and recent partial rebound.
Target Prices
Analysts present a clear consensus on target prices for STMicroelectronics N.V. and Nova Ltd., reflecting robust expectations ahead.
| Company | Target Low | Target High | Consensus |
|---|---|---|---|
| STMicroelectronics N.V. | 28 | 45 | 37.67 |
| Nova Ltd. | 335 | 500 | 408.33 |
STMicroelectronics trades near its target low at $28.80 versus a $37.67 consensus, suggesting upside potential. Nova Ltd. trades slightly above consensus at $425, indicating mixed near-term sentiment despite a strong long-term outlook.

Don’t Let Luck Decide Your Entry Point
Optimize your entry points with our advanced ProRealTime indicators. You’ll get efficient buy signals with precise price targets for maximum performance. Start outperforming now!
How do institutions grade them?
Institutional grades for STMicroelectronics N.V. and Nova Ltd. provide insight into their recent analyst evaluations:
STMicroelectronics N.V. Grades
The following table shows recent grades issued by established financial firms for STMicroelectronics N.V.:
| Grading Company | Action | New Grade | Date |
|---|---|---|---|
| TD Cowen | Maintain | Buy | 2025-10-24 |
| Susquehanna | Maintain | Positive | 2025-10-22 |
| Susquehanna | Maintain | Positive | 2025-07-25 |
| Baird | Upgrade | Outperform | 2025-07-22 |
| Susquehanna | Maintain | Positive | 2025-07-22 |
| Jefferies | Upgrade | Buy | 2025-02-19 |
| Bernstein | Downgrade | Market Perform | 2025-02-05 |
| Susquehanna | Maintain | Positive | 2025-01-31 |
| Barclays | Downgrade | Underweight | 2025-01-22 |
| JP Morgan | Downgrade | Neutral | 2024-12-09 |
Nova Ltd. Grades
Recent institutional grades for Nova Ltd. reflect consistent positive analyst sentiment:
| Grading Company | Action | New Grade | Date |
|---|---|---|---|
| Needham | Upgrade | Buy | 2026-01-20 |
| B of A Securities | Maintain | Buy | 2026-01-13 |
| Jefferies | Maintain | Buy | 2025-12-15 |
| Evercore ISI Group | Maintain | Outperform | 2025-11-07 |
| Benchmark | Maintain | Buy | 2025-11-07 |
| Cantor Fitzgerald | Maintain | Overweight | 2025-06-24 |
| B of A Securities | Maintain | Buy | 2025-06-24 |
| Citigroup | Maintain | Buy | 2025-05-09 |
| Benchmark | Maintain | Buy | 2025-05-09 |
| B of A Securities | Maintain | Buy | 2025-04-16 |
Which company has the best grades?
Nova Ltd. holds consistently strong buy and outperform ratings with few or no downgrades. STMicroelectronics shows more mixed opinions with recent downgrades. Nova’s steadier grades may signal greater institutional confidence, potentially affecting investor perception.
Risks specific to each company
The following categories identify the critical pressure points and systemic threats facing both firms in the 2026 market environment:
1. Market & Competition
STMicroelectronics N.V.
- Operates in a highly competitive semiconductor market with broad product segments. Faces pressure from global chipmakers expanding capacity.
Nova Ltd.
- Specializes in metrology equipment for semiconductor manufacturing. Faces intense competition from technology advances and equipment makers.
2. Capital Structure & Debt
STMicroelectronics N.V.
- Maintains a low debt-to-equity ratio (0.12), indicating financial conservatism and strong balance sheet.
Nova Ltd.
- Moderate leverage (0.25 debt-to-equity) but manageable interest coverage (116x) suggests sound debt servicing ability.
3. Stock Volatility
STMicroelectronics N.V.
- Beta of 1.32 reflects moderate sensitivity to market swings, typical for large semiconductor firms.
Nova Ltd.
- Beta of 1.82 shows higher volatility, increasing risk for short-term investors amid sector cyclicality.
4. Regulatory & Legal
STMicroelectronics N.V.
- Exposed to global trade regulations, especially EU and US semiconductor policies.
Nova Ltd.
- Faces regulatory scrutiny in multiple jurisdictions including Israel and US, with export compliance risks.
5. Supply Chain & Operations
STMicroelectronics N.V.
- Diverse global manufacturing footprint mitigates regional disruptions but supply chain complexity remains a risk.
Nova Ltd.
- Relies heavily on semiconductor manufacturing hubs in Asia; supply chain shocks could impact production.
6. ESG & Climate Transition
STMicroelectronics N.V.
- Large industrial footprint requires active management of emissions and resource use amid tightening EU regulations.
Nova Ltd.
- Smaller scale but in a tech sector under pressure to improve sustainability and resource efficiency.
7. Geopolitical Exposure
STMicroelectronics N.V.
- Global presence exposes firm to US-China tensions and EU trade policy shifts.
Nova Ltd.
- Significant exposure to East Asian markets and geopolitical risks involving US-China relations.
Which company shows a better risk-adjusted profile?
Nova Ltd. faces its largest risk from stock volatility and geopolitical exposure, reflecting its niche market and regional concentration. STMicroelectronics struggles mainly with operational complexity and regulatory challenges in a global semiconductor landscape. Despite Nova’s higher beta and leverage, its strong profitability and financial scores demonstrate better risk-adjusted fundamentals. STMicroelectronics’ weaker profitability and valuation metrics suggest greater caution, despite a robust balance sheet. The clear trend is that Nova’s superior returns and safety scores justify confidence, while ST’s mixed financial health signals prudence.
Final Verdict: Which stock to choose?
STMicroelectronics N.V. (STM) shines as a resilient cash generator with a strong liquidity buffer and a disciplined low-debt profile. Its main point of vigilance lies in declining profitability and a shrinking moat, which could pressure long-term returns. STM suits portfolios seeking cyclical value with a tolerance for operational turnaround.
Nova Ltd. (NVMI) boasts a strategic moat grounded in robust profitability and expanding returns on invested capital. Its premium valuation signals confidence but also demands patience. Relative to STM, NVMI offers better growth stability and operational efficiency, fitting well within GARP portfolios aiming for growth balanced with reasonable risk.
If you prioritize value-driven turnaround plays with strong balance sheets, STM is the compelling choice due to its defensive liquidity and capital structure. However, if you seek growth anchored in improving profitability and a modest moat, NVMI offers better stability and upward momentum despite its higher valuation. Both profiles require close monitoring of market cycles and execution risks.
Disclaimer: Investment carries a risk of loss of initial capital. The past performance is not a reliable indicator of future results. Be sure to understand risks before making an investment decision.
Go Further
I encourage you to read the complete analyses of STMicroelectronics N.V. and Nova Ltd. to enhance your investment decisions: