Home > Comparison > Technology > NVMI vs SWKS
The strategic rivalry between Nova Ltd. and Skyworks Solutions, Inc. shapes the semiconductor industry’s competitive landscape. Nova operates as a specialized process control systems provider, focusing on metrology platforms essential for chip manufacturing. In contrast, Skyworks delivers a broad portfolio of proprietary semiconductor products across multiple end markets, emphasizing scale and diversification. This analysis will evaluate which operational model offers superior risk-adjusted returns for investors seeking durable exposure to technology sector innovation.
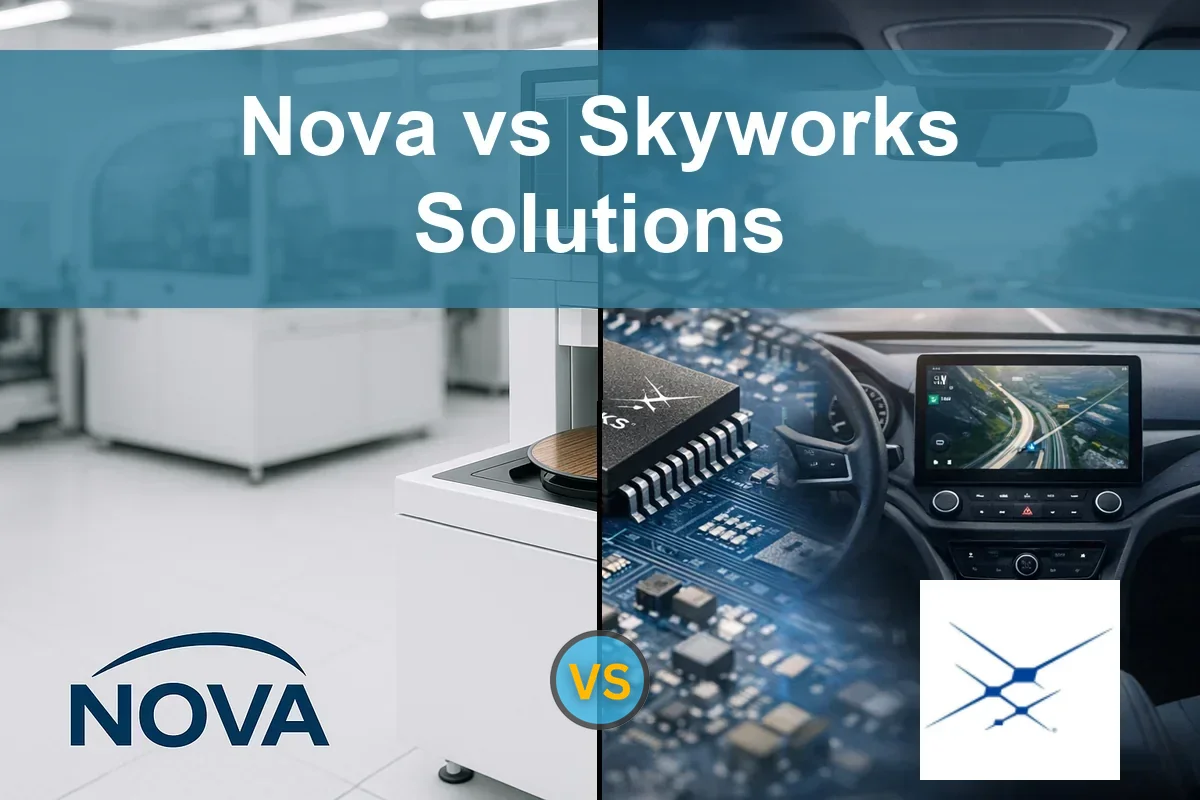
Table of contents
Companies Overview
Nova Ltd. and Skyworks Solutions, Inc. both hold significant stakes in the global semiconductor market.
Nova Ltd.: Precision Process Control Leader
Nova Ltd. specializes in process control systems for semiconductor manufacturing. It generates revenue by selling metrology platforms that measure dimensions, films, and materials during chip production. In 2026, Nova focuses on advancing metrology accuracy across lithography, etch, and deposition processes, targeting integrated circuit makers globally.
Skyworks Solutions, Inc.: Diverse Semiconductor Innovator
Skyworks Solutions designs and markets a broad portfolio of proprietary semiconductor products including amplifiers, front-end modules, and voltage regulators. Its revenue streams stem from multiple sectors like aerospace, automotive, and smartphones. In 2026, Skyworks prioritizes expanding its wireless analog system on chip offerings to capture growth in connected devices and 5G infrastructure.
Strategic Collision: Similarities & Divergences
Both companies operate in semiconductors but differ sharply in scope. Nova pursues a focused niche in process control, emphasizing precision tools for chipmakers. Skyworks embraces a diversified product mix across industries with broad applications. Their primary battleground is innovation in semiconductor technology, yet they appeal to distinct investment profiles—Nova with specialized expertise, Skyworks with scale and market breadth.
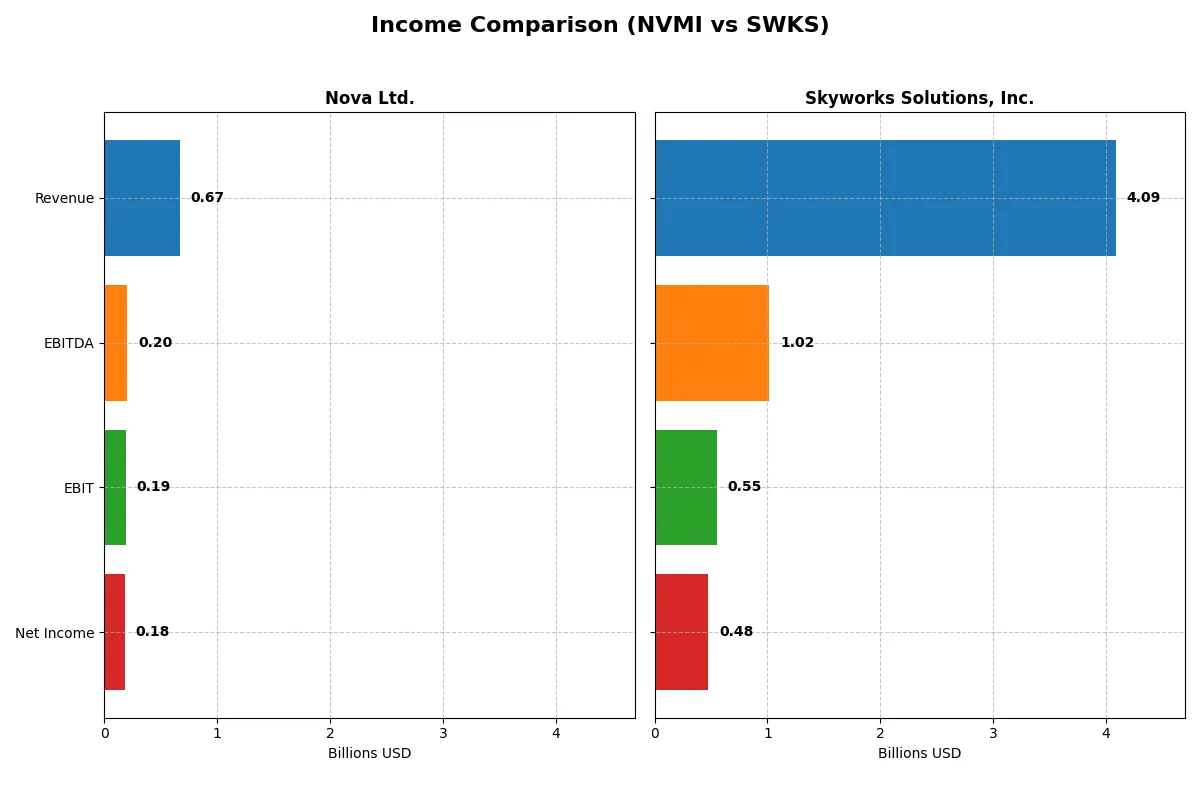
Income Statement Comparison
This data dissects the core profitability and scalability of both corporate engines to reveal who dominates the bottom line:
| Metric | Nova Ltd. (NVMI) | Skyworks Solutions, Inc. (SWKS) |
|---|---|---|
| Revenue | 672M | 4.18B |
| Cost of Revenue | 285M | 2.46B |
| Operating Expenses | 200M | 933M |
| Gross Profit | 387M | 1.72B |
| EBITDA | 205M | 1.12B |
| EBIT | 188M | 667M |
| Interest Expense | 1.6M | 31M |
| Net Income | 184.9M | 596M |
| EPS | 6.31 | 3.72 |
| Fiscal Year | 2024 | 2024 |
Income Statement Analysis: The Bottom-Line Duel
The following income statement comparison exposes which company runs a more efficient and profitable business engine through recent financial trends.
Nova Ltd. (NVMI) Analysis
Nova Ltd. exhibits robust revenue growth, climbing from $269M in 2020 to $672M in 2024, with net income soaring from $48M to $184M. Its gross margin remains healthy at 57.6%, while net margin sustains a strong 27.3%. In 2024, NVMI’s expanding margins and 30% revenue growth underscore accelerating operational efficiency and profitability momentum.
Skyworks Solutions, Inc. (SWKS) Analysis
Skyworks Solutions posted larger revenues around $4.1B in 2025 but faced a 2.2% revenue decline from the prior year. Gross margin sits at a solid 41.2%, yet net margin lags at 11.7%. The latest year reveals margin compression and a near 17% drop in EBIT, signaling challenges in sustaining earnings despite scale.
Margin Strength vs. Scale Challenges
Nova Ltd. clearly outpaces Skyworks in margin expansion and profitability growth, with net income rising 283% over five years versus Skyworks’ 68% decline. While Skyworks commands greater revenue scale, its falling margins and earnings weigh on its income statement health. Investors seeking margin resilience may find Nova’s profile more compelling.
Financial Ratios Comparison
These vital ratios act as a diagnostic tool to expose the underlying fiscal health, valuation premiums, and capital efficiency of the companies compared below:
| Ratios | Nova Ltd. (NVMI) | Skyworks Solutions, Inc. (SWKS) |
|---|---|---|
| ROE | 19.8% | 8.3% |
| ROIC | 13.4% | 6.4% |
| P/E | 31.2 | 24.9 |
| P/B | 6.18 | 2.07 |
| Current Ratio | 2.32 | 2.33 |
| Quick Ratio | 1.92 | 1.76 |
| D/E | 0.25 | 0.21 |
| Debt-to-Assets | 17.0% | 15.2% |
| Interest Coverage | 116.2 | 18.5 |
| Asset Turnover | 0.48 | 0.52 |
| Fixed Asset Turnover | 5.06 | 2.95 |
| Payout Ratio | 0 | 90.7% |
| Dividend Yield | 0% | 3.63% |
| Fiscal Year | 2024 | 2025 |
Efficiency & Valuation Duel: The Vital Signs
Financial ratios act as a company’s DNA, exposing hidden risks and revealing operational excellence crucial for investment decisions.
Nova Ltd.
Nova Ltd. posts a strong 19.8% ROE and a robust 27.3% net margin, signaling solid profitability. Its P/E of 31.2 and P/B of 6.18 suggest a stretched valuation relative to earnings and book value. The firm refrains from dividends, opting to reinvest heavily in R&D, fueling future growth potential.
Skyworks Solutions, Inc.
Skyworks shows a modest 8.3% ROE and an 11.7% net margin, reflecting moderate profitability. Its P/E of 24.95 and P/B of 2.07 indicate a fair valuation with less premium than Nova. The company pays a 3.63% dividend, balancing shareholder returns with ongoing investments in innovation.
Premium Valuation vs. Balanced Yield
Nova’s higher profitability comes with a stretched valuation, increasing risk if growth slows. Skyworks offers a more balanced risk-reward profile through dividends and reasonable multiples. Growth-focused investors may favor Nova, while income-oriented ones might prefer Skyworks’ steadier yield.
Which one offers the Superior Shareholder Reward?
I observe Nova Ltd. (NVMI) pays no dividends, reinvesting all FCF into growth and R&D. Skyworks Solutions (SWKS) offers a 2.8–3.6% dividend yield with payout ratios around 40–90%, backed by strong FCF coverage. Both execute robust buybacks; NVMI’s free cash flow per share rose to ~$7.5, while SWKS returns ~$7.2 per share. SWKS’s balanced yield and buyback mix provide steady income plus capital return. NVMI’s zero dividend signals aggressive reinvestment but higher risk. For 2026, I favor SWKS for superior, sustainable total shareholder reward.
Comparative Score Analysis: The Strategic Profile
The radar chart reveals the fundamental DNA and trade-offs of Nova Ltd. and Skyworks Solutions, Inc., highlighting where each firm excels or lags:
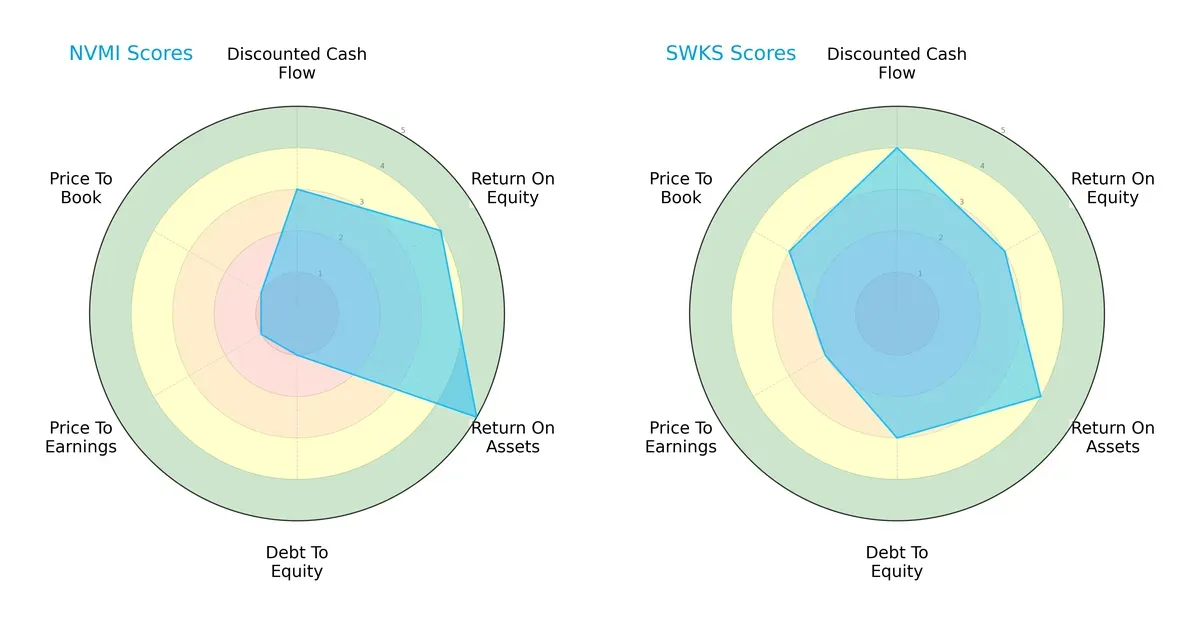
Nova Ltd. leads in asset efficiency (ROA 5 vs. 4) and equity returns (ROE 4 vs. 3), yet struggles with leverage and valuation (Debt/Equity 1 vs. 3, P/E and P/B scores at 1 versus 2-3). Skyworks shows a more balanced financial profile with stronger debt management and fairer valuation metrics, relying less on a single strength. Nova’s profile is sharper but riskier; Skyworks offers steadier fundamentals.
Bankruptcy Risk: Solvency Showdown
Nova Ltd.’s Altman Z-Score of 8.95 significantly outpaces Skyworks’ 4.34, signaling a much stronger buffer against bankruptcy in this cycle:
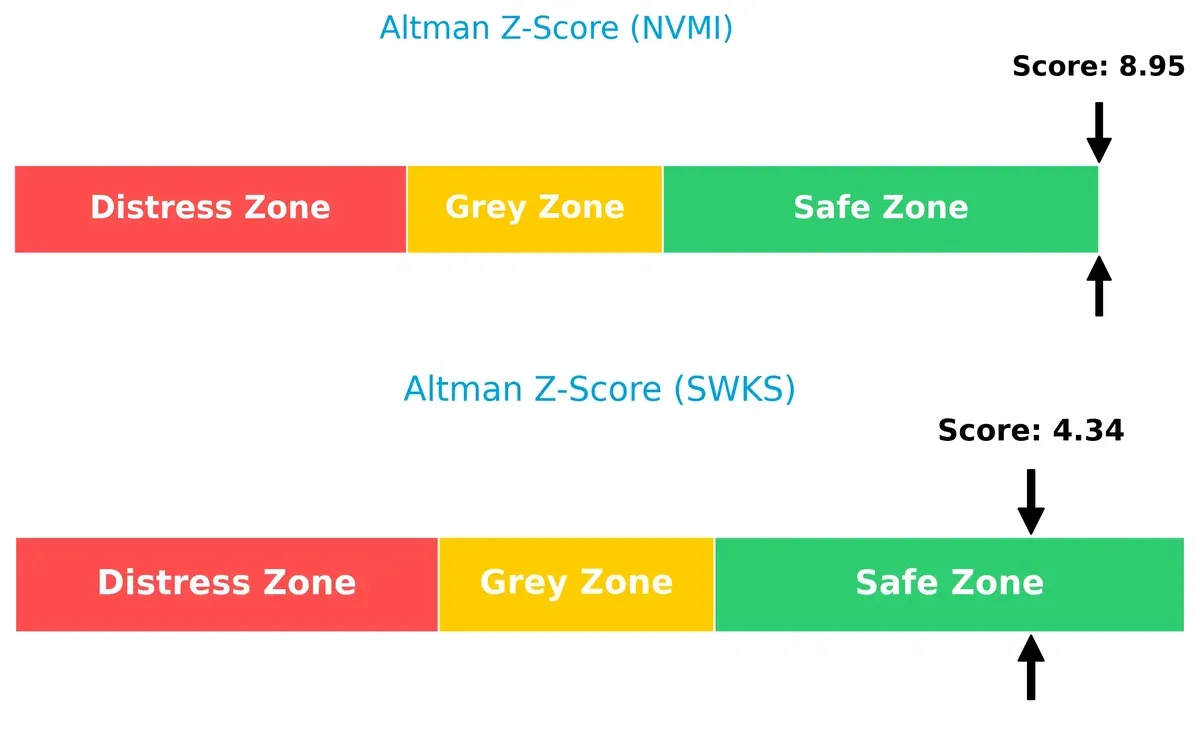
Both firms reside safely above distress thresholds, but Nova’s elevated score indicates superior financial stability and resilience amid market volatility.
Financial Health: Quality of Operations
Both companies share an identical Piotroski F-Score of 7, reflecting strong operational health and sound financial management with no immediate red flags:
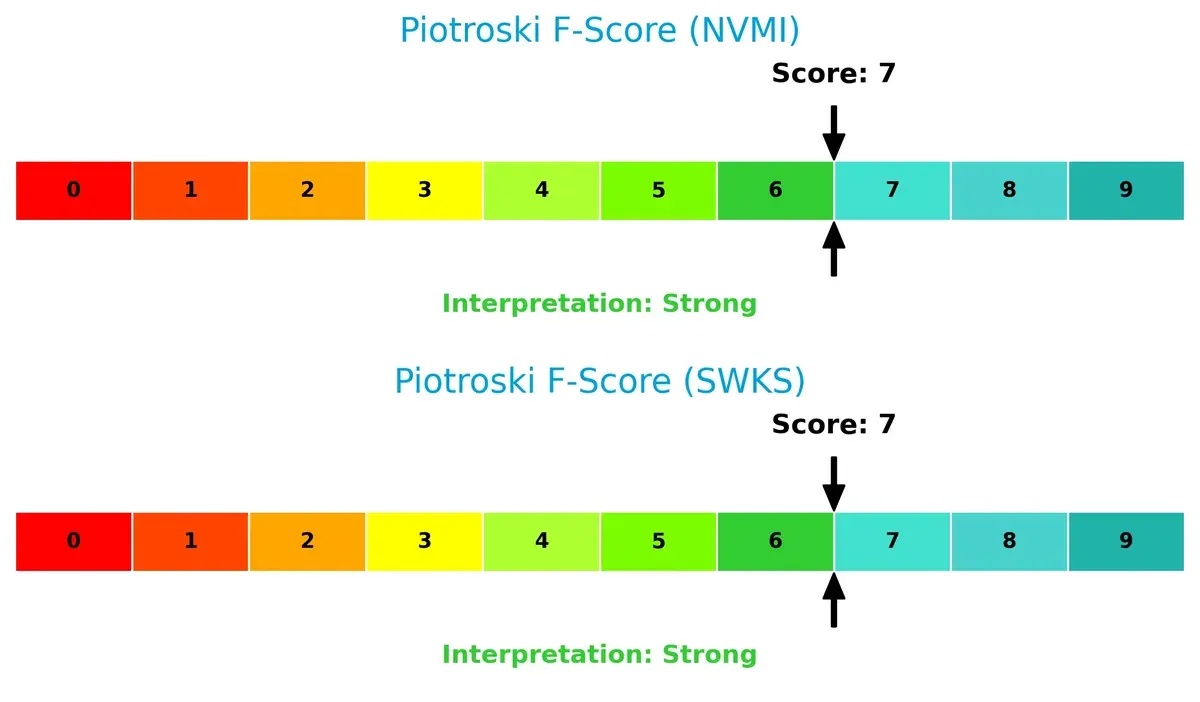
This parity suggests both firms maintain solid profitability, liquidity, and efficiency, supporting their investment appeal.
How are the two companies positioned?
This section dissects the operational DNA of Nova Ltd. and Skyworks Solutions by comparing their revenue distribution and internal strengths and weaknesses. The goal is to confront their economic moats to identify which model offers the most resilient, sustainable competitive advantage today.
Revenue Segmentation: The Strategic Mix
This comparison dissects how Nova Ltd. and Skyworks Solutions, Inc. diversify their income streams and reveals their primary sector bets:
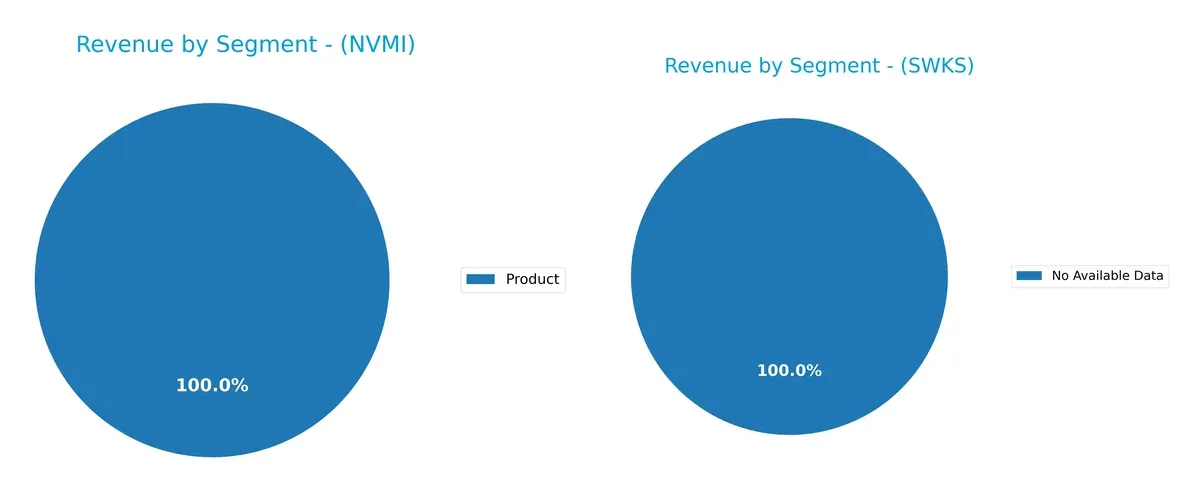
Nova Ltd. relies exclusively on a single product segment, anchoring its revenue around $538M in 2024, up from $405M in 2023. Skyworks Solutions, Inc. shows no available data, preventing segmentation analysis. Nova’s concentrated revenue signals concentration risk but also potential for focused innovation and ecosystem dominance within its niche. Without diversification, Nova must excel operationally to sustain growth amid market shifts.
Strengths and Weaknesses Comparison
This table compares the Strengths and Weaknesses of Nova Ltd. and Skyworks Solutions, Inc.:
Nova Ltd. Strengths
- High net margin at 27.33%
- Strong ROE of 19.81%
- ROIC above WACC at 13.39%
- Solid liquidity ratios above 1.9
- Low debt-to-equity ratio of 0.25
- High interest coverage at 116.2
Skyworks Solutions, Inc. Strengths
- Favorable net margin at 11.67%
- Healthy current and quick ratios above 1.7
- Low leverage with debt-to-assets at 15.2%
- Positive dividend yield at 3.63%
- Diversified global revenue with strong US and Asian presence
- Neutral asset turnover near sector average
Nova Ltd. Weaknesses
- High WACC at 12.26% exceeding ROIC
- Overvalued with P/E of 31.2 and P/B of 6.18
- Below-average asset turnover at 0.48
- No dividend yield
- Lack of geographic revenue diversification data
Skyworks Solutions, Inc. Weaknesses
- Lower ROE at 8.29% below ideal benchmark
- ROIC and WACC both neutral, less efficient capital use
- Neutral asset and fixed asset turnover ratios
- P/E and P/B ratios in neutral zone, limiting valuation upside
- Limited profitability compared to industry leaders
Nova Ltd. demonstrates strong profitability and balance sheet strength but faces valuation and capital efficiency challenges. Skyworks shows balanced financial health with global diversification but has weaker returns and asset utilization. Both companies must address their specific weaknesses to enhance long-term competitiveness.
The Moat Duel: Analyzing Competitive Defensibility
A structural moat is the only reliable shield protecting long-term profits from relentless competition and margin erosion in technology sectors:
Nova Ltd.: Precision Metrology’s Technical Edge
Nova’s moat stems from its intangible assets—highly specialized metrology technology. This yields a strong ROIC trend and margin stability, signaling growing profitability. Expanding into advanced packaging could deepen this technical moat in 2026.
Skyworks Solutions, Inc.: Scale and Market Reach Challenge
Skyworks relies on scale and diversified semiconductor products but lacks Nova’s technical specialization. Its declining ROIC and shrinking margins reflect weakening competitive positioning. New market disruptions in wireless tech pose serious risks in 2026.
Technical Specialization vs. Scale: Who Holds the Moat Advantage?
Nova’s growing ROIC and focused innovation create a deeper moat than Skyworks’ fading scale benefits. I see Nova better equipped to defend and expand its market share amid rising competition.
Which stock offers better returns?
The past year reveals stark contrasts: Nova Ltd. surged over 150%, demonstrating strong acceleration, while Skyworks Solutions, Inc. declined sharply by nearly 45%, with decelerating losses.
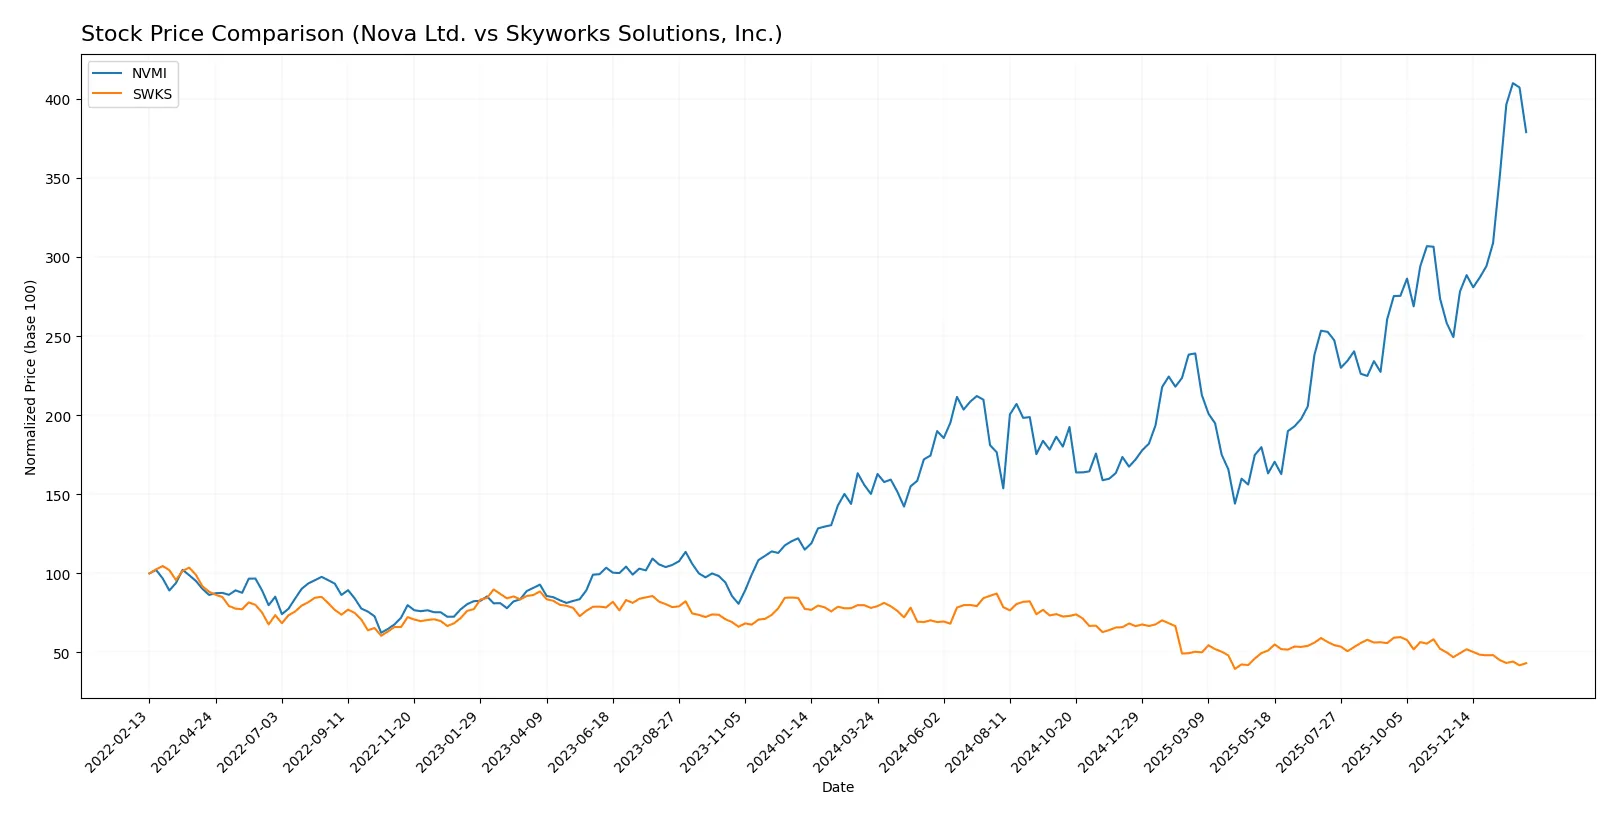
Trend Comparison
Nova Ltd. shows a bullish trend with a 152.23% price increase over 12 months, highlighted by accelerating gains and significant volatility (66.06 std dev). The stock peaked at 460.91 and bottomed at 159.92.
Skyworks Solutions, Inc. exhibits a bearish trend with a 44.63% price decline over the same period, marked by deceleration and lower volatility (16.51 std dev). Its highest price was 116.18, lowest 52.78.
Comparing both, Nova Ltd. outperformed Skyworks Solutions, Inc. decisively, delivering the highest market returns and stronger momentum throughout the last year.
Target Prices
Analysts present a mixed target consensus for Nova Ltd. and Skyworks Solutions, reflecting varied growth expectations.
| Company | Target Low | Target High | Consensus |
|---|---|---|---|
| Nova Ltd. | 335 | 500 | 408.33 |
| Skyworks Solutions, Inc. | 58 | 140 | 77.36 |
Nova Ltd.’s consensus target of 408.33 sits slightly below its current price of 423.44, suggesting limited upside. Skyworks Solutions’ 77.36 consensus target significantly exceeds its 57.83 share price, indicating stronger analyst confidence in future gains.

Don’t Let Luck Decide Your Entry Point
Optimize your entry points with our advanced ProRealTime indicators. You’ll get efficient buy signals with precise price targets for maximum performance. Start outperforming now!
How do institutions grade them?
Here is a comparison of institutional grades for Nova Ltd. and Skyworks Solutions, Inc.:
Nova Ltd. Grades
The following table summarizes recent grades from leading financial institutions for Nova Ltd.:
| Grading Company | Action | New Grade | Date |
|---|---|---|---|
| Needham | Buy | Buy | 2026-01-20 |
| B of A Securities | Maintain | Buy | 2026-01-13 |
| Jefferies | Maintain | Buy | 2025-12-15 |
| Evercore ISI Group | Maintain | Outperform | 2025-11-07 |
| Benchmark | Maintain | Buy | 2025-11-07 |
| Cantor Fitzgerald | Maintain | Overweight | 2025-06-24 |
| B of A Securities | Maintain | Buy | 2025-06-24 |
| Citigroup | Maintain | Buy | 2025-05-09 |
| Benchmark | Maintain | Buy | 2025-05-09 |
| B of A Securities | Maintain | Buy | 2025-04-16 |
Skyworks Solutions, Inc. Grades
The following table shows recent grades from reputable firms for Skyworks Solutions, Inc.:
| Grading Company | Action | New Grade | Date |
|---|---|---|---|
| Stifel | Maintain | Hold | 2026-02-04 |
| Keybanc | Maintain | Overweight | 2026-02-04 |
| JP Morgan | Maintain | Neutral | 2026-02-04 |
| Benchmark | Maintain | Hold | 2026-02-04 |
| Morgan Stanley | Maintain | Equal Weight | 2026-02-02 |
| Mizuho | Maintain | Neutral | 2026-01-26 |
| B. Riley Securities | Maintain | Neutral | 2026-01-26 |
| Susquehanna | Maintain | Neutral | 2026-01-22 |
| UBS | Maintain | Neutral | 2026-01-20 |
| Mizuho | Upgrade | Neutral | 2025-11-11 |
Which company has the best grades?
Nova Ltd. consistently receives Buy and Outperform ratings, reflecting strong institutional confidence. Skyworks Solutions, Inc. mostly earns Neutral and Hold grades, indicating more cautious views. This divergence may influence investor sentiment and portfolio positioning.
Risks specific to each company
In 2026, these categories highlight the critical pressure points and systemic threats facing Nova Ltd. and Skyworks Solutions within the semiconductor sector:
1. Market & Competition
Nova Ltd.
- Faces high competition with a volatile stock range from 154 to 507; strong niche in semiconductor process control systems.
Skyworks Solutions, Inc.
- Competes broadly in semiconductor products, with a wider market presence and lower beta, reflecting less price volatility.
2. Capital Structure & Debt
Nova Ltd.
- Low debt-to-equity ratio (0.25) signals conservative leverage; excellent interest coverage ratio (116x) reduces default risk.
Skyworks Solutions, Inc.
- Slightly lower leverage (0.21 debt-to-equity) with solid interest coverage (20x), indicating manageable debt levels.
3. Stock Volatility
Nova Ltd.
- Beta of 1.82 suggests higher stock price volatility and sensitivity to market swings.
Skyworks Solutions, Inc.
- Beta of 1.32 indicates moderate volatility, offering somewhat steadier price movements.
4. Regulatory & Legal
Nova Ltd.
- Operates in multiple countries, including China and Taiwan, exposing it to complex semiconductor export controls and IP risks.
Skyworks Solutions, Inc.
- Also global with exposure to US-China tensions but benefits from diversified product lines that mitigate regulatory impacts.
5. Supply Chain & Operations
Nova Ltd.
- Supply chain risks heightened by reliance on semiconductor manufacturing hubs in Asia amid geopolitical tensions.
Skyworks Solutions, Inc.
- Larger scale and diversified suppliers improve operational resilience but still face semiconductor material supply risks.
6. ESG & Climate Transition
Nova Ltd.
- Limited public ESG data; moderate risk given industry’s energy-intensive manufacturing processes.
Skyworks Solutions, Inc.
- More visible ESG efforts due to size; still vulnerable to regulatory climate policies affecting semiconductor production.
7. Geopolitical Exposure
Nova Ltd.
- High exposure to Middle East and Asia-Pacific geopolitical risks, potentially disrupting operations.
Skyworks Solutions, Inc.
- US headquartered with global operations; benefits from US tech policy support but impacted by China-related restrictions.
Which company shows a better risk-adjusted profile?
Nova Ltd. grapples with higher stock volatility and geopolitical risks, but boasts superior financial stability and capital structure. Skyworks Solutions offers more moderate volatility and diversified operations but weaker profitability metrics. Nova’s exceptional interest coverage and strong Altman Z-Score (8.95) place it in a safer financial zone. Meanwhile, Skyworks’ Altman Z-Score of 4.34 is also safe but signals greater caution. Overall, Nova demonstrates a better risk-adjusted profile due to its strong balance sheet and liquidity despite higher market risks.
Final Verdict: Which stock to choose?
Nova Ltd. (NVMI) excels as a high-efficiency growth engine, delivering rapidly improving returns and robust cash flow generation. Its rising profitability amid a challenging cost of capital environment signals a scaling business. A point of vigilance remains its high valuation multiples, which could pressure returns if growth slows. It suits an aggressive growth portfolio willing to embrace volatility for expansion.
Skyworks Solutions, Inc. (SWKS) offers a strategic moat grounded in steady recurring revenue and strong cash flow yield. Its defensive balance sheet and dividend yield provide stability unmatched by Nova. However, its declining profitability and shrinking returns suggest caution. It aligns well with GARP investors seeking moderate growth with reasonable risk control.
If you prioritize aggressive expansion and are comfortable with valuation risk, Nova outshines with accelerating earnings and cash flow momentum. However, if you seek better stability and income with a margin of safety, Skyworks offers a safer harbor despite its recent profitability challenges. Each fits a distinct investor profile balancing growth versus capital preservation.
Disclaimer: Investment carries a risk of loss of initial capital. The past performance is not a reliable indicator of future results. Be sure to understand risks before making an investment decision.
Go Further
I encourage you to read the complete analyses of Nova Ltd. and Skyworks Solutions, Inc. to enhance your investment decisions: