In the fast-evolving semiconductor industry, Qnity Electronics, Inc. and Nova Ltd. stand out as key players driving innovation in chip manufacturing technologies. Both companies specialize in advanced electronic materials and process control systems, targeting overlapping markets with cutting-edge solutions. This article will analyze their strengths, strategies, and market positions to help you identify which company presents the most compelling investment opportunity in 2026.
Table of contents
Companies Overview
I will begin the comparison between Qnity Electronics, Inc. and Nova Ltd. by providing an overview of these two companies and their main differences.
Qnity Electronics, Inc. Overview
Qnity Electronics, Inc. focuses on providing electronic solutions and advanced materials used in semiconductor chip manufacturing. Formerly known as Novus SpinCo 1, Inc., the company rebranded in April 2025. Based in Wilmington, Delaware, Qnity operates within the technology sector and trades on the NYSE, positioning itself as a key player in the semiconductor materials industry.
Nova Ltd. Overview
Nova Ltd. designs and produces process control systems for semiconductor manufacturing, serving a global clientele including logic, foundry, and memory sectors. Headquartered in Rehovot, Israel, the company operates internationally and is listed on NASDAQ. Founded in 1993, Nova offers metrology platforms essential for various semiconductor production steps, supporting advanced packaging and process equipment manufacturers.
Key similarities and differences
Both Qnity and Nova operate in the semiconductor industry with a technology focus, but their business models differ. Qnity specializes in electronic materials for chip manufacturing, while Nova provides process control and metrology systems. Qnity is a newer NYSE-listed company, whereas Nova has a longer history and broader international presence, trading on NASDAQ with a substantial workforce of over 1,100 employees.
Income Statement Comparison
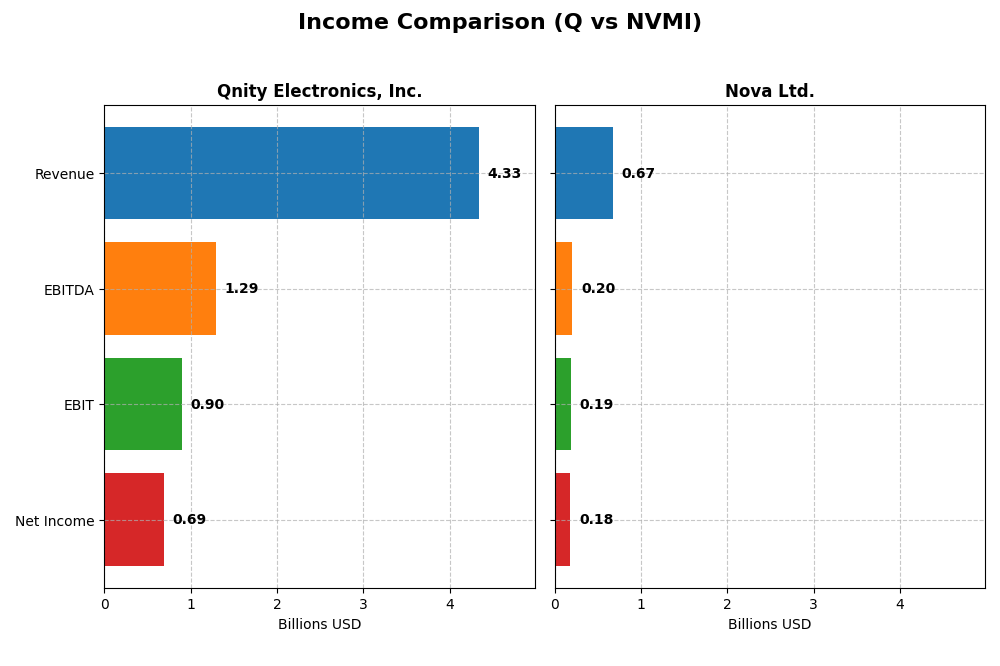
The table below compares the key income statement metrics of Qnity Electronics, Inc. and Nova Ltd. for the fiscal year 2024, reflecting their financial performance in the semiconductor industry.
| Metric | Qnity Electronics, Inc. | Nova Ltd. |
|---|---|---|
| Market Cap | 19.5B | 12.9B |
| Revenue | 4.34B | 672M |
| EBITDA | 1.29B | 205M |
| EBIT | 898M | 188M |
| Net Income | 693M | 185M |
| EPS | 3.31 | 6.31 |
| Fiscal Year | 2024 | 2024 |
Income Statement Interpretations
Qnity Electronics, Inc.
Qnity Electronics experienced a revenue decline of 8.83% from 2022 to 2024, with net income also falling by 10.47% over the same period. Margins showed mixed results; gross and EBIT margins remained favorable, but net margin slightly decreased. The 2024 fiscal year saw revenue growth slow to 7.43%, yet net margin and EPS improved significantly, indicating operational efficiency gains despite the overall downward trend.
Nova Ltd.
Nova Ltd. reported strong revenue growth of 149.59% from 2020 to 2024, alongside an impressive 283.58% increase in net income. Margins remained robust, with gross, EBIT, and net margins all rated favorable. In 2024, revenue grew by nearly 30%, supported by a 34.35% rise in EPS, while net margin growth was moderate but stable, reflecting sustained profitability and operational strength expanding over the period.
Which one has the stronger fundamentals?
Nova Ltd. demonstrates stronger fundamentals, with consistent and significant growth in revenue, net income, and margins over the overall period, supported by favorable operational efficiency and profitability metrics. Qnity Electronics, while showing recent margin improvements and strong EPS growth in 2024, faces an overall decline in revenue and net income across the period, indicating less robust financial momentum compared to Nova.
Financial Ratios Comparison
The table below presents the latest key financial ratios for Qnity Electronics, Inc. and Nova Ltd., based on their 2024 fiscal year data to facilitate a clear comparison.
| Ratios | Qnity Electronics, Inc. (Q) | Nova Ltd. (NVMI) |
|---|---|---|
| ROE | 6.51% | 19.81% |
| ROIC | 5.92% | 13.39% |
| P/E | 28.8 | 31.2 |
| P/B | 1.88 | 6.18 |
| Current Ratio | 1.77 | 2.32 |
| Quick Ratio | 1.06 | 1.92 |
| D/E | 0.018 | 0.254 |
| Debt-to-Assets | 1.56% | 16.98% |
| Interest Coverage | 3.03 | 116.20 |
| Asset Turnover | 0.35 | 0.48 |
| Fixed Asset Turnover | 2.59 | 5.06 |
| Payout Ratio | 0 | 0 |
| Dividend Yield | 0 | 0 |
Interpretation of the Ratios
Qnity Electronics, Inc.
Qnity Electronics shows a slightly favorable overall ratio profile with strengths in net margin (15.99%) and liquidity (current ratio 1.77, quick ratio 1.06). However, its return on equity at 6.51% and asset turnover are weak points, with a high price-to-earnings ratio of 28.8 suggesting valuation concerns. The company pays a modest dividend of $0.06, but the yield is negligible, indicating limited income returns.
Nova Ltd.
Nova Ltd. exhibits a favorable ratio set, with strong profitability metrics such as a net margin of 27.33%, ROE at 19.81%, and ROIC of 13.39%. Liquidity ratios are solid, and interest coverage is exceptionally high at 116.2, reflecting low risk on debt servicing. However, valuation metrics like a P/E of 31.2 and P/B of 6.18 are less attractive. Nova does not pay dividends, likely due to reinvestment in growth and R&D.
Which one has the best ratios?
Nova Ltd. presents a more favorable ratio profile overall, with higher profitability and stronger coverage ratios, despite less attractive valuation multiples. Qnity Electronics has some liquidity strength but suffers from weaker returns and a less compelling dividend yield. The choice depends on investor preference for growth versus income and valuation sensitivity.
Strategic Positioning
This section compares the strategic positioning of Qnity Electronics, Inc. and Nova Ltd. in terms of market position, key segments, and exposure to technological disruption:
Qnity Electronics, Inc.
- Newer entrant with $19.5B market cap, facing typical sector competition
- Focus on electronic solutions and materials for semiconductor manufacturing
- No explicit information on disruption exposure provided
Nova Ltd.
- Established with $12.9B market cap, operating globally in multiple semiconductor hubs
- Specializes in process control systems and metrology platforms for semiconductor production
- Exposure to advanced semiconductor process control technologies and evolving manufacturing steps
Qnity Electronics, Inc. vs Nova Ltd. Positioning
Qnity has a concentrated focus on electronic materials while Nova exhibits a diversified product portfolio across various semiconductor process controls. Nova’s global presence and product breadth contrast with Qnity’s newer market entry and specialized scope.
Which has the best competitive advantage?
Nova Ltd. shows a slightly favorable moat with growing ROIC, indicating improving profitability and efficient capital use. Qnity remains neutral with stable but no clear competitive advantage yet evident.
Stock Comparison
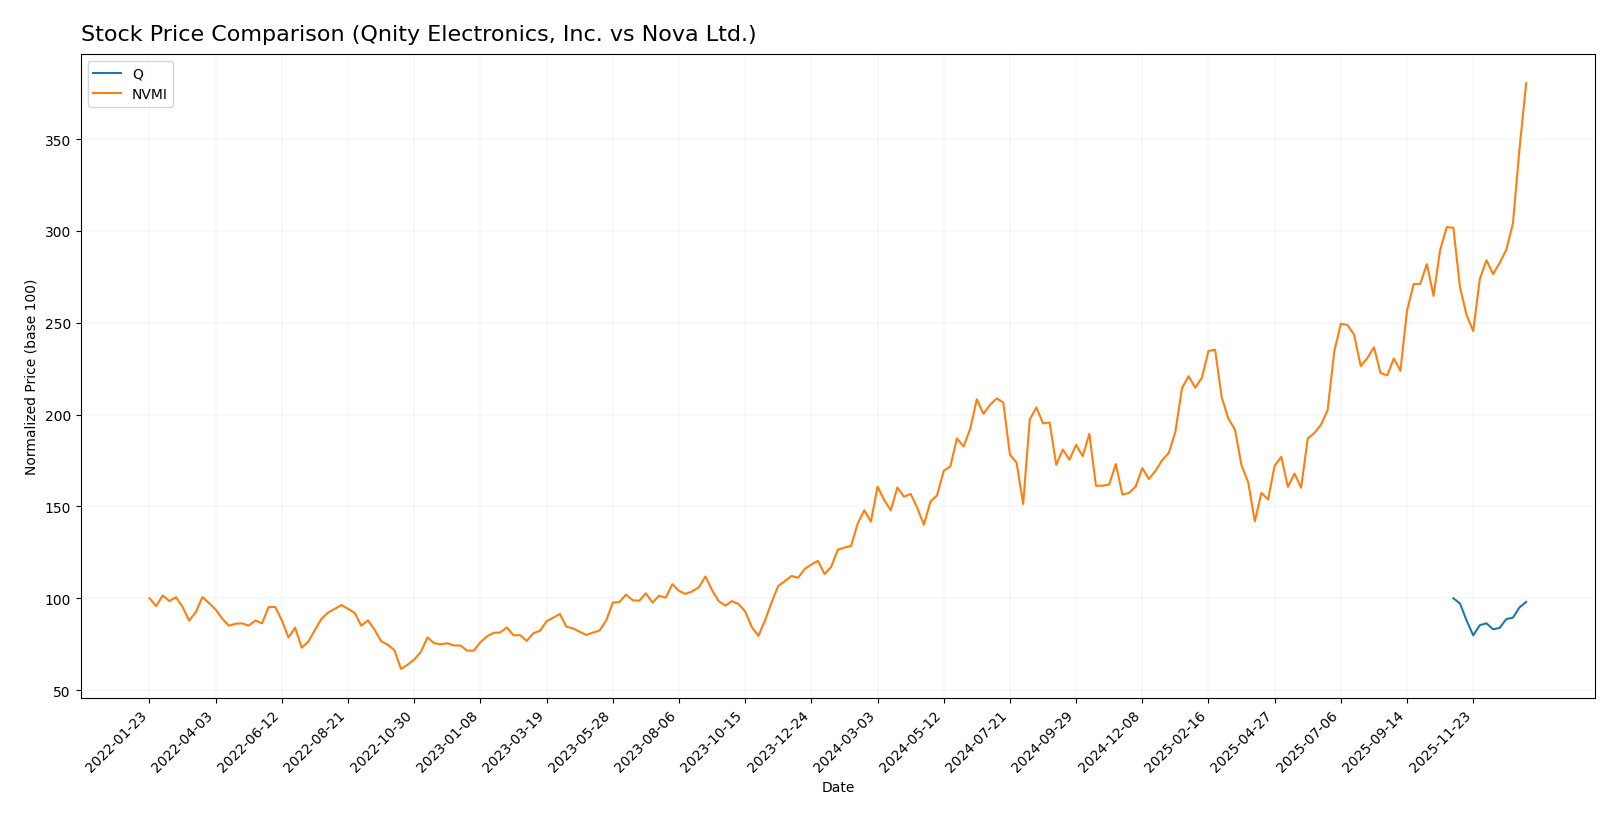
The past year has seen contrasting stock price movements for Qnity Electronics, Inc. and Nova Ltd., with Qnity showing a slight decline and Nova demonstrating a strong upward momentum, reflecting divergent trading dynamics.
Trend Analysis
Qnity Electronics, Inc. experienced a modest bearish trend over the past 12 months with a -1.98% price change, stable acceleration, and a price range between 75.8 and 95.0. Volatility measured by a 5.94 standard deviation remained moderate.
Nova Ltd. exhibited a pronounced bullish trend with a 168.54% increase in stock price over the same period, accelerating upward. The price fluctuated widely between 159.92 and 434.55, with high volatility at a 55.86 standard deviation.
Comparing both, Nova Ltd. delivered significantly higher market performance than Qnity Electronics, Inc., with a strong positive trend versus Qnity’s near-neutral bearish movement.
Target Prices
The current analyst consensus presents a bullish outlook for both Qnity Electronics, Inc. and Nova Ltd.
| Company | Target High | Target Low | Consensus |
|---|---|---|---|
| Qnity Electronics, Inc. | 117 | 92 | 105.89 |
| Nova Ltd. | 390 | 335 | 362.5 |
Analysts expect Qnity Electronics shares to rise modestly above the current price of $93.12, while Nova Ltd.’s stock, now at $434.55, shows a target consensus indicating a potential correction. This suggests cautious optimism with risk management advised.
Analyst Opinions Comparison
This section compares analysts’ ratings and grades for Qnity Electronics, Inc. (Q) and Nova Ltd. (NVMI):
Rating Comparison
Q Rating
- Rating: B+ indicating a very favorable overall evaluation.
- Discounted Cash Flow Score: 4, a favorable score suggesting good valuation.
- ROE Score: 3, moderate efficiency in generating profit from equity.
- ROA Score: 4, favorable use of assets to generate earnings.
- Debt To Equity Score: 3, moderate financial risk with balanced debt levels.
- Overall Score: 3, moderate overall financial strength.
NVMI Rating
- Rating: B- also marked as very favorable overall.
- Discounted Cash Flow Score: 3, moderate score indicating average valuation.
- ROE Score: 4, favorable efficiency in profit generation from equity.
- ROA Score: 5, very favorable asset utilization to generate earnings.
- Debt To Equity Score: 1, very unfavorable, indicating high financial risk.
- Overall Score: 3, moderate overall financial strength.
Which one is the best rated?
Based strictly on the data, Q has a higher rating (B+) and better debt-to-equity score, while NVMI shows stronger ROE and ROA scores but has significantly higher financial risk. Both hold a moderate overall score of 3.
Scores Comparison
Here is a comparison of the available company scores for investors to consider:
Q Scores
- Altman Z-Score: Not available
- Piotroski Score: Not available
NVMI Scores
- Altman Z-Score: 7.76, indicating a safe zone
- Piotroski Score: 7, indicating strong financials
Which company has the best scores?
Based on the provided data, only NVMI has available scores, showing a very strong Altman Z-Score and a strong Piotroski Score. Q’s scores are not provided, so no direct comparison is possible.
Grades Comparison
The following is a comparison of the latest available grades from reputable grading companies for both Qnity Electronics, Inc. and Nova Ltd.:
Qnity Electronics, Inc. Grades
This table summarizes recent grades assigned by major financial institutions for Qnity Electronics, Inc.
| Grading Company | Action | New Grade | Date |
|---|---|---|---|
| RBC Capital | Maintain | Outperform | 2025-11-25 |
| Mizuho | Maintain | Outperform | 2025-11-20 |
Qnity Electronics has consistently received “Outperform” grades, reflecting a positive rating trend from two recognized institutions.
Nova Ltd. Grades
This table presents the latest grades issued by established grading companies for Nova Ltd.
| Grading Company | Action | New Grade | Date |
|---|---|---|---|
| B of A Securities | Maintain | Buy | 2026-01-13 |
| Jefferies | Maintain | Buy | 2025-12-15 |
| Evercore ISI Group | Maintain | Outperform | 2025-11-07 |
| Benchmark | Maintain | Buy | 2025-11-07 |
| Cantor Fitzgerald | Maintain | Overweight | 2025-06-24 |
| B of A Securities | Maintain | Buy | 2025-06-24 |
| Benchmark | Maintain | Buy | 2025-05-09 |
| Citigroup | Maintain | Buy | 2025-05-09 |
| B of A Securities | Maintain | Buy | 2025-04-16 |
| Cantor Fitzgerald | Maintain | Overweight | 2025-03-14 |
Nova Ltd. shows a strong and consistent pattern of “Buy” and “Outperform” ratings from multiple credible firms, indicating sustained confidence.
Which company has the best grades?
Nova Ltd. has received a larger number of buy and outperform ratings compared to Qnity Electronics, which has fewer but consistent outperform grades. This broader endorsement by multiple firms may translate to higher investor confidence and perceived potential.
Strengths and Weaknesses
The table below summarizes the key strengths and weaknesses of Qnity Electronics, Inc. (Q) and Nova Ltd. (NVMI) based on their recent financial and operational data.
| Criterion | Qnity Electronics, Inc. (Q) | Nova Ltd. (NVMI) |
|---|---|---|
| Diversification | Limited product segmentation | Focused product line with strong revenue growth (538M in 2024) |
| Profitability | Moderate net margin (16%), neutral ROIC | High net margin (27%), favorable ROIC (13.4%) |
| Innovation | Stable but no clear competitive advantage | Growing ROIC indicating improving innovation and efficiency |
| Global presence | Stable but no major competitive moat | Slightly favorable moat with expanding profitability |
| Market Share | Stable but value shedding company | Growing profitability suggests increasing market share |
Key takeaways: Nova Ltd. shows stronger profitability, improving efficiency, and revenue growth, indicating a more favorable investment profile. Qnity Electronics remains stable but lacks a clear competitive advantage and is currently shedding value, warranting caution.
Risk Analysis
Below is a risk comparison table for Qnity Electronics, Inc. (Q) and Nova Ltd. (NVMI) based on the most recent information from 2024 and 2025.
| Metric | Qnity Electronics, Inc. (Q) | Nova Ltd. (NVMI) |
|---|---|---|
| Market Risk | Moderate (Beta 0, stable NYSE listing) | High (Beta 1.83, NASDAQ volatility) |
| Debt level | Very Low (Debt/Equity 0.02, favorable) | Moderate (Debt/Equity 0.25, manageable) |
| Regulatory Risk | Moderate (US-based, semiconductor sector) | Elevated (Operations in Israel, Taiwan, China) |
| Operational Risk | Moderate (Newly rebranded, growth phase) | Moderate (Established, diversified geography) |
| Environmental Risk | Low (Semiconductor materials focus) | Moderate (Advanced manufacturing processes) |
| Geopolitical Risk | Low (US domestic focus) | High (Exposure to geopolitical tensions in Asia) |
The most impactful risks are geopolitical for Nova Ltd. due to its multinational exposure, and market risk for Nova given its higher beta. Qnity’s low debt and stable regulatory environment reduce its financial risk, but its status as a newer public company introduces operational uncertainty. Investors should weigh geopolitical tensions carefully when considering Nova Ltd.
Which Stock to Choose?
Qnity Electronics, Inc. (Q) shows a stable income profile with favorable gross and EBIT margins, and a net margin of 15.99%. Its financial ratios are slightly favorable overall, supported by low debt (net debt to EBITDA at 0.02) and a strong current ratio of 1.77. However, its return on equity is modest at 6.51%, and the company’s ROIC slightly underperforms its WACC, indicating neutral value creation. The rating stands at a very favorable B+.
Nova Ltd. (NVMI) exhibits robust income growth, with a 29.83% revenue increase last year and a strong net margin of 27.33%. Financial ratios are mostly favorable, including a high return on equity of 19.81%, though its debt levels are higher (net debt to EBITDA 0.38) and valuation ratios are less attractive. NVMI’s ROIC significantly exceeds its WACC, showing value creation and an improving profitability trend. The company holds a very favorable B- rating.
Investors prioritizing growth and strong profitability might find Nova Ltd. appealing due to its favorable income growth, robust returns, and improving economic moat. Conversely, those seeking stability and lower leverage could view Qnity Electronics as a slightly more cautious option given its neutral value creation and conservative debt profile. The ratings and financial evaluations suggest different profiles may prefer one over the other.
Disclaimer: Investment carries a risk of loss of initial capital. The past performance is not a reliable indicator of future results. Be sure to understand risks before making an investment decision.
Go Further
I encourage you to read the complete analyses of Qnity Electronics, Inc. and Nova Ltd. to enhance your investment decisions: