In the dynamic semiconductor industry, ON Semiconductor Corporation and Nova Ltd. stand out with distinct but complementary innovation strategies. ON Semiconductor focuses on intelligent power and sensing solutions, powering electric vehicles and sustainable energy, while Nova Ltd. specializes in advanced metrology systems critical for semiconductor manufacturing precision. Both companies operate globally and influence key technology sectors. In this article, I will help you determine which company presents the most compelling investment opportunity today.
Table of contents
Companies Overview
I will begin the comparison between ON Semiconductor Corporation and Nova Ltd. by providing an overview of these two companies and their main differences.
ON Semiconductor Corporation Overview
ON Semiconductor Corporation focuses on providing intelligent sensing and power solutions globally, mainly targeting automotive electrification, fast-charging systems, and sustainable energy applications. The company operates in three segments: Power Solutions, Advanced Solutions, and Intelligent Sensing. It offers a broad portfolio of analog and mixed-signal semiconductor products designed for various end-markets, emphasizing power switching, signal conditioning, and image sensor technologies.
Nova Ltd. Overview
Nova Ltd. specializes in the design, development, and production of process control systems for semiconductor manufacturing. Its products include metrology platforms for dimensional, film, and chemical measurements used in critical semiconductor fabrication steps like lithography and etch. Serving integrated circuit manufacturers worldwide, Nova’s focus spans logic, memory, and foundry sectors, supporting process equipment manufacturers with advanced metrology solutions.
Key similarities and differences
Both ON Semiconductor and Nova operate in the semiconductor industry and serve technology markets, but their business models differ significantly. ON Semiconductor offers a wide range of semiconductor components and power solutions for multiple applications, while Nova concentrates on metrology and process control systems for semiconductor manufacturing. ON is substantially larger in scale, with over 26K employees and a $24.7B market cap, whereas Nova employs around 1.2K people with a $12.9B market cap, reflecting their distinct market focuses and operational scopes.
Income Statement Comparison
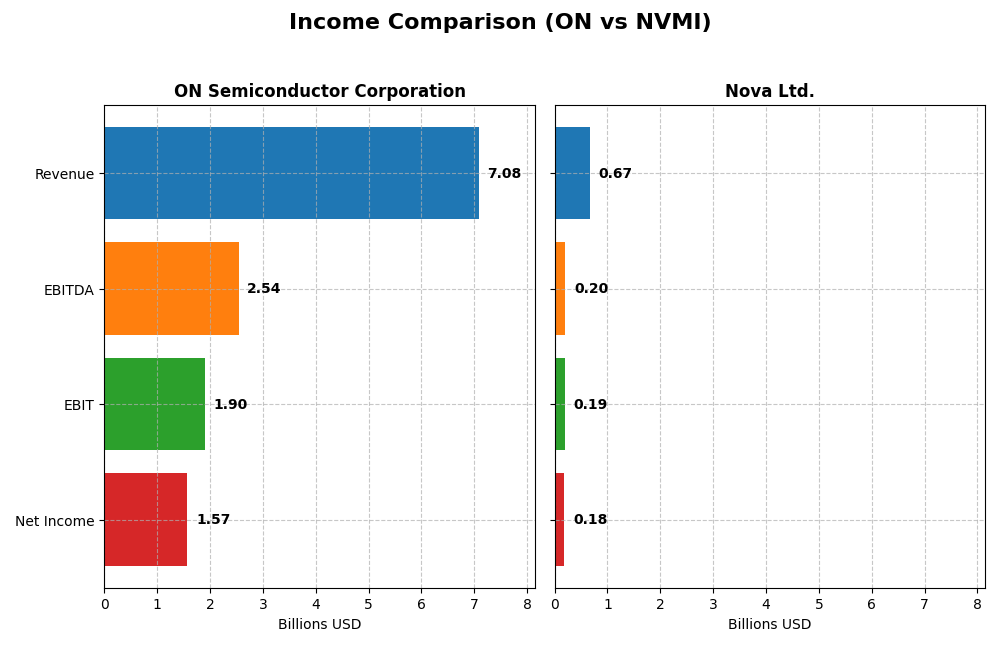
This table compares key income statement metrics for ON Semiconductor Corporation and Nova Ltd. for the fiscal year 2024, providing a snapshot of their financial performance.
| Metric | ON Semiconductor Corporation | Nova Ltd. |
|---|---|---|
| Market Cap | 24.65B | 12.89B |
| Revenue | 7.08B | 672M |
| EBITDA | 2.54B | 205M |
| EBIT | 1.90B | 188M |
| Net Income | 1.57B | 184.9M |
| EPS | 3.68 | 6.31 |
| Fiscal Year | 2024 | 2024 |
Income Statement Interpretations
ON Semiconductor Corporation
ON Semiconductor showed strong revenue growth of 35% from 2020 to 2024, with net income surging over 570% during this period. Margins remain favorable, with a 45.41% gross margin and a 22.21% net margin in 2024. However, the most recent year saw a 14% revenue decline and a 16% net margin contraction, indicating a slowdown in growth and profitability.
Nova Ltd.
Nova Ltd. experienced robust revenue growth of nearly 150% and net income growth of 284% from 2020 to 2024. The company maintains high margins, with a 57.57% gross margin and 27.33% net margin in 2024. Recent results reflect positive momentum, with a 30% increase in revenue and a 34% rise in EPS, while net margin growth was stable, showing resilience in profitability.
Which one has the stronger fundamentals?
Both companies demonstrate favorable income statement metrics and significant growth over five years. Nova Ltd. exhibits more consistent annual improvements with nearly 93% favorable income statement evaluations and strong margin stability. ON Semiconductor, despite solid long-term growth and good margins, faced recent declines in revenue and profitability, resulting in a more mixed evaluation.
Financial Ratios Comparison
The table below presents the most recent financial ratios for ON Semiconductor Corporation and Nova Ltd., providing a side-by-side comparison of key performance and financial health indicators for the fiscal year 2024.
| Ratios | ON Semiconductor Corporation | Nova Ltd. |
|---|---|---|
| ROE | 17.88% | 19.81% |
| ROIC | 11.88% | 13.39% |
| P/E | 17.13 | 31.20 |
| P/B | 3.06 | 6.18 |
| Current Ratio | 5.06 | 2.32 |
| Quick Ratio | 3.38 | 1.92 |
| D/E (Debt-to-Equity) | 0.38 | 0.25 |
| Debt-to-Assets | 23.90% | 16.98% |
| Interest Coverage | 28.37 | 116.20 |
| Asset Turnover | 0.50 | 0.48 |
| Fixed Asset Turnover | 1.61 | 5.06 |
| Payout Ratio | 0 | 0 |
| Dividend Yield | 0 | 0 |
Interpretation of the Ratios
ON Semiconductor Corporation
ON Semiconductor shows a balanced ratio profile with favorable net margin (22.21%) and solid returns on equity (17.88%) and invested capital (11.88%). However, elevated current ratio (5.06) and price-to-book (3.06) ratios raise caution. The company does not pay dividends, likely focusing on reinvestment and growth strategies without share buybacks, reflecting no immediate shareholder returns via dividends.
Nova Ltd.
Nova Ltd. exhibits strong profitability with a 27.33% net margin and robust returns on equity (19.81%) and invested capital (13.39%). Its liquidity and debt ratios are favorable, though high price-to-earnings (31.2) and price-to-book (6.18) suggest premium valuation. Like ON Semiconductor, Nova Ltd. does not distribute dividends, implying emphasis on reinvestment or growth initiatives over direct shareholder payouts.
Which one has the best ratios?
Nova Ltd. holds a more favorable overall ratio profile, with 64.29% favorable metrics compared to ON Semiconductor’s 50%, despite higher valuation multiples and cost of capital. ON Semiconductor benefits from stronger liquidity and moderate leverage but faces more unfavorable ratios, leading to a slightly favorable overall assessment versus Nova’s favorable standing.
Strategic Positioning
This section compares the strategic positioning of ON Semiconductor Corporation (ON) and Nova Ltd. (NVMI) across Market position, Key segments, and Exposure to technological disruption:
ON Semiconductor Corporation (ON)
- Large market cap $24.7B with significant competitive pressure in semiconductors.
- Diversified segments: Power Solutions, Analog Solutions, Intelligent Sensing.
- Exposure to disruption through analog, mixed-signal, and sensing technology.
Nova Ltd. (NVMI)
- Smaller $12.9B market cap, focused niche with moderate competitive pressure.
- Single segment focused on metrology platforms for semiconductor manufacturing.
- Exposure mainly in process control systems for semiconductor fabrication.
ON vs NVMI Positioning
ON’s diversified approach spans multiple semiconductor product groups providing broad market exposure, while NVMI concentrates on specialized metrology systems, creating a more focused but narrower business model. ON faces broader competitive challenges; NVMI relies on niche expertise.
Which has the best competitive advantage?
Both companies show slightly favorable moat status with growing ROIC trends but currently shed value versus WACC. Neither has demonstrated a clear sustainable competitive advantage yet, though profitability is improving for both.
Stock Comparison
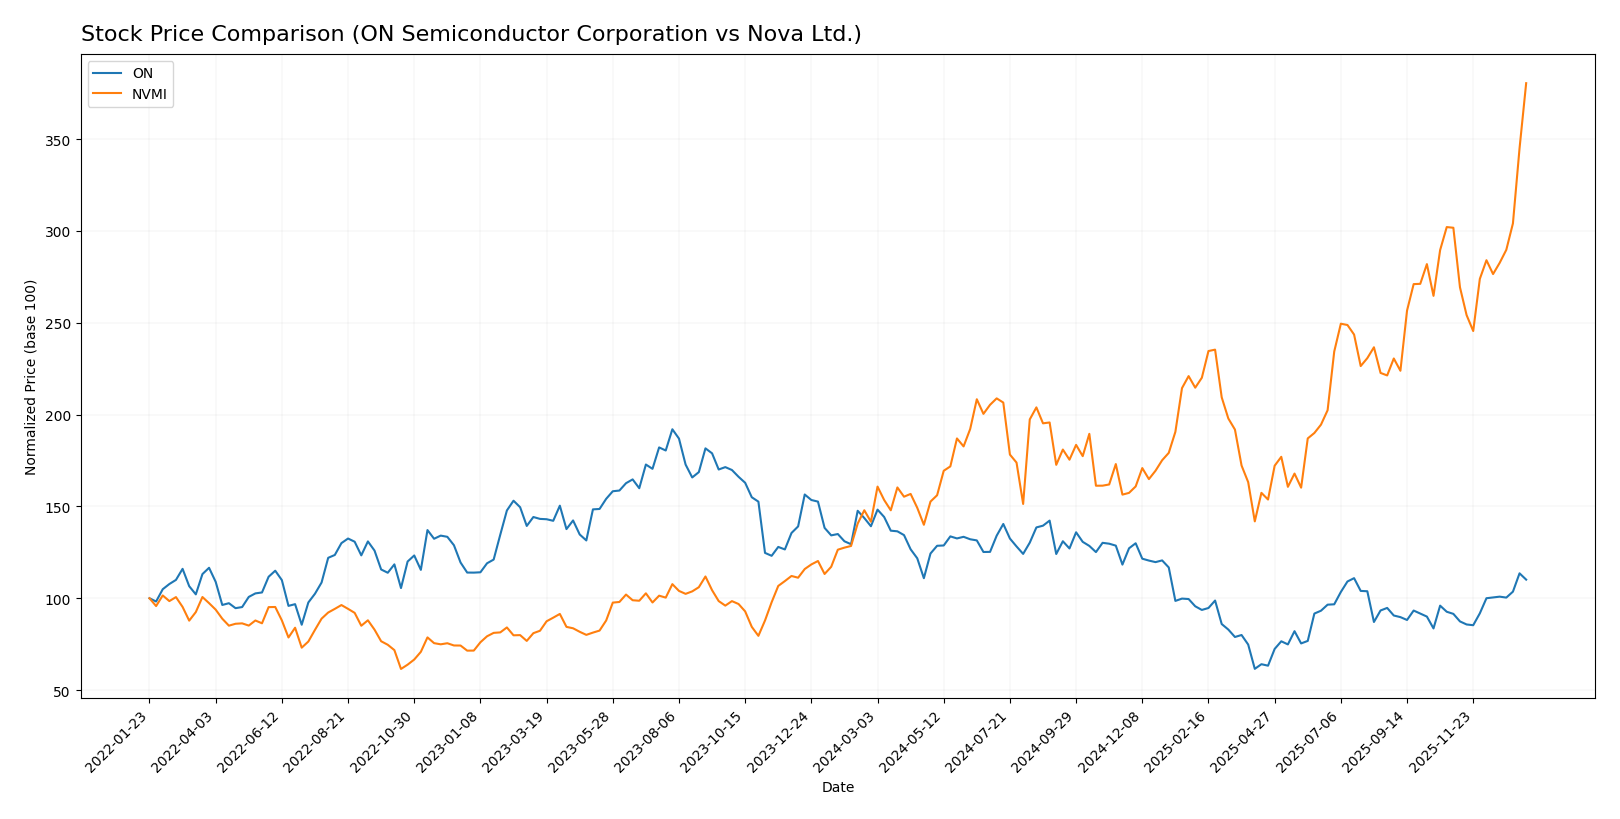
The stock price chart highlights distinct trading dynamics over the past year, with ON Semiconductor Corporation showing a significant bearish trend and Nova Ltd. demonstrating a strong bullish trajectory, both marked by notable price fluctuations and changing buyer-seller balances.
Trend Analysis
ON Semiconductor Corporation’s stock exhibited a bearish trend over the past 12 months, with a price decline of -20.88%, accelerating downward from a high of 81.14 to a low of 33.7, amid a volatility level of 11.97.
Nova Ltd. showed a strong bullish trend with a 168.54% price increase over the past year, accelerating sharply to a peak of 434.55, despite high volatility measured at 55.86, reflecting substantial upward momentum.
Comparing both stocks, Nova Ltd. delivered the highest market performance with a robust positive return, contrasting with ON Semiconductor’s substantial decline in value over the same period.
Target Prices
Analysts present a clear consensus on target prices for ON Semiconductor Corporation and Nova Ltd., indicating defined expectations for their stock performance.
| Company | Target High | Target Low | Consensus |
|---|---|---|---|
| ON Semiconductor Corporation | 64 | 51 | 58.33 |
| Nova Ltd. | 390 | 335 | 362.5 |
The consensus target for ON Semiconductor is slightly below its current price of $60.28, suggesting moderate upside potential or some risk of downside. Nova Ltd.’s consensus target is well below its current price of $434.55, indicating a potential overvaluation or expected correction.
Analyst Opinions Comparison
This section compares analysts’ ratings and grades for ON Semiconductor Corporation and Nova Ltd.:
Rating Comparison
ON Rating
- Rating: B- with a very favorable status for investors.
- Discounted Cash Flow Score: Moderate at 3, indicating average valuation.
- ROE Score: Moderate at 2, showing average efficiency generating shareholder profit.
- ROA Score: Moderate at 3, reflecting average asset utilization effectiveness.
- Debt To Equity Score: Moderate at 2, suggesting balanced financial risk.
- Overall Score: Moderate at 2, representing average financial standing.
NVMI Rating
- Rating: B- with a very favorable status for investors.
- Discounted Cash Flow Score: Moderate at 3, indicating average valuation.
- ROE Score: Favorable at 4, indicating higher efficiency generating shareholder profit.
- ROA Score: Very favorable at 5, showing strong utilization of assets.
- Debt To Equity Score: Very unfavorable at 1, indicating high financial risk.
- Overall Score: Moderate at 3, representing slightly better financial standing.
Which one is the best rated?
Based strictly on the provided data, NVMI has higher ROE and ROA scores and a better overall score than ON, despite a less favorable debt-to-equity score. Both share the same rating grade B-.
Scores Comparison
Here is a comparison of the Altman Z-Score and Piotroski Score for ON and NVMI:
ON Scores
- Altman Z-Score: 4.84, indicating a safe zone with low bankruptcy risk.
- Piotroski Score: 6, reflecting average financial strength.
NVMI Scores
- Altman Z-Score: 7.76, indicating a safe zone with very low bankruptcy risk.
- Piotroski Score: 7, indicating strong financial health.
Which company has the best scores?
NVMI has higher Altman Z-Score and Piotroski Score than ON, suggesting stronger financial stability and health based on the provided data.
Grades Comparison
The following tables and summaries present the recent grades for ON Semiconductor Corporation and Nova Ltd.:
ON Semiconductor Corporation Grades
This table shows recent grades from reputable grading companies for ON Semiconductor Corporation:
| Grading Company | Action | New Grade | Date |
|---|---|---|---|
| Piper Sandler | Maintain | Overweight | 2026-01-07 |
| Truist Securities | Maintain | Hold | 2025-12-19 |
| Morgan Stanley | Maintain | Equal Weight | 2025-11-24 |
| Truist Securities | Maintain | Hold | 2025-11-04 |
| Baird | Maintain | Neutral | 2025-11-04 |
| Rosenblatt | Maintain | Neutral | 2025-11-04 |
| Morgan Stanley | Maintain | Equal Weight | 2025-11-04 |
| TD Cowen | Maintain | Buy | 2025-11-04 |
| UBS | Maintain | Neutral | 2025-10-27 |
| B of A Securities | Maintain | Neutral | 2025-09-05 |
Grades for ON Semiconductor predominantly range from Neutral to Hold, with some Buy and Overweight ratings, indicating a generally cautious but stable outlook.
Nova Ltd. Grades
This table shows recent grades from reputable grading companies for Nova Ltd.:
| Grading Company | Action | New Grade | Date |
|---|---|---|---|
| B of A Securities | Maintain | Buy | 2026-01-13 |
| Jefferies | Maintain | Buy | 2025-12-15 |
| Evercore ISI Group | Maintain | Outperform | 2025-11-07 |
| Benchmark | Maintain | Buy | 2025-11-07 |
| Cantor Fitzgerald | Maintain | Overweight | 2025-06-24 |
| B of A Securities | Maintain | Buy | 2025-06-24 |
| Benchmark | Maintain | Buy | 2025-05-09 |
| Citigroup | Maintain | Buy | 2025-05-09 |
| B of A Securities | Maintain | Buy | 2025-04-16 |
| Cantor Fitzgerald | Maintain | Overweight | 2025-03-14 |
Grades for Nova Ltd. are consistently positive with several Buy and Overweight ratings and an Outperform rating, reflecting a strong favorable consensus.
Which company has the best grades?
Nova Ltd. has received predominantly Buy and Outperform grades, reflecting higher analyst confidence compared to ON Semiconductor Corporation’s more mixed Neutral and Hold ratings. This suggests a stronger positive sentiment that may influence investor perception and portfolio allocation decisions.
Strengths and Weaknesses
Below is a comparative overview of the strengths and weaknesses of ON Semiconductor Corporation (ON) and Nova Ltd. (NVMI) based on recent financial and strategic data.
| Criterion | ON Semiconductor Corporation (ON) | Nova Ltd. (NVMI) |
|---|---|---|
| Diversification | Highly diversified product segments including Power Solutions (3.35B), Analog Solutions (2.61B), and Intelligent Sensing (1.13B) in 2024 | Limited product diversification with sole product revenue of 538M in 2024 |
| Profitability | Favorable profitability metrics: Net margin 22.21%, ROE 17.88%, ROIC 11.88%, growing ROIC trend | Strong profitability with higher Net margin 27.33%, ROE 19.81%, ROIC 13.39%, also growing ROIC |
| Innovation | Moderate innovation as indicated by steady growth in ROIC and product segment expansion | Innovation reflected in rapid ROIC growth and improving operational efficiency |
| Global presence | Large multinational footprint with broad market exposure | Smaller global footprint implied by product concentration |
| Market Share | Substantial presence in semiconductor market with multiple product lines | Niche player with less market breadth, but showing strong financial performance |
Key takeaways: Both companies are improving profitability with growing ROIC, but ON offers stronger diversification and market presence. NVMI excels in profitability ratios and operational efficiency but remains more concentrated in its product offering. Investors should weigh diversification against efficiency and growth potential.
Risk Analysis
Below is a summary table of key risk factors for ON Semiconductor Corporation (ON) and Nova Ltd. (NVMI) based on the most recent 2024 data:
| Metric | ON Semiconductor Corporation (ON) | Nova Ltd. (NVMI) |
|---|---|---|
| Market Risk | Beta 1.54, moderate volatility | Beta 1.83, higher volatility |
| Debt level | Debt/Equity 0.38, favorable | Debt/Equity 0.25, favorable but debt-to-equity rating unfavorable |
| Regulatory Risk | Moderate, US technology sector | Moderate, Israel-based with global exposure |
| Operational Risk | Medium, diversified segments | Medium, specialized in metrology equipment |
| Environmental Risk | Moderate, semiconductor industry | Moderate, semiconductor manufacturing exposure |
| Geopolitical Risk | Low to moderate, US-based | Elevated, exposure to geopolitical tensions in Israel and Asia |
The most impactful risks include NVMI’s higher market volatility and geopolitical exposure, given its global operations and Israel base. ON’s risks are more balanced but with moderate market sensitivity and operational complexity. Both have favorable debt levels, reducing financial distress concerns, supported by strong Altman Z-scores indicating low bankruptcy risk. Investors should weigh NVMI’s geopolitical and valuation risks against ON’s steadier profile.
Which Stock to Choose?
ON Semiconductor Corporation shows a favorable income statement with strong profitability, despite a recent revenue decline. Its financial ratios are slightly favorable overall, supported by solid returns on equity and capital, moderate debt, and a very favorable rating.
Nova Ltd. has a favorable income evolution with robust growth and higher margins. Its financial ratios are more favorable overall, featuring strong returns, low debt levels, yet with some valuation concerns reflected in its higher P/E and P/B ratios, and a very favorable overall rating.
Investors seeking growth and higher profitability may find Nova Ltd. more appealing given its stronger income growth and ratio profile, while those prioritizing stability and moderate valuation might consider ON Semiconductor’s consistent returns and balanced financial metrics as advantageous.
Disclaimer: Investment carries a risk of loss of initial capital. The past performance is not a reliable indicator of future results. Be sure to understand risks before making an investment decision.
Go Further
I encourage you to read the complete analyses of ON Semiconductor Corporation and Nova Ltd. to enhance your investment decisions: