Home > Comparison > Consumer Cyclical > RCL vs NCLH
The strategic rivalry between Royal Caribbean Cruises Ltd. and Norwegian Cruise Line Holdings Ltd. shapes the travel services sector’s evolution. Royal Caribbean operates a large fleet with diverse premium brands, emphasizing scale and global reach. Norwegian Cruise Line focuses on a more niche, experiential approach with fewer ships but extensive itineraries. This analysis will assess which operational model delivers a superior risk-adjusted return for a diversified portfolio amid ongoing industry recovery and competitive pressures.

Table of contents
Companies Overview
Royal Caribbean Cruises Ltd. and Norwegian Cruise Line Holdings Ltd. are pivotal players in the global cruise industry. Both companies shape travel experiences worldwide but differ in scale and fleet size.
Royal Caribbean Cruises Ltd.: Global Cruise Innovator
Royal Caribbean Cruises Ltd. dominates as a global cruise operator with 61 ships under four premier brands. Its core revenue stems from ticket sales and onboard services across roughly 1,000 destinations. In 2026, it focuses on expanding its fleet and enhancing guest experiences, reinforcing its competitive edge through innovation and scale.
Norwegian Cruise Line Holdings Ltd.: Boutique Luxury and Reach
Norwegian Cruise Line Holdings Ltd. operates 28 ships, targeting diverse markets with its three brands. It generates revenue via ticket sales, onboard amenities, and travel advisor channels. The company’s strategic focus in 2026 is on broadening international itineraries and strengthening its luxury cruise offerings to capture niche segments.
Strategic Collision: Similarities & Divergences
Both companies emphasize itinerary diversity and onboard sales, but Royal Caribbean leverages a larger fleet and global reach against Norwegian’s focus on luxury and specialized routes. Their battleground lies in market share across premium cruise experiences. Investors face distinct profiles: Royal Caribbean’s scale offers resilience while Norwegian’s niche focus provides targeted growth potential.
Income Statement Comparison
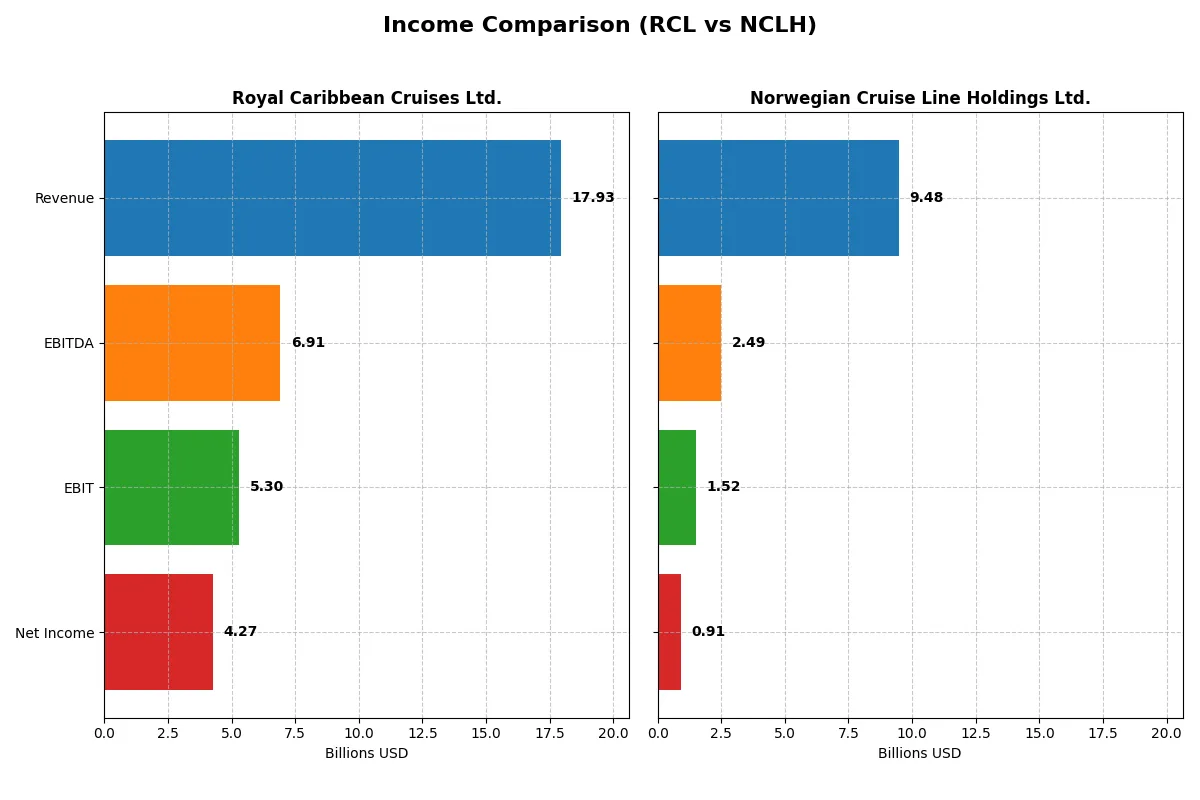
This data dissects the core profitability and scalability of both corporate engines to reveal who dominates the bottom line:
| Metric | Royal Caribbean Cruises Ltd. (RCL) | Norwegian Cruise Line Holdings Ltd. (NCLH) |
|---|---|---|
| Revenue | 17.9B | 9.48B |
| Cost of Revenue | 9.54B | 5.69B |
| Operating Expenses | 3.49B | 2.33B |
| Gross Profit | 8.40B | 3.79B |
| EBITDA | 6.91B | 2.49B |
| EBIT | 5.30B | 1.52B |
| Interest Expense | 992M | 747M |
| Net Income | 4.27B | 910M |
| EPS | 15.73 | 2.09 |
| Fiscal Year | 2025 | 2024 |
Income Statement Analysis: The Bottom-Line Duel
This income statement comparison reveals the true efficiency and profitability of two leading cruise operators over recent years.
Royal Caribbean Cruises Ltd. Analysis
Royal Caribbean’s revenue surged from 1.5B in 2021 to 17.9B in 2025, illustrating robust growth. Net income swung from a deep loss of -5.3B in 2021 to a strong profit of 4.3B in 2025, signaling a powerful turnaround. Gross margins hold firm near 47%, and net margins expanded to 24%, reflecting improved operational efficiency and healthy profitability momentum in 2025.
Norwegian Cruise Line Holdings Ltd. Analysis
Norwegian’s revenue climbed steadily from 648M in 2021 to 9.5B in 2024, marking solid scale growth. Net income recovered from a 4.5B loss in 2021 to a 910M profit in 2024. Gross margin steadied near 40%, while net margin hit 9.6%, indicating profitability but at a slimmer scale than Royal Caribbean. The 2024 results show accelerating earnings growth and operational leverage gains.
Margin Dominance vs. Revenue Scale
Royal Caribbean outpaces Norwegian with superior margins and larger absolute profits despite similar revenue growth trajectories. RCL’s 24% net margin more than doubles NCLH’s 9.6%, reflecting a stronger moat and capital allocation discipline. Investors seeking scale with higher returns may favor Royal Caribbean’s robust income efficiency and powerful earnings momentum.
Financial Ratios Comparison
These vital ratios act as a diagnostic tool to expose underlying fiscal health, valuation premiums, and capital efficiency of the companies compared here:
| Ratios | Royal Caribbean Cruises Ltd. (RCL) | Norwegian Cruise Line Holdings Ltd. (NCLH) |
|---|---|---|
| ROE | 38.0% (2024) | 63.9% (2024) |
| ROIC | 14.2% (2024) | 9.4% (2024) |
| P/E | 20.9 (2024) | 12.3 (2024) |
| P/B | 7.96 (2024) | 7.86 (2024) |
| Current Ratio | 0.17 (2024) | 0.17 (2024) |
| Quick Ratio | 0.15 (2024) | 0.15 (2024) |
| D/E | 2.75 (2024) | 9.76 (2024) |
| Debt-to-Assets | 56.2% (2024) | 69.7% (2024) |
| Interest Coverage | 2.58 (2024) | 1.96 (2024) |
| Asset Turnover | 0.44 (2024) | 0.47 (2024) |
| Fixed Asset Turnover | 0.51 (2024) | 0.56 (2024) |
| Payout Ratio | 6.2% (2025) | 0% |
| Dividend Yield | 0.35% (2025) | 0% |
| Fiscal Year | 2025 | 2024 |
Efficiency & Valuation Duel: The Vital Signs
Financial ratios act as a company’s DNA, revealing hidden risks and operational excellence behind headline numbers.
Royal Caribbean Cruises Ltd.
Royal Caribbean shows a strong net margin of 23.8%, signaling operational efficiency, but ROE and ROIC stand at zero, an unfavorable sign. Its P/E ratio of 17.7 is neutral, suggesting fair valuation. A modest dividend yield of 0.35% contrasts with reinvestment into growth, highlighting cautious capital allocation amid mixed balance sheet signals.
Norwegian Cruise Line Holdings Ltd.
Norwegian Cruise delivers a high ROE of 63.9%, reflecting strong shareholder returns despite a moderate net margin of 9.6%. The stock trades at a favorable P/E of 12.3 but suffers from a high price-to-book ratio of 7.9 and heavy leverage. Lack of dividends and elevated debt weigh on financial stability, signaling a riskier profile.
Balanced Efficiency vs. Risk Intensity
Royal Caribbean offers a more balanced ratio profile with operational efficiency and moderate valuation. Norwegian excels in profitability but carries significant debt and valuation risks. Conservative investors may prefer Royal Caribbean’s steadier footing, while those seeking high returns at higher risk might lean toward Norwegian.
Which one offers the Superior Shareholder Reward?
Royal Caribbean Cruises Ltd. (RCL) pays a modest dividend yield of 0.35% with a low payout ratio around 6%. It supports this with steady free cash flow at 4.6/share and moderate buybacks. Norwegian Cruise Line Holdings Ltd. (NCLH) offers no dividends but aggressively reinvests in growth, showing a lower free cash flow yield and no buybacks in 2024. I see RCL’s balanced approach—modest dividends plus buybacks—delivers a more sustainable, attractive total return in 2026. NCLH’s reinvestment strategy carries higher risk amid heavy leverage. Thus, RCL offers superior shareholder reward for prudent investors.
Comparative Score Analysis: The Strategic Profile
The radar chart reveals the fundamental DNA and trade-offs of both companies, highlighting their distinct financial strengths and vulnerabilities:
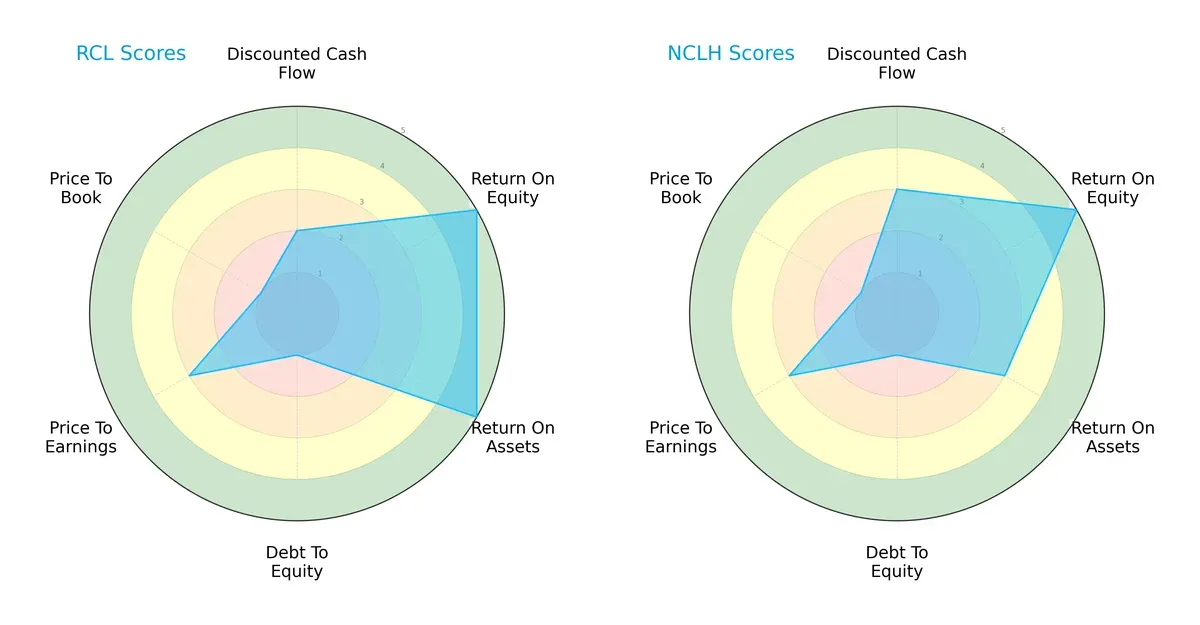
Royal Caribbean Cruises Ltd. (RCL) shows superior operational efficiency with very favorable ROE and ROA scores (5 each) compared to Norwegian Cruise Line Holdings Ltd. (NCLH), which has a moderate ROA score of 3. However, both firms struggle with leverage, reflected in very unfavorable debt-to-equity scores of 1. NCLH edges out RCL in discounted cash flow valuation with a score of 3 versus 2, suggesting slightly better future cash flow expectations. Both companies share moderate overall and P/E scores, but RCL’s very unfavorable P/B score signals market skepticism about its book value. Overall, RCL presents a more balanced operational profile, while NCLH leans on valuation strength.
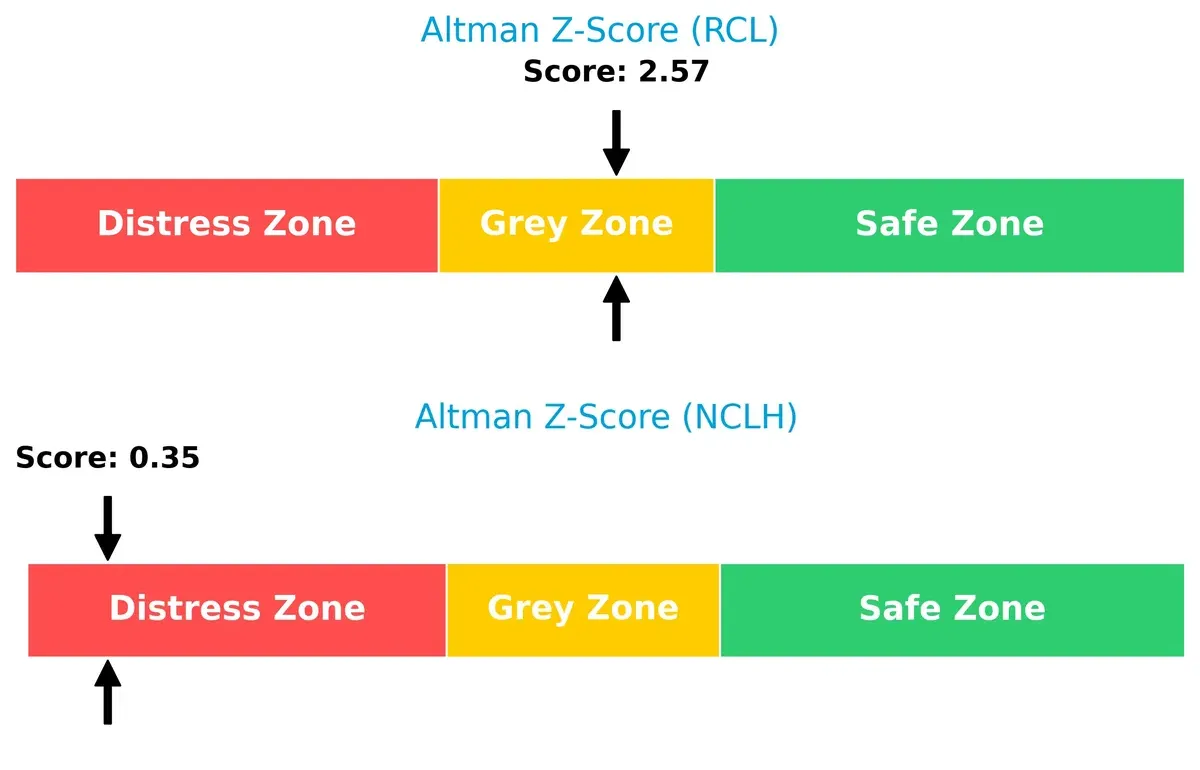
Bankruptcy Risk: Solvency Showdown
RCL’s Altman Z-Score of 2.57 places it in the grey zone, indicating moderate bankruptcy risk in this cycle, whereas NCLH’s score of 0.35 signals distress and high insolvency risk:
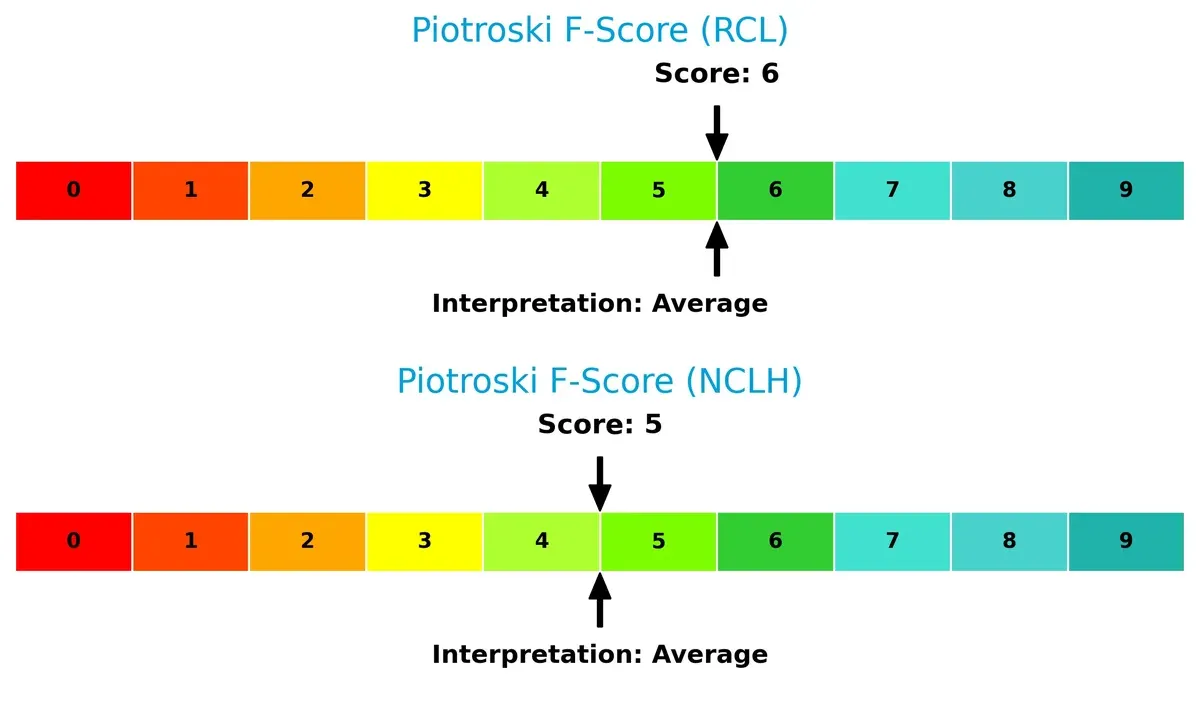
Financial Health: Quality of Operations
Both companies show average Piotroski F-Scores—RCL at 6 and NCLH at 5—suggesting neither is in peak financial health, but also no immediate red flags. RCL’s slight edge implies marginally stronger internal financial metrics:
How are the two companies positioned?
This section dissects the operational DNA of Royal Caribbean Cruises Ltd. (RCL) and Norwegian Cruise Line Holdings Ltd. (NCLH) by comparing their revenue distribution by segment and internal dynamics. The goal is to confront their economic moats and identify which business model offers the most resilient and sustainable competitive advantage today.
Revenue Segmentation: The Strategic Mix
This visual comparison dissects how Royal Caribbean Cruises Ltd. and Norwegian Cruise Line Holdings Ltd. diversify their income streams and where their primary sector bets lie:
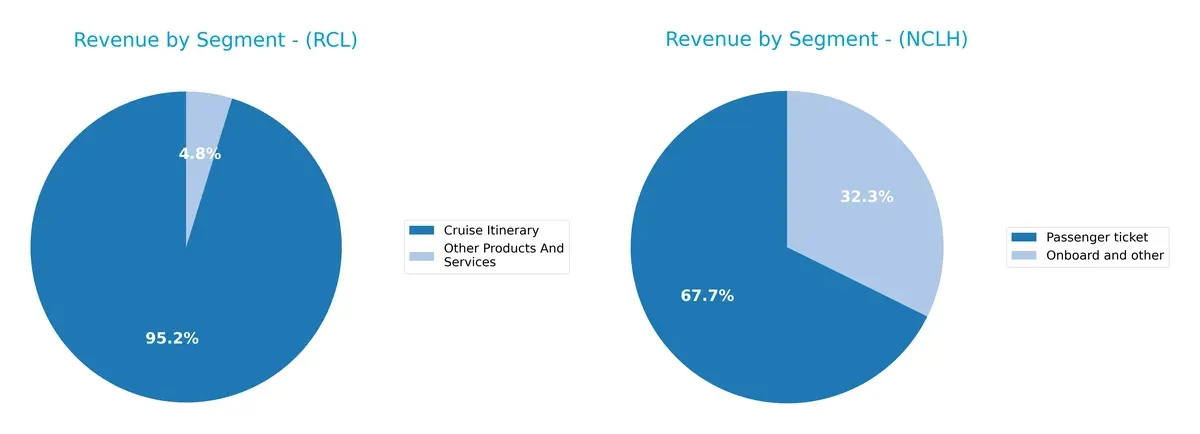
Royal Caribbean anchors 2024 revenue predominantly in Cruise Itinerary at $15.7B, with a modest $788M from Other Products. Norwegian Cruise Line shows a more balanced mix: Passenger Ticket at $6.4B and Onboard and Other at $3.1B. RCL’s heavy reliance on Cruise Itinerary signals concentration risk but also dominance in core cruising. NCLH’s diversified streams hint at stronger ecosystem lock-in through onboard services.
Strengths and Weaknesses Comparison
This table compares the strengths and weaknesses of Royal Caribbean Cruises Ltd. (RCL) and Norwegian Cruise Line Holdings Ltd. (NCLH):
RCL Strengths
- Strong cruise itinerary revenue at 15.7B USD in 2024
- Favorable net margin of 23.82%
- Low debt-to-assets ratio signaling financial prudence
- Solid interest coverage ratio at 5.34x indicating good debt servicing capacity
- Established global presence with 10.6B USD revenue from North America
NCLH Strengths
- High return on equity at 63.86% demonstrating efficient capital use
- Favorable PE ratio at 12.3, attractive valuation
- Diversified revenue with 3.1B USD from onboard services
- Solid presence in Europe with 3.0B USD revenue
- Neutral ROIC and WACC showing balanced capital efficiency
RCL Weaknesses
- Unfavorable ROE and ROIC at 0%, indicating poor capital returns
- Weak liquidity with current and quick ratios at zero
- Low asset turnover reflecting inefficient asset use
- Unfavorable dividend yield at 0.35%
- Limited diversification beyond cruise itineraries
NCLH Weaknesses
- High debt-to-assets ratio at 69.7% increasing financial risk
- Low liquidity ratios (current 0.17, quick 0.15) suggest tight short-term resources
- Unfavorable PB ratio at 7.86 indicating overvaluation
- Lower net margin at 9.6%
- Unfavorable asset and fixed asset turnover ratios
Overall, RCL shows strength in profitability and conservative financial leverage but struggles with returns on invested capital and liquidity. NCLH excels in equity returns and valuation but carries heavier debt and weaker liquidity. These contrasts highlight distinct strategic challenges for each company in optimizing capital efficiency and financial stability.
The Moat Duel: Analyzing Competitive Defensibility
A structural moat shields long-term profits from relentless competitive pressure. Without it, earnings erode steadily over time:
Royal Caribbean Cruises Ltd.: Scale-Driven Cost Advantage
Royal Caribbean leverages massive scale and brand reach, delivering stable 29.5% EBIT margins and 23.8% net margins. Expanding Asia-Pacific and luxury segments could deepen its moat in 2026.
Norwegian Cruise Line Holdings Ltd.: Growth-Driven Operational Leverage
Norwegian’s slightly smaller scale contrasts with Royal Caribbean’s, but it shows a faster ROIC growth trend. Margins are thinner at 16%, yet rising profitability and fleet expansion signal future competitive gains.
Verdict: Scale Cost Advantage vs. Growth Operational Leverage
Royal Caribbean’s wider scale moat underpins superior margin stability. Norwegian’s improving ROIC hints at a narrowing gap but lacks Royal Caribbean’s entrenched cost leadership. Royal Caribbean remains better equipped to defend market share.
Which stock offers better returns?
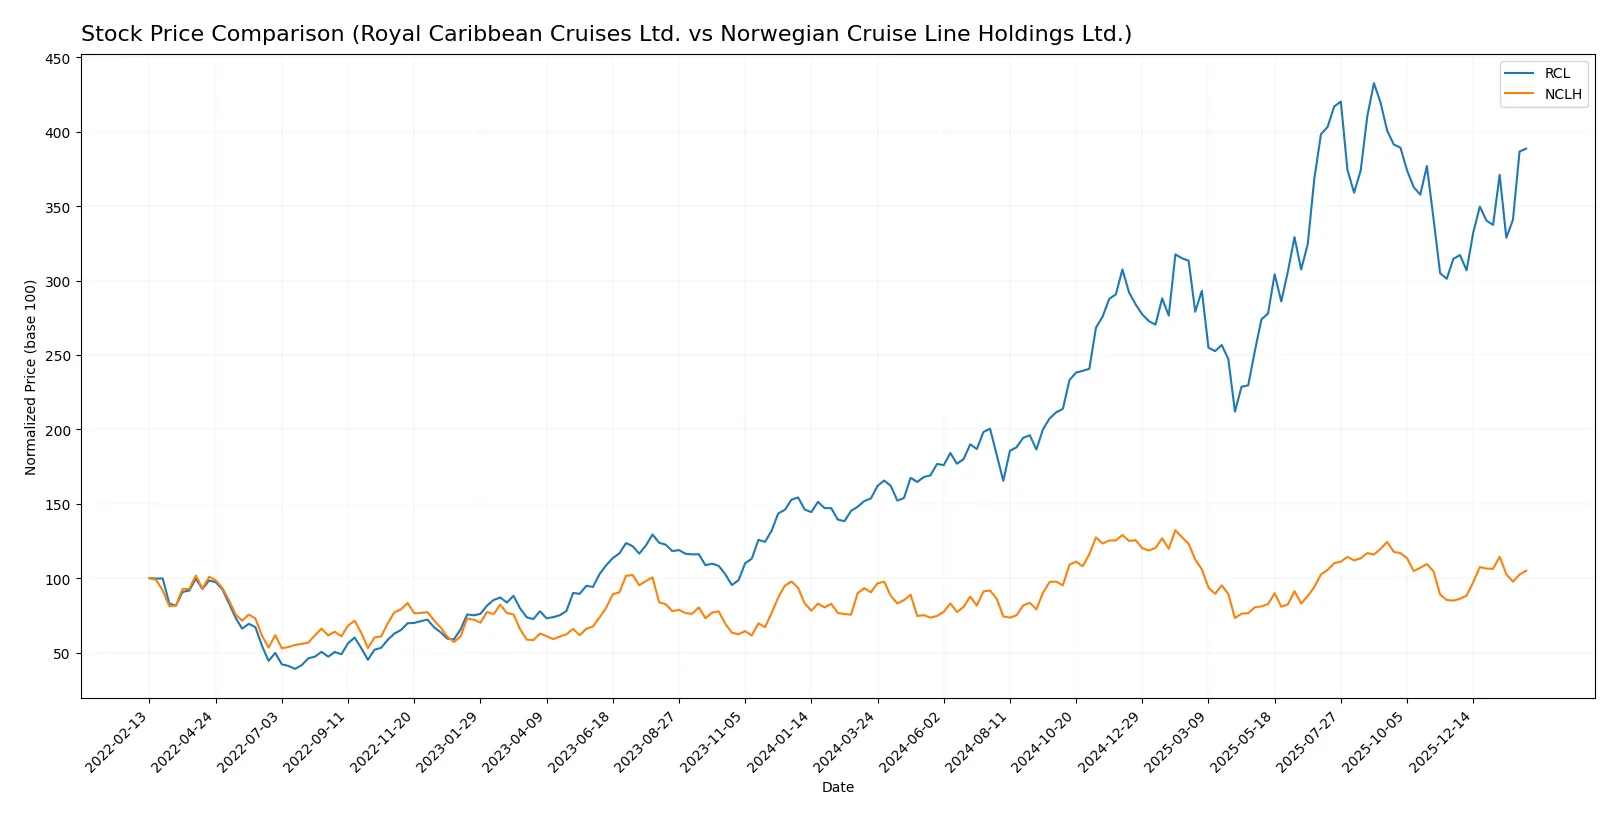
Over the past year, Royal Caribbean Cruises Ltd. showed a strong bullish trend with significant price appreciation, while Norwegian Cruise Line Holdings Ltd. also gained but with more modest growth. Both stocks exhibited accelerating upward momentum.
Trend Comparison
Royal Caribbean Cruises Ltd. surged 153.09% over the last 12 months, reflecting a bullish trend with price acceleration. The stock’s high volatility is evident from a 66.45 standard deviation and a range between 127.67 and 363.22.
Norwegian Cruise Line Holdings Ltd. gained 16.03% over the year, also bullish with acceleration but much lower volatility at 3.6 standard deviation. Its price ranged from 15.69 to 28.35, showing steadier movement.
Comparing trends, Royal Caribbean Cruises Ltd. delivered substantially higher returns and stronger price acceleration versus Norwegian Cruise Line Holdings Ltd.
Target Prices
The consensus target prices for Royal Caribbean Cruises Ltd. and Norwegian Cruise Line Holdings Ltd. reflect moderate upside potential.
| Company | Target Low | Target High | Consensus |
|---|---|---|---|
| Royal Caribbean Cruises Ltd. | 318 | 420 | 361.5 |
| Norwegian Cruise Line Holdings Ltd. | 20 | 38 | 26.78 |
Analysts expect Royal Caribbean to trade modestly above its current price of 326.29, signaling confidence in its recovery. Norwegian Cruise Line’s consensus target of 26.78 suggests upside from its current 22.51, though with higher volatility risk.

Don’t Let Luck Decide Your Entry Point
Optimize your entry points with our advanced ProRealTime indicators. You’ll get efficient buy signals with precise price targets for maximum performance. Start outperforming now!
How do institutions grade them?
I present the recent institutional grades for Royal Caribbean Cruises Ltd. and Norwegian Cruise Line Holdings Ltd.:
Royal Caribbean Cruises Ltd. Grades
Here are the latest grades from major financial institutions for Royal Caribbean Cruises Ltd.:
| Grading Company | Action | New Grade | Date |
|---|---|---|---|
| Goldman Sachs | Maintain | Buy | 2026-02-02 |
| Wells Fargo | Maintain | Overweight | 2026-02-02 |
| JP Morgan | Maintain | Overweight | 2026-02-02 |
| Stifel | Maintain | Buy | 2026-01-30 |
| Barclays | Maintain | Overweight | 2026-01-30 |
| Jefferies | Maintain | Hold | 2026-01-30 |
| Goldman Sachs | Maintain | Buy | 2026-01-23 |
| Mizuho | Maintain | Outperform | 2026-01-22 |
| Truist Securities | Maintain | Hold | 2026-01-22 |
| Stifel | Maintain | Buy | 2026-01-20 |
Norwegian Cruise Line Holdings Ltd. Grades
Below are the most recent grades from recognized financial firms for Norwegian Cruise Line Holdings Ltd.:
| Grading Company | Action | New Grade | Date |
|---|---|---|---|
| JP Morgan | Maintain | Overweight | 2026-01-20 |
| Citigroup | Maintain | Buy | 2026-01-14 |
| TD Cowen | Maintain | Buy | 2026-01-13 |
| Wells Fargo | Maintain | Overweight | 2026-01-13 |
| B of A Securities | Maintain | Neutral | 2026-01-12 |
| Barclays | Maintain | Overweight | 2025-12-17 |
| Jefferies | Downgrade | Hold | 2025-12-15 |
| Mizuho | Maintain | Outperform | 2025-12-12 |
| Goldman Sachs | Downgrade | Neutral | 2025-12-09 |
| Truist Securities | Maintain | Buy | 2025-12-02 |
Which company has the best grades?
Royal Caribbean Cruises Ltd. holds consistently positive grades with multiple “Buy” and “Overweight” ratings. Norwegian Cruise Line shows a mix of “Buy,” “Overweight,” and some downgrades to “Hold” and “Neutral.” This suggests Royal Caribbean currently enjoys a stronger institutional outlook, which may influence investor confidence and portfolio weightings.
Risks specific to each company
The following categories identify the critical pressure points and systemic threats facing both firms in the 2026 market environment:
1. Market & Competition
Royal Caribbean Cruises Ltd. (RCL)
- Operates 61 ships with diversified brands, facing intense competition in global cruise markets.
Norwegian Cruise Line Holdings Ltd. (NCLH)
- Smaller fleet of 28 ships, heavily reliant on North American and European markets, with strong competitive pressure.
2. Capital Structure & Debt
Royal Caribbean Cruises Ltd. (RCL)
- Favorable debt metrics with manageable leverage; interest coverage at 5.34x indicates solid debt servicing capability.
Norwegian Cruise Line Holdings Ltd. (NCLH)
- High leverage with debt-to-assets near 70%, interest coverage weak at 2.03x, raising financial risk concerns.
3. Stock Volatility
Royal Caribbean Cruises Ltd. (RCL)
- Beta of 1.87 indicates higher market sensitivity but less volatile than NCLH.
Norwegian Cruise Line Holdings Ltd. (NCLH)
- Beta of 2.03 signals elevated stock volatility, increasing investment risk.
4. Regulatory & Legal
Royal Caribbean Cruises Ltd. (RCL)
- Faces global maritime and environmental regulations; robust compliance but increasing regulatory costs.
Norwegian Cruise Line Holdings Ltd. (NCLH)
- Similar exposure to international regulations; smaller scale may limit resources for compliance.
5. Supply Chain & Operations
Royal Caribbean Cruises Ltd. (RCL)
- Large fleet benefits from operational scale but vulnerable to global supply chain disruptions.
Norwegian Cruise Line Holdings Ltd. (NCLH)
- Smaller fleet with less operational scale; supply chain hiccups may have outsized impact.
6. ESG & Climate Transition
Royal Caribbean Cruises Ltd. (RCL)
- Actively investing in greener technologies; ESG initiatives strengthen long-term sustainability.
Norwegian Cruise Line Holdings Ltd. (NCLH)
- ESG efforts less pronounced; risks from climate transition and carbon regulations remain significant.
7. Geopolitical Exposure
Royal Caribbean Cruises Ltd. (RCL)
- Operates globally with diversified destinations, mitigating localized geopolitical risks.
Norwegian Cruise Line Holdings Ltd. (NCLH)
- Concentrated routes in sensitive regions like Scandinavia and Russia expose it to geopolitical volatility.
Which company shows a better risk-adjusted profile?
Royal Caribbean Cruises Ltd. demonstrates a better risk-adjusted profile due to stronger capital structure and broader operational scale. Its lower leverage and higher interest coverage reduce financial distress risk. Norwegian Cruise Line’s elevated debt burden and stock volatility heighten its vulnerability. The critical risk for RCL is regulatory cost inflation, while for NCLH it is its precarious capital structure. Recent financial scores place NCLH in the distress zone on Altman Z-Score, underscoring its elevated bankruptcy risk.
Final Verdict: Which stock to choose?
Royal Caribbean Cruises Ltd. (RCL) stands out with its superpower of strong income growth and operational momentum, evidenced by consistent margin expansion and a bullish price trend. However, its stretched liquidity position remains a point of vigilance. It suits investors targeting aggressive growth tempered by higher risk tolerance.
Norwegian Cruise Line Holdings Ltd. (NCLH) offers a strategic moat through improving profitability and a steadily growing return on invested capital, despite its heavier debt load. Its more moderate price multiples and stable income growth make it better aligned with investors seeking growth at a reasonable price and relative safety compared to RCL.
If you prioritize aggressive expansion and can withstand liquidity challenges, RCL is the compelling choice due to its robust margin trajectory and market enthusiasm. However, if you seek steadier growth with improving capital efficiency and a more conservative risk profile, NCLH offers better stability despite its financial leverage. Both present distinct analytical scenarios depending on your portfolio objectives.
Disclaimer: Investment carries a risk of loss of initial capital. The past performance is not a reliable indicator of future results. Be sure to understand risks before making an investment decision.
Go Further
I encourage you to read the complete analyses of Royal Caribbean Cruises Ltd. and Norwegian Cruise Line Holdings Ltd. to enhance your investment decisions: