Home > Comparison > Industrials > NOC vs TDG
The strategic rivalry between Northrop Grumman Corporation and TransDigm Group Incorporated shapes the aerospace and defense sector’s future. Northrop Grumman operates as a diversified aerospace and defense giant with broad product lines and integrated systems. In contrast, TransDigm focuses on high-margin, specialized aircraft components, emphasizing niche market leadership. This analysis explores which operational model offers superior risk-adjusted returns for a diversified portfolio amid evolving industry dynamics.
Table of contents
Companies Overview
Northrop Grumman and TransDigm dominate the aerospace and defense sector with distinct market roles and strategic priorities.
Northrop Grumman Corporation: Aerospace & Defense Powerhouse
Northrop Grumman commands the aerospace and defense market by designing and sustaining advanced aircraft and mission systems. Its revenue hinges on integrated battle management, cyber solutions, and missile defense. In 2026, the company strategically focuses on expanding its cutting-edge ISR systems and hypersonic propulsion, reinforcing its technological edge and broad defense portfolio.
TransDigm Group Incorporated: Aircraft Components Specialist
TransDigm excels as a specialized supplier of aircraft components, generating revenue through power and control systems, airframe parts, and non-aviation products. The company’s 2026 strategy emphasizes deepening its hold on engineered components and expanding into aerospace subsystems, serving military and commercial clients with highly engineered, mission-critical parts.
Strategic Collision: Similarities & Divergences
Northrop Grumman prioritizes full-system defense solutions, while TransDigm concentrates on niche component engineering. Their primary battleground lies in aerospace system integration versus component supply chains. Investors face contrasting risk profiles: Northrop offers diversified aerospace exposure, whereas TransDigm bets on high-margin, specialized part dominance.
Income Statement Comparison
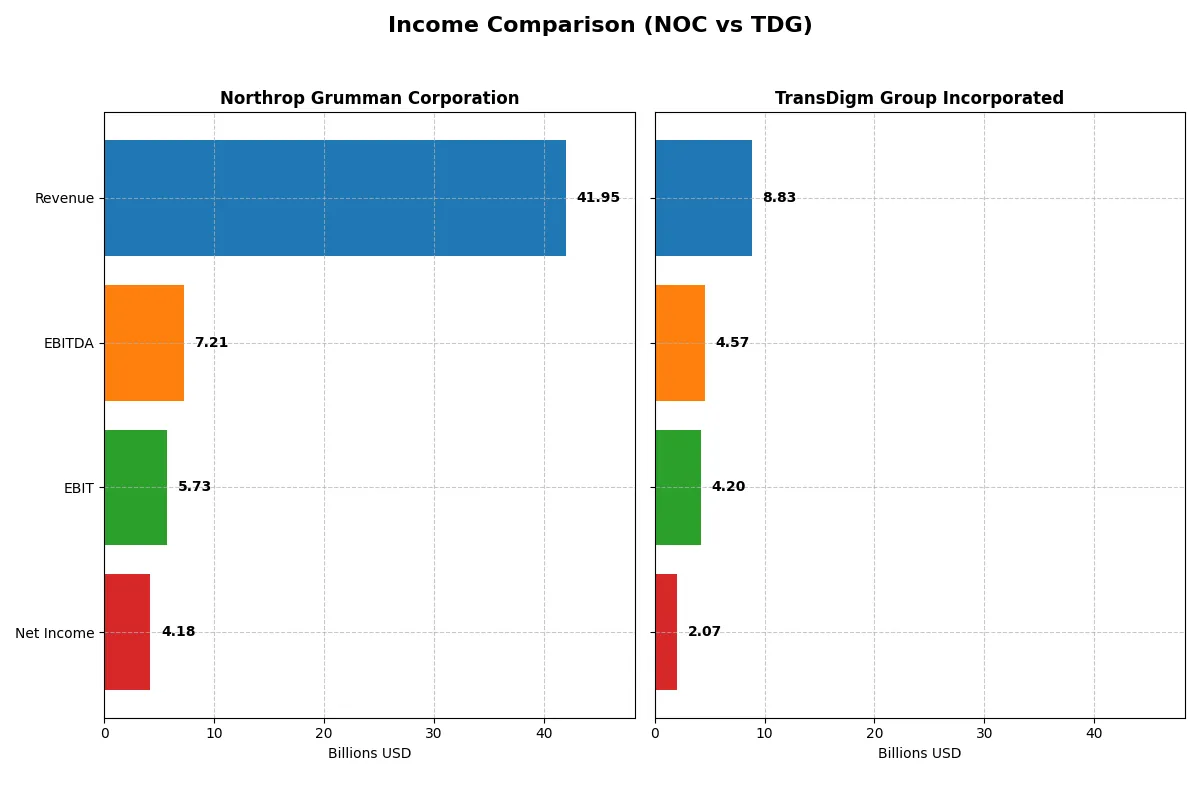
This data dissects the core profitability and scalability of both corporate engines to reveal who dominates the bottom line:
| Metric | Northrop Grumman Corporation (NOC) | TransDigm Group Incorporated (TDG) |
|---|---|---|
| Revenue | 41.95B | 8.83B |
| Cost of Revenue | 33.64B | 3.52B |
| Operating Expenses | 4.03B | 1.15B |
| Gross Profit | 8.31B | 5.31B |
| EBITDA | 7.21B | 4.57B |
| EBIT | 5.73B | 4.20B |
| Interest Expense | 665M | 1.57B |
| Net Income | 4.18B | 2.07B |
| EPS | 29.14 | 32.08 |
| Fiscal Year | 2025 | 2025 |
Income Statement Analysis: The Bottom-Line Duel
This income statement comparison exposes the true efficiency and profitability of each company’s operational engine over recent years.
Northrop Grumman Corporation Analysis
Northrop Grumman’s revenue advanced steadily from 35.7B in 2021 to 41.95B in 2025, but net income declined from 7B to 4.18B in the same period. Gross margins hovered near 20%, showing stability despite slight contraction. The 2025 net margin of 9.97% reflects solid profitability, yet a 40% net income drop signals challenges in sustaining earnings momentum.
TransDigm Group Incorporated Analysis
TransDigm posted robust revenue growth, surging from 4.8B in 2021 to 8.83B in 2025, while net income exploded from 607M to 1.87B. Its gross margin exceeds 60%, and net margin reached 23.5% in 2025, both well above industry norms. The company’s sharp EPS growth of 208% over five years underscores its operational leverage and expanding profitability.
Margin Power vs. Revenue Scale
TransDigm clearly outperforms Northrop Grumman in profitability metrics and growth rates, boasting superior margins and accelerating earnings. Northrop Grumman offers scale but struggles with net income contraction and margin pressures. For investors prioritizing efficiency and earnings expansion, TransDigm’s profile appears more compelling.
Financial Ratios Comparison
These vital ratios act as a diagnostic tool to expose the underlying fiscal health, valuation premiums, and capital efficiency of the companies under review:
| Ratios | Northrop Grumman Corporation (NOC) | TransDigm Group Incorporated (TDG) |
|---|---|---|
| ROE | 25.1% | -21.4% |
| ROIC | 9.2% | 15.2% |
| P/E | 19.6x | 37.0x |
| P/B | 4.91x | -7.92x |
| Current Ratio | 1.09 | 3.21 |
| Quick Ratio | 0.99 | 2.25 |
| D/E (Debt-to-Equity) | 1.18 | -3.10 |
| Debt-to-Assets | 38.4% | 131.1% |
| Interest Coverage | 6.44x | 2.65x |
| Asset Turnover | 0.82 | 0.39 |
| Fixed Asset Turnover | 3.27 | 5.59 |
| Payout ratio | 31% | 464% |
| Dividend yield | 1.58% | 12.55% |
| Fiscal Year | 2025 | 2025 |
Efficiency & Valuation Duel: The Vital Signs
Financial ratios serve as a company’s DNA, uncovering hidden risks and operational strengths critical for investment decisions.
Northrop Grumman Corporation
Northrop Grumman shows a solid 25.08% ROE and a reasonable net margin near 10%, signaling efficient profitability. The P/E ratio of 19.57 suggests a fairly valued stock, though a high PB ratio of 4.91 is a caution. The 1.58% dividend yield indicates steady shareholder returns with moderate leverage of 1.18 D/E.
TransDigm Group Incorporated
TransDigm boasts a robust 23.49% net margin and a strong 15.22% ROIC, but its negative 21.41% ROE flags profitability concerns. The P/E ratio of 36.99 marks the stock as expensive. A high dividend yield of 12.55% provides substantial income, yet debt levels are elevated with 131% debt-to-assets ratio, reflecting financial risk.
Premium Valuation vs. Operational Safety
Northrop Grumman balances solid returns with moderate valuation and manageable debt, offering a safer risk-reward profile. TransDigm delivers higher margins and dividend yield but carries stretched valuation and elevated financial risk. Conservative investors may prefer Northrop’s stability, while yield seekers might consider TransDigm’s income focus despite its risks.
Which one offers the Superior Shareholder Reward?
I see Northrop Grumman Corporation (NOC) delivers a moderate dividend yield of 1.58% in 2025, with a sustainable payout ratio near 31%. Its free cash flow comfortably covers dividends and capex, supporting steady shareholder returns. Meanwhile, TransDigm Group Incorporated (TDG) boasts a striking 12.55% dividend yield in 2025 but an unsustainably high payout ratio exceeding 460%. TDG’s aggressive buyback activity complements its yield, yet its heavy debt load and negative equity raise sustainability concerns. NOC’s balanced approach between dividends and buybacks offers a more durable total return profile. I conclude NOC provides the superior long-term shareholder reward in 2026.
Comparative Score Analysis: The Strategic Profile
The radar chart reveals the fundamental DNA and trade-offs of Northrop Grumman Corporation and TransDigm Group Incorporated:
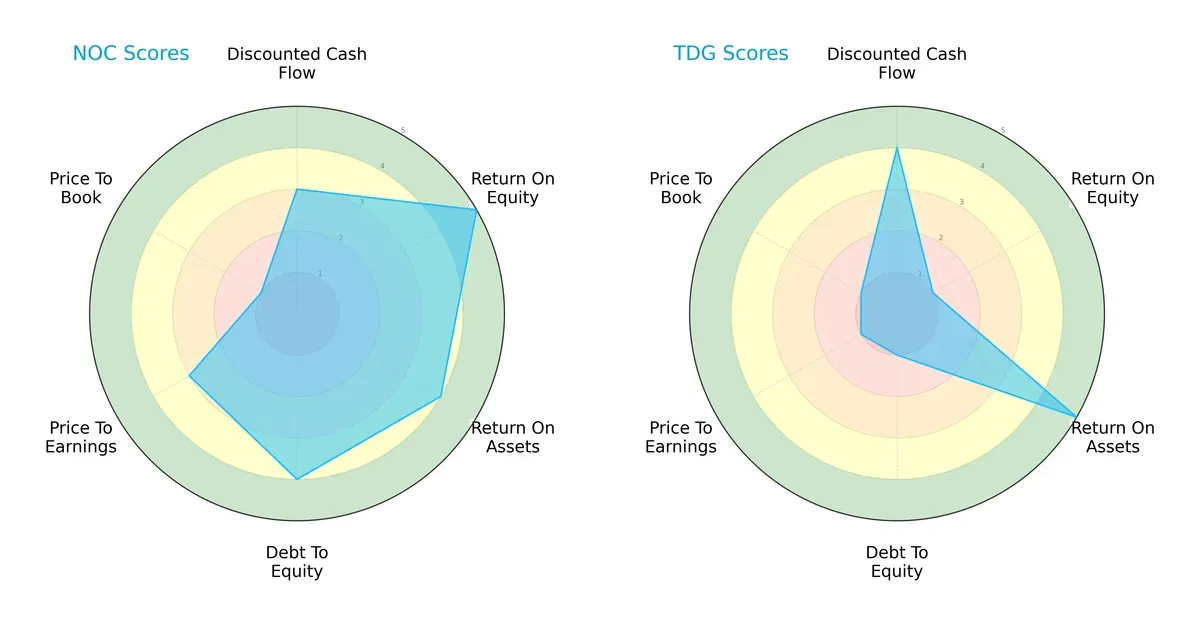
Northrop Grumman shows a balanced profile with strong ROE (5) and ROA (4), healthy debt management (4), and moderate valuation scores. TransDigm relies heavily on asset efficiency (ROA 5) and discounted cash flow (4) but struggles with equity returns (1) and debt levels (1). Northrop’s overall score (4) outperforms TransDigm’s (2), reflecting a more stable and diversified financial foundation.
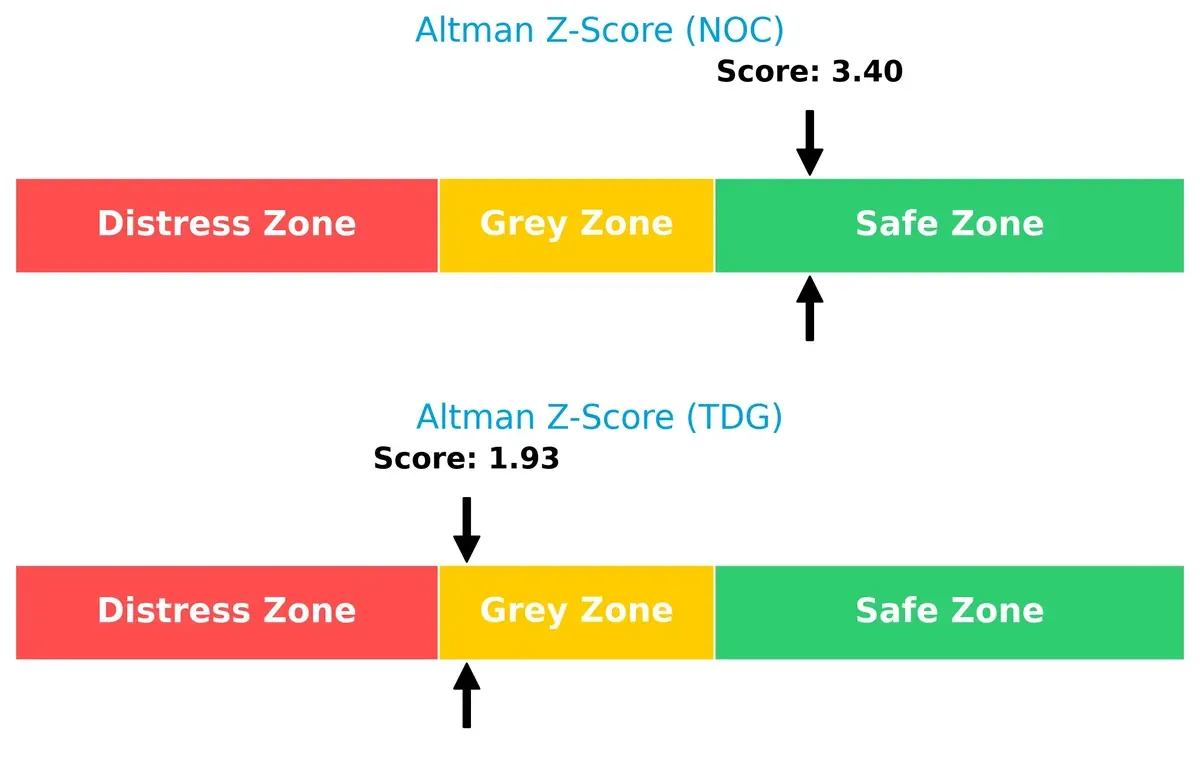
Bankruptcy Risk: Solvency Showdown
Northrop Grumman’s Altman Z-Score (3.40) places it firmly in the safe zone, signaling strong long-term survival prospects. TransDigm’s score (1.93) lies in the grey zone, indicating moderate financial distress risk in the current cycle:
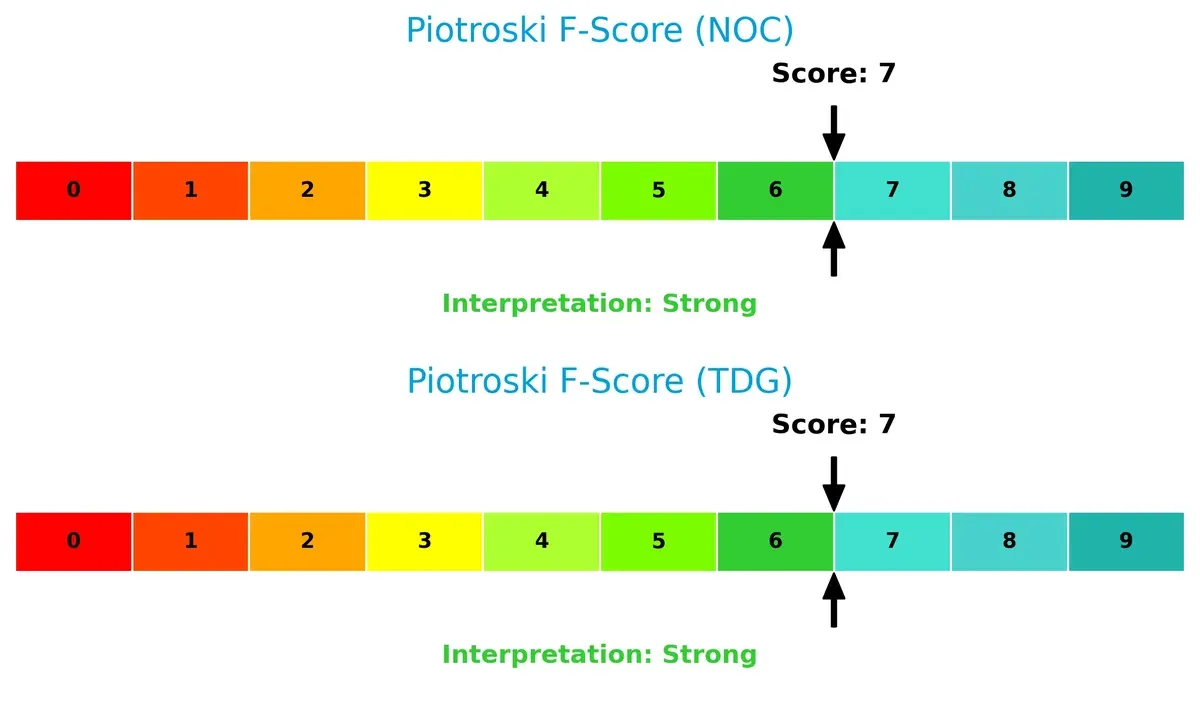
Financial Health: Quality of Operations
Both companies post strong Piotroski F-Scores of 7, signaling solid operational quality and internal financial health. Neither shows immediate red flags, but Northrop’s higher overall stability adds confidence to its financial strength:
How are the two companies positioned?
This section dissects the operational DNA of Northrop Grumman and TransDigm by comparing revenue distribution and internal dynamics. The goal is to confront their economic moats and identify which model offers the most resilient, sustainable competitive advantage today.
Revenue Segmentation: The Strategic Mix
This comparison dissects how Northrop Grumman and TransDigm diversify income streams, highlighting their primary sector bets and strategic focus in aerospace and defense:
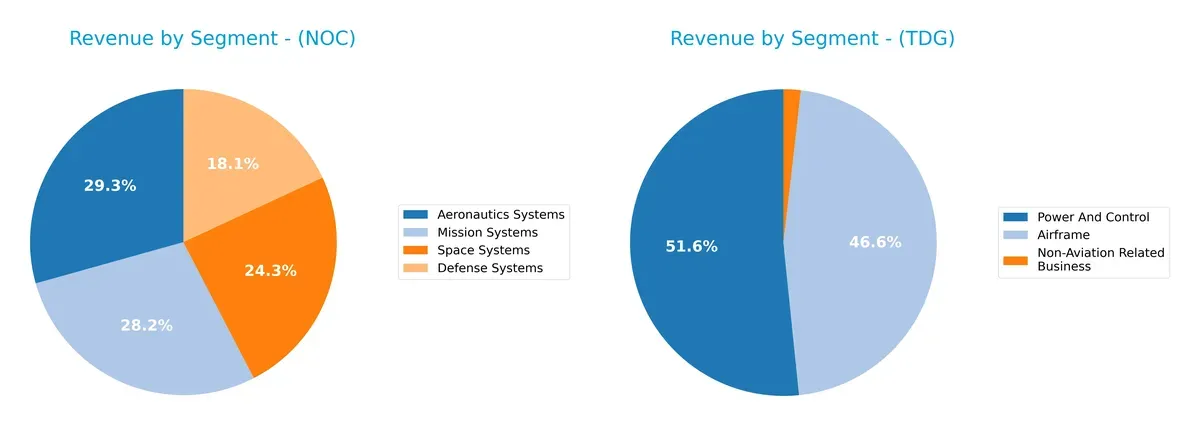
Northrop Grumman’s revenue spreads across Aeronautics Systems ($13B), Mission Systems ($12.5B), Space Systems ($10.8B), and Defense Systems ($8B), showing strong diversification. TransDigm pivots mainly on two segments: Power And Control ($4.6B) and Airframe ($4.1B), with a small non-aviation slice ($160M). Northrop’s broad base supports ecosystem lock-in and mitigates concentration risk. TransDigm, while focused, risks volatility from dependency on aviation markets.
Strengths and Weaknesses Comparison
This table compares the Strengths and Weaknesses of Northrop Grumman Corporation (NOC) and TransDigm Group Incorporated (TDG):
NOC Strengths
- Diversified revenue streams across Aeronautics, Defense, Mission, and Space Systems
- Favorable ROE of 25.08% indicating strong profitability
- WACC at 4.51% supports value creation
- Global presence with significant US and Europe sales
TDG Strengths
- High net margin at 23.49% shows strong profitability
- Favorable ROIC of 15.22% above WACC of 6.98%
- Strong quick ratio at 2.25 indicating liquidity
- Higher fixed asset turnover at 5.59 reflecting asset efficiency
NOC Weaknesses
- Unfavorable debt-to-equity ratio at 1.18 and PB at 4.91 suggest leverage concerns
- Neutral current and quick ratios near 1 may indicate liquidity risk
- Asset turnover at 0.82 is moderate, limiting revenue generation per asset
- Market largely US-centric with less geographic diversification
TDG Weaknesses
- Negative ROE at -21.41% raises profitability concerns
- Unfavorable debt-to-assets at 131.08% signals high leverage risk
- High PE of 36.99 may imply overvaluation
- Lower asset turnover at 0.39 signals less efficient asset use
Both companies show slightly favorable financial profiles, but NOC’s diversified segments and better leverage metrics contrast with TDG’s profitability and liquidity strengths offset by high leverage and valuation risks. This dynamic shapes their strategic focus on balancing growth with financial stability.
The Moat Duel: Analyzing Competitive Defensibility
A structural moat is the only reliable shield preserving long-term profits from relentless competition erosion. Let’s dissect the core moats of two aerospace giants:
Northrop Grumman Corporation: Integrated Defense Systems Moat
Northrop Grumman’s moat stems from complex, high-barrier defense contracts and proprietary aerospace tech. Its steady ROIC above WACC confirms value creation despite a declining trend. Expansion into hypersonic and cyber systems could deepen its moat but demands vigilance.
TransDigm Group Incorporated: Specialized Components Cost Advantage
TransDigm’s cost advantage and pricing power in niche aerospace components drive its soaring ROIC and margin expansion. Unlike Northrop, it leverages proprietary parts with limited substitutes. Its rising ROIC trend and aggressive acquisitions signal a robust, widening moat with global growth potential.
Integrated Defense Complexity vs. Specialized Component Dominance
TransDigm holds a deeper, more scalable moat propelled by superior ROIC growth and margin dominance. Northrop creates value but faces pressure from declining profitability. TransDigm is better positioned to defend and expand its market share in 2026.
Which stock offers better returns?
Over the past year, Northrop Grumman and TransDigm displayed notable price movements with distinct bullish trends and differing volume dynamics.
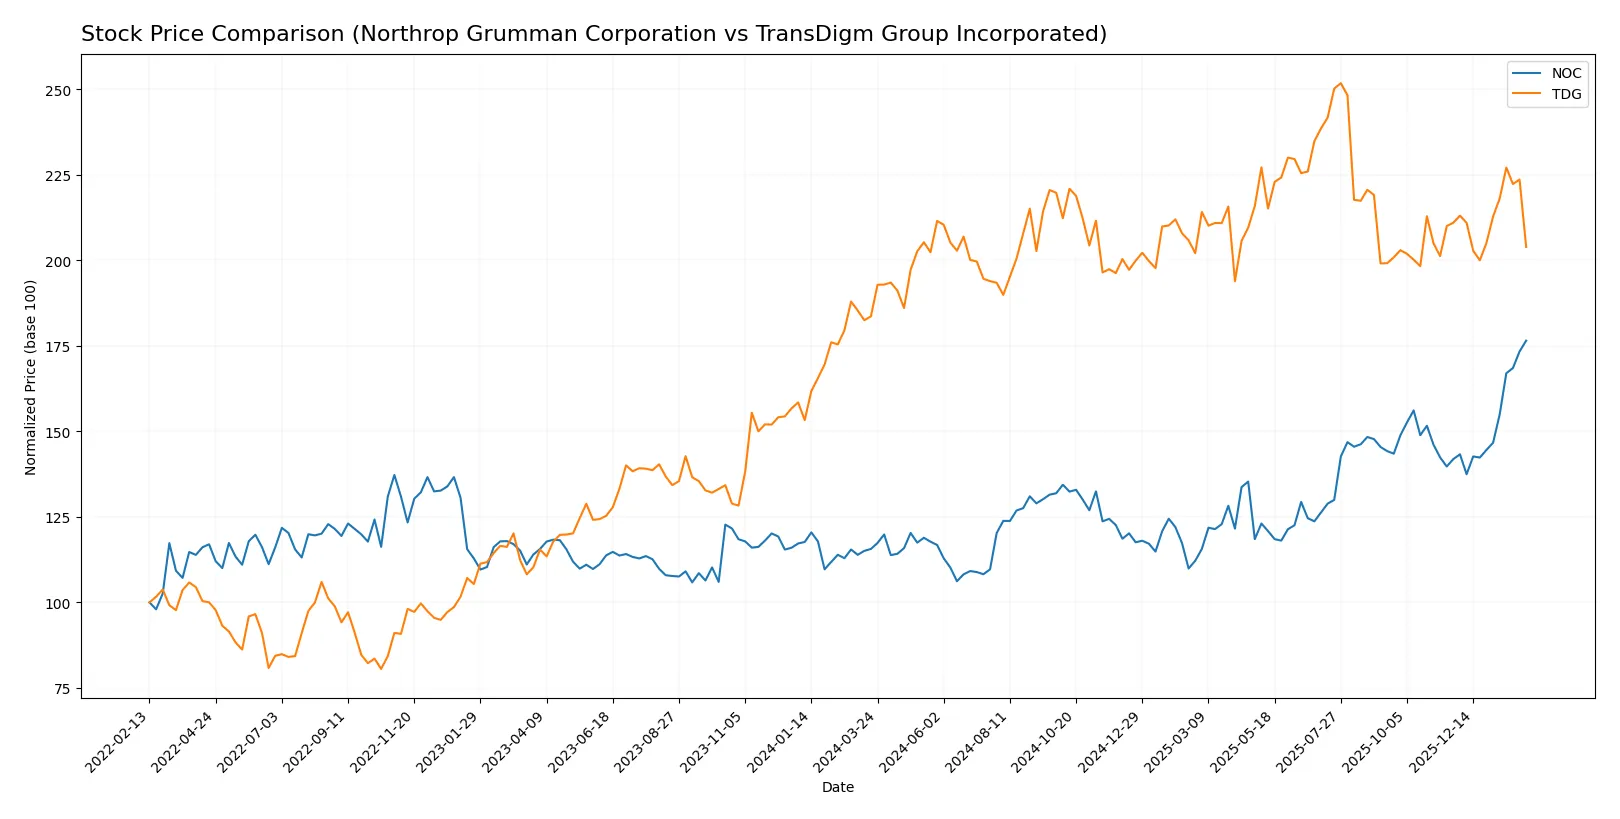
Trend Comparison
Northrop Grumman’s stock rose 52.68% over the past 12 months, showing a strong bullish trend with accelerating gains and a high volatility level (std dev 60.26). The price peaked at 704.98 and bottomed at 424.09, indicating robust upward momentum.
TransDigm’s stock gained 11.07% over the last year, also bullish with acceleration but greater volatility (std dev 85.64). The price ranged from 1172.2 to 1607.45, reflecting steadier growth but less pronounced than Northrop Grumman’s.
Comparing both, Northrop Grumman delivered substantially higher returns and stronger price acceleration, outperforming TransDigm in market performance over the same period.
Target Prices
Analysts present a bullish consensus for Northrop Grumman Corporation and TransDigm Group Incorporated.
| Company | Target Low | Target High | Consensus |
|---|---|---|---|
| Northrop Grumman Corporation | 623 | 815 | 732.25 |
| TransDigm Group Incorporated | 1370 | 1871 | 1579.11 |
The target consensus for Northrop Grumman sits about 4% above its current price of 705, signaling moderate upside potential. TransDigm’s consensus target exceeds its price by roughly 21%, reflecting strong analyst optimism despite recent price weakness.

Don’t Let Luck Decide Your Entry Point
Optimize your entry points with our advanced ProRealTime indicators. You’ll get efficient buy signals with precise price targets for maximum performance. Start outperforming now!
How do institutions grade them?
Northrop Grumman Corporation Grades
The following table summarizes recent grades given by major financial institutions:
| Grading Company | Action | New Grade | Date |
|---|---|---|---|
| Jefferies | Maintain | Hold | 2026-02-02 |
| RBC Capital | Maintain | Outperform | 2026-01-28 |
| Citigroup | Maintain | Buy | 2026-01-28 |
| UBS | Maintain | Buy | 2026-01-28 |
| B of A Securities | Maintain | Buy | 2026-01-28 |
| BTIG | Maintain | Buy | 2026-01-28 |
| UBS | Maintain | Buy | 2026-01-15 |
| Citigroup | Maintain | Buy | 2026-01-13 |
| Truist Securities | Downgrade | Hold | 2026-01-09 |
| Morgan Stanley | Maintain | Overweight | 2025-12-16 |
TransDigm Group Incorporated Grades
The following table summarizes recent grades given by major financial institutions:
| Grading Company | Action | New Grade | Date |
|---|---|---|---|
| UBS | Maintain | Buy | 2026-01-15 |
| JP Morgan | Maintain | Neutral | 2025-11-14 |
| Morgan Stanley | Maintain | Overweight | 2025-11-14 |
| BMO Capital | Maintain | Outperform | 2025-11-13 |
| Stifel | Maintain | Buy | 2025-11-13 |
| RBC Capital | Maintain | Sector Perform | 2025-11-13 |
| UBS | Maintain | Buy | 2025-11-13 |
| Truist Securities | Maintain | Buy | 2025-10-15 |
| Morgan Stanley | Maintain | Overweight | 2025-10-15 |
| Susquehanna | Maintain | Neutral | 2025-10-09 |
Which company has the best grades?
Northrop Grumman has more consistent buy and outperform ratings from several top-tier institutions. TransDigm shows a wider range from neutral to outperform. Investors may view Northrop Grumman’s grades as stronger validation of growth prospects.
Risks specific to each company
The following categories identify the critical pressure points and systemic threats facing both firms in the 2026 market environment:
1. Market & Competition
Northrop Grumman Corporation
- Operates in a highly competitive aerospace & defense sector with strong incumbents and government reliance.
TransDigm Group Incorporated
- Faces intense competition in aircraft components, with less diversification and exposure to niche markets.
2. Capital Structure & Debt
Northrop Grumman Corporation
- Moderate leverage with debt-to-equity at 1.18, interest coverage strong at 8.62.
TransDigm Group Incorporated
- Negative debt-to-equity ratio suggests complex capital structure; debt-to-assets extremely high at 131%, signaling risk.
3. Stock Volatility
Northrop Grumman Corporation
- Very low beta (0.039) indicates stable stock with low market sensitivity.
TransDigm Group Incorporated
- Higher beta (0.897) implies greater stock price volatility and market risk.
4. Regulatory & Legal
Northrop Grumman Corporation
- Subject to stringent defense regulations and government contract scrutiny.
TransDigm Group Incorporated
- Faces regulatory risks tied to aerospace safety standards and export controls.
5. Supply Chain & Operations
Northrop Grumman Corporation
- Complex global supply chain for advanced systems; vulnerable to geopolitical disruptions.
TransDigm Group Incorporated
- Relies on specialized suppliers; operational risks elevated by concentration in aircraft components.
6. ESG & Climate Transition
Northrop Grumman Corporation
- Increasing pressure to improve emissions and sustainable defense manufacturing.
TransDigm Group Incorporated
- ESG initiatives less transparent; potential exposure to climate transition risks in manufacturing.
7. Geopolitical Exposure
Northrop Grumman Corporation
- High exposure to U.S. defense budgets and international security dynamics.
TransDigm Group Incorporated
- Geopolitical risks present but more limited due to narrower product scope and customer base.
Which company shows a better risk-adjusted profile?
Northrop Grumman’s key risk is moderate leverage balanced by strong interest coverage and stable stock behavior. TransDigm struggles with an unsustainable capital structure and elevated debt, raising financial distress concerns. Northrop’s Altman Z-score in the safe zone versus TransDigm’s grey zone confirms better risk management. Despite TransDigm’s higher net margin, its debt-to-assets ratio surpassing 100% and significant stock volatility flag higher risk. I see Northrop as the safer, more balanced investment in 2026.
Final Verdict: Which stock to choose?
Northrop Grumman’s superpower lies in its robust capital efficiency and consistent value creation. Its slightly declining ROIC signals a need for vigilance on profitability trends. This stock suits investors seeking steady exposure in Aerospace & Defense with moderate growth ambitions.
TransDigm commands a strategic moat through its high-margin, niche aerospace components and expanding profitability. Despite a higher leverage risk, its accelerating ROIC growth offers a compelling narrative for risk-tolerant investors. It fits well in GARP portfolios prioritizing strong cash flow and durable competitive advantages.
If you prioritize capital efficiency and a historically stable moat, Northrop Grumman is the compelling choice due to its solid returns and financial resilience. However, if you seek superior growth potential with a willingness to navigate higher leverage, TransDigm offers better scalability and expanding profitability. Both present slightly favorable scenarios but cater to distinct investor risk profiles.
Disclaimer: Investment carries a risk of loss of initial capital. The past performance is not a reliable indicator of future results. Be sure to understand risks before making an investment decision.
Go Further
I encourage you to read the complete analyses of Northrop Grumman Corporation and TransDigm Group Incorporated to enhance your investment decisions: