Home > Comparison > Industrials > BA vs NOC
The strategic rivalry between The Boeing Company and Northrop Grumman Corporation shapes the Aerospace & Defense sector’s future. Boeing operates as a diversified industrial giant with commercial jetliners and global services. Northrop Grumman focuses on high-tech defense systems and advanced aerospace solutions. This analysis pits Boeing’s scale against Northrop’s innovation to determine which offers the superior risk-adjusted profile for a balanced industrial portfolio.
Table of contents
Companies Overview
The Boeing Company and Northrop Grumman Corporation lead in aerospace and defense innovation and production.
The Boeing Company: Aerospace & Defense Giant
Boeing dominates as a commercial jetliner and military aircraft manufacturer. Its revenue mainly stems from commercial airplanes and defense, space, and security segments. In 2026, Boeing focused strategically on expanding global services and enhancing aerospace technology to maintain its leadership in commercial and defense aviation markets.
Northrop Grumman Corporation: Defense Systems Innovator
Northrop Grumman excels in aerospace and defense systems integration, specializing in unmanned aircraft and missile defense. Revenue derives from aeronautics, defense systems, mission systems, and space systems. In 2026, Northrop emphasized advanced mission systems and cyber capabilities to secure its competitive edge in strategic defense and intelligence solutions.
Strategic Collision: Similarities & Divergences
Boeing pursues a broad aerospace ecosystem combining commercial and defense sectors, while Northrop Grumman prioritizes specialized defense technologies and cyber warfare. Their main battleground lies in military aircraft and missile defense contracts. Boeing offers scale and diversification; Northrop Grumman provides focused innovation and resilience, crafting distinct investment profiles in the aerospace and defense domain.
Income Statement Comparison
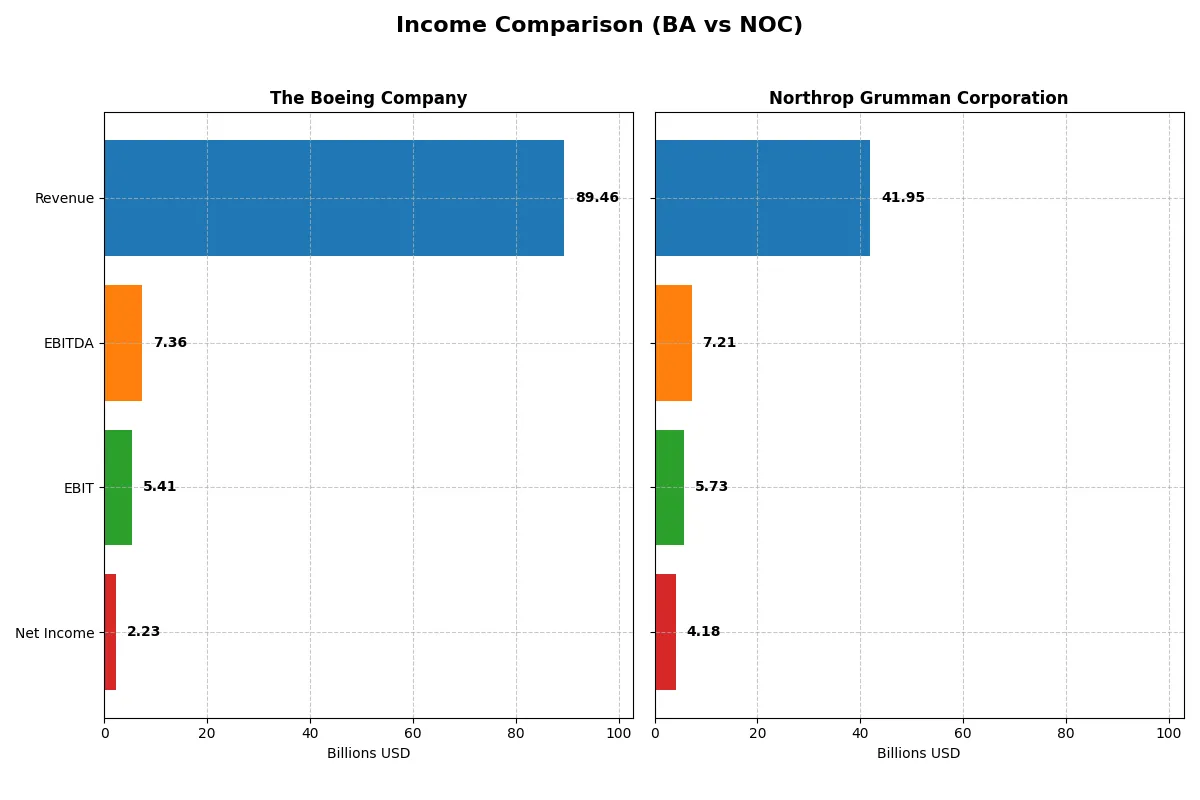
This data dissects the core profitability and scalability of both corporate engines to reveal who dominates the bottom line:
| Metric | The Boeing Company (BA) | Northrop Grumman Corporation (NOC) |
|---|---|---|
| Revenue | 89.5B | 41.9B |
| Cost of Revenue | 85.2B | 33.6B |
| Operating Expenses | 9.7B | 4.0B |
| Gross Profit | 4.3B | 8.3B |
| EBITDA | 7.4B | 7.2B |
| EBIT | 5.4B | 5.7B |
| Interest Expense | 2.8B | 0.7B |
| Net Income | 2.2B | 4.2B |
| EPS | 2.49 | 29.14 |
| Fiscal Year | 2025 | 2025 |
Income Statement Analysis: The Bottom-Line Duel
This income statement comparison reveals which company operates its business with superior efficiency and profitability over recent years.
The Boeing Company Analysis
Boeing’s revenue surged from 62B in 2021 to 89B in 2025, reflecting strong growth momentum. Net income swung from heavy losses to a positive 2.2B in 2025, signaling a robust turnaround. Margins remain thin, with a gross margin at 4.8% and net margin at 2.5%, but improving rapidly. Efficiency gains and cost control underpin the recent profitability rebound.
Northrop Grumman Corporation Analysis
Northrop Grumman’s revenue grew modestly from 35.7B in 2021 to 42B in 2025, showing steady but slower expansion. Net income declined overall, down 40% over five years, ending at 4.2B in 2025. Margins are healthier than Boeing’s, with a 19.8% gross margin and near 10% net margin, highlighting better profitability per dollar earned. However, recent margin contraction and flat revenue growth limit momentum.
Turnaround Growth vs. Steady Margin Strength
Boeing leads on growth and margin improvement, recovering from losses to post positive earnings with accelerating revenue. Northrop Grumman offers stronger margins but faces stagnating revenue and declining net income. Investors seeking upside may favor Boeing’s expansion profile, while those prioritizing margin stability might lean toward Northrop Grumman’s consistent profitability.
Financial Ratios Comparison
These vital ratios act as a diagnostic tool to expose the underlying fiscal health, valuation premiums, and capital efficiency of the companies compared below:
| Ratios | The Boeing Company (BA) | Northrop Grumman Corporation (NOC) |
|---|---|---|
| ROE | 41.0% | 25.1% |
| ROIC | -6.7% | 9.9% |
| P/E | 74.1 | 19.6 |
| P/B | 30.3 | 4.91 |
| Current Ratio | 1.27 | 1.10 |
| Quick Ratio | 0.49 | 1.10 |
| D/E (Debt-to-Equity) | 9.92 | 0.11 |
| Debt-to-Assets | 32.2% | 3.6% |
| Interest Coverage | -1.95 | -6.78 |
| Asset Turnover | 0.53 | 0.82 |
| Fixed Asset Turnover | 5.73 | 3.27 |
| Payout Ratio | 14.8% | 30.9% |
| Dividend Yield | 0.20% | 1.58% |
| Fiscal Year | 2025 | 2025 |
Efficiency & Valuation Duel: The Vital Signs
Financial ratios act as the company’s DNA, unveiling hidden risks and operational excellence critical for informed investment decisions.
The Boeing Company
Boeing delivers an impressive ROE near 41%, signaling strong profitability. However, its net margin is weak at 2.5%, and ROIC is negative, indicating poor capital efficiency. The stock trades at a stretched P/E of 74 and a high P/B of 30, reflecting expensive valuation. Boeing offers a minimal 0.2% dividend yield, suggesting limited current payouts amid reinvestment challenges.
Northrop Grumman Corporation
Northrop Grumman posts a solid 25% ROE with a healthy net margin near 10%. Its ROIC of almost 10% exceeds WACC at 4.5%, confirming efficient capital use. The P/E of 19.6 appears reasonable, though the P/B at 4.9 is somewhat elevated. The company maintains a 1.58% dividend yield, balancing shareholder returns with operational stability.
Premium Valuation vs. Operational Safety
Boeing’s high valuation contrasts with weak capital returns and profitability, signaling elevated risk. Northrop Grumman offers a better balance with solid returns, efficient capital use, and moderate valuation. Investors seeking operational safety and consistent yield will find Northrop’s profile more fitting.
Which one offers the Superior Shareholder Reward?
I observe Boeing (BA) rarely pays dividends, yielding a meager 0.2% in 2025, with a modest payout ratio of 14.8%. Its free cash flow per share is negative at -2.46, signaling limited capacity to sustain distributions or buybacks. Conversely, Northrop Grumman (NOC) offers a 1.58% dividend yield with a prudent 30.9% payout ratio, funded by robust free cash flow of 23/share. NOC also deploys substantial capital in buybacks, enhancing total shareholder returns. Boeing’s distribution strategy leans on reinvestment amid financial stress, while NOC balances growth and shareholder payouts sustainably. For 2026, I favor Northrop Grumman for superior, durable shareholder reward.
Comparative Score Analysis: The Strategic Profile
The radar chart reveals the fundamental DNA and trade-offs of The Boeing Company and Northrop Grumman Corporation, highlighting their financial strengths and vulnerabilities:
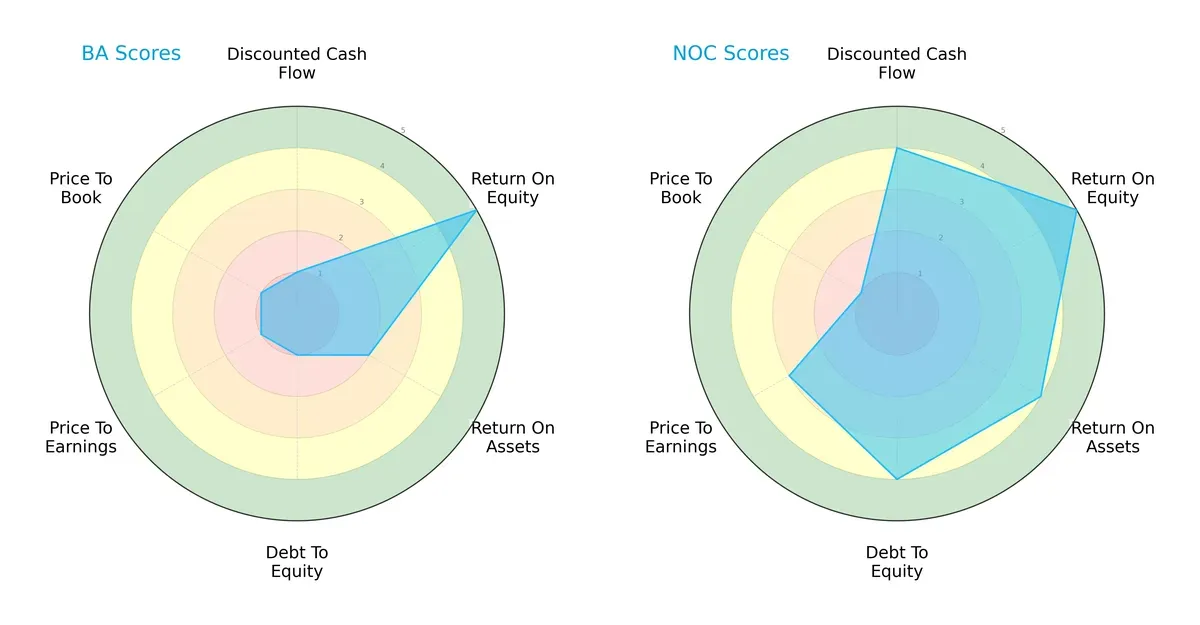
Northrop Grumman exhibits a more balanced financial profile with strong DCF, ROA, and debt-to-equity scores. Boeing relies heavily on its ROE strength but struggles with valuation and leverage metrics. Northrop’s diversified edge offers greater stability compared to Boeing’s concentrated financial risks.
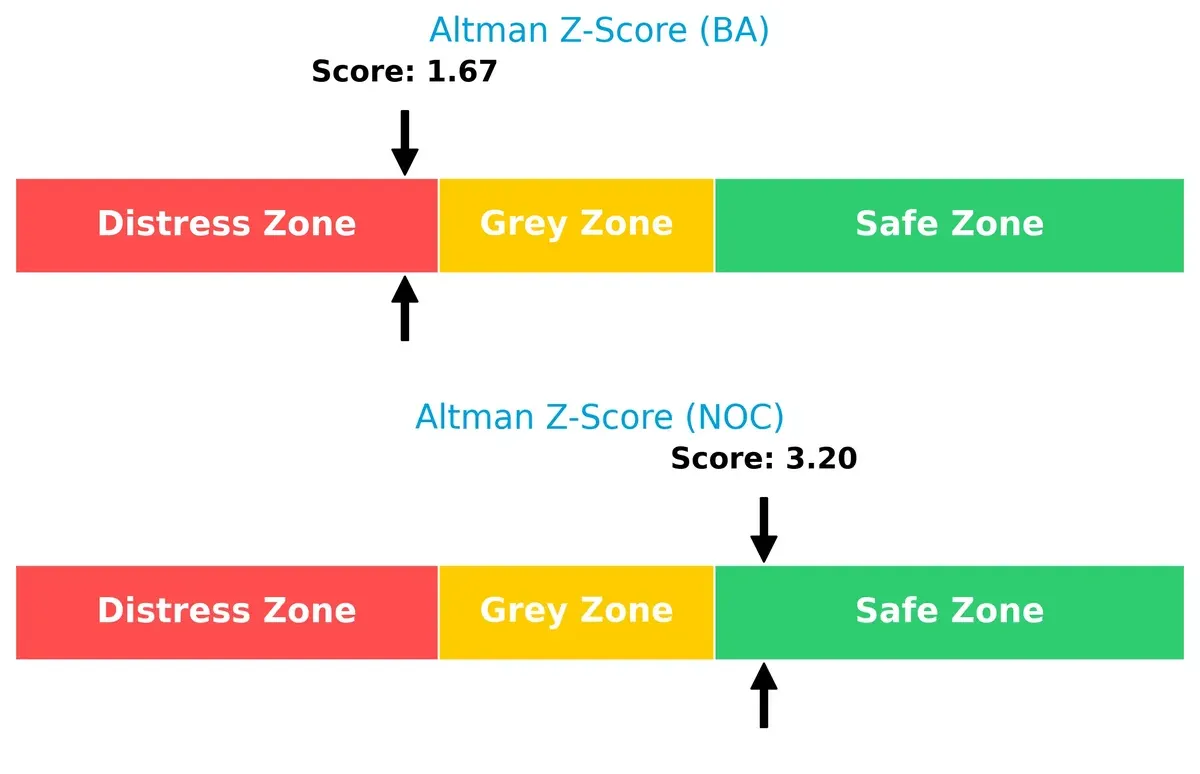
Bankruptcy Risk: Solvency Showdown
Northrop Grumman’s Altman Z-Score of 3.2 signals solid solvency and low bankruptcy risk, while Boeing’s 1.67 places it in distress, indicating elevated financial vulnerability in this cycle:
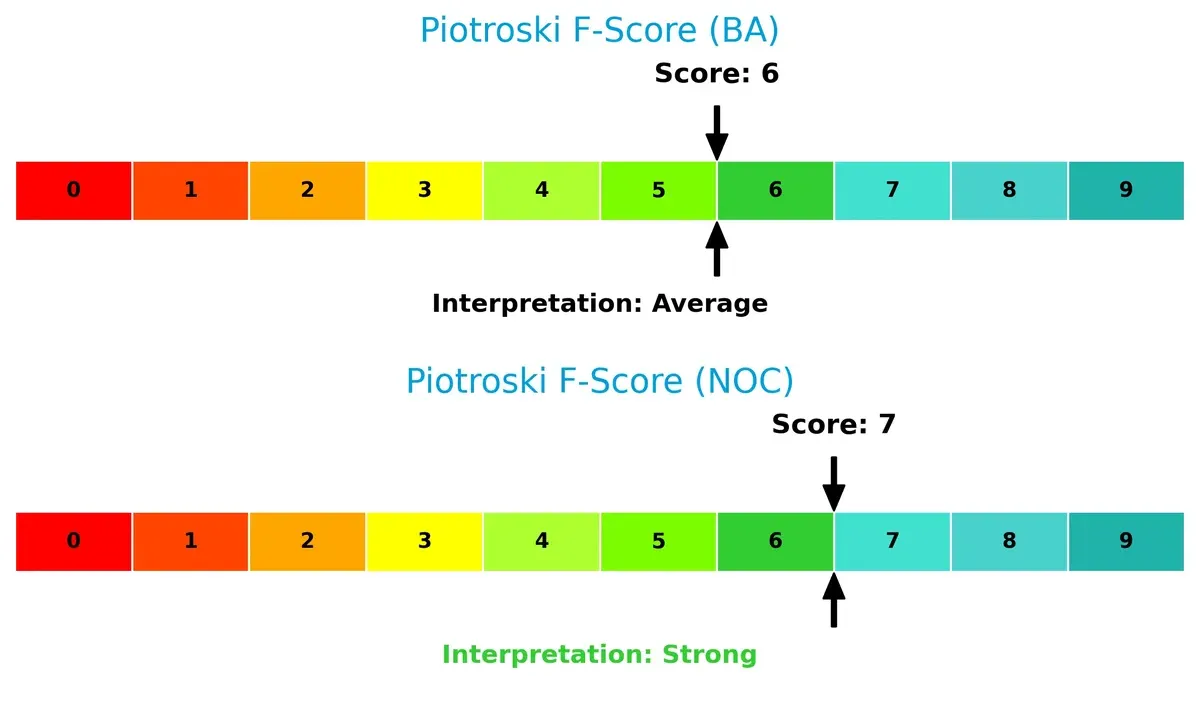
Financial Health: Quality of Operations
Northrop Grumman’s Piotroski F-Score of 7 reflects strong operational health and sound internal metrics, surpassing Boeing’s average score of 6, which hints at potential red flags in Boeing’s financial quality:
How are the two companies positioned?
This section dissects the operational DNA of Boeing and Northrop Grumman by comparing their revenue distribution and internal dynamics. The goal is to confront their economic moats to reveal the most resilient, sustainable advantage today.
Revenue Segmentation: The Strategic Mix
This visual comparison dissects how The Boeing Company and Northrop Grumman diversify their income streams and reveals where their primary sector bets lie:
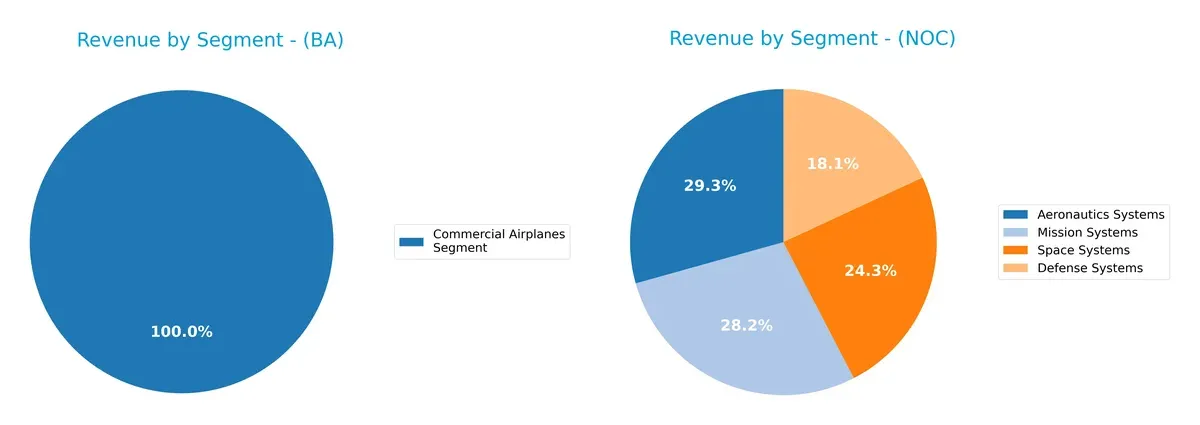
Boeing’s revenue pivots heavily on its Commercial Airplanes segment, generating $41.5B in 2025, dwarfing its other divisions. In contrast, Northrop Grumman spreads income more evenly across Aeronautics Systems ($13B), Mission Systems ($12.5B), and Space Systems ($10.8B). Boeing’s concentration signals exposure to commercial aviation cycles, whereas Northrop Grumman’s diversified mix reduces risk and underpins its defense ecosystem dominance. This strategic divergence highlights Boeing’s higher concentration risk versus Northrop Grumman’s balanced portfolio.
Strengths and Weaknesses Comparison
This table compares the Strengths and Weaknesses of The Boeing Company and Northrop Grumman Corporation:
Boeing Strengths
- Diverse revenue sources across commercial airplanes, defense, and global services
- Strong global presence with significant US and international sales
- High ROE indicates efficient equity use
- Favorable fixed asset turnover shows productive capital use
Northrop Grumman Strengths
- Balanced revenue from aeronautics, defense, mission, and space systems
- Strong financial health with favorable debt ratios and interest coverage
- High ROE and ROIC above WACC reflect solid profitability
- Innovation evident in diverse technology segments
Boeing Weaknesses
- Low net margin and negative ROIC signal profitability challenges
- High P/E and P/B ratios suggest overvaluation risks
- Weak quick ratio and interest coverage raise liquidity concerns
- High debt-to-equity ratio adds financial risk
Northrop Grumman Weaknesses
- PB ratio unfavorable, indicating potential market undervaluation
- Net margin and some ratios only neutral, less robust than ROE and ROIC
- Limited geographic revenue diversity compared to Boeing
Overall, Boeing shows strong diversification and asset productivity but faces profitability and liquidity pressures. Northrop Grumman demonstrates solid financial stability and efficient capital allocation with slightly less geographic diversification. Both companies exhibit strengths aligned with their strategic focuses but also carry distinct financial risks requiring attention.
The Moat Duel: Analyzing Competitive Defensibility
A structural moat is the only reliable shield protecting long-term profits from relentless competitive pressure and market disruption:
The Boeing Company: Scale and Diversification Moat
Boeing leverages diversified aerospace segments and global scale, reflected in its stable margins and surging revenue growth of 34% in 2025. Yet, its declining ROIC highlights value destruction, risking moat erosion unless innovation accelerates in defense and space.
Northrop Grumman Corporation: Technology and Integration Moat
Northrop’s moat stems from advanced technology integration and defense systems specialization, delivering 10% net margin and positive ROIC versus WACC. Despite recent margin pressure, its focused portfolio supports sustainable value creation and strategic expansion in ISR and hypersonics.
Verdict: Scale Diversification vs. Technological Specialization
Northrop’s deeper moat rests on efficient capital use and superior returns, while Boeing’s vast scale struggles with profitability. I see Northrop better positioned to defend and extend its market share into 2026.
Which stock offers better returns?
The past year shows strong bullish momentum for both stocks, with Northrop Grumman surging higher and Boeing steadily accelerating, reflecting distinct trading dynamics and volume trends.
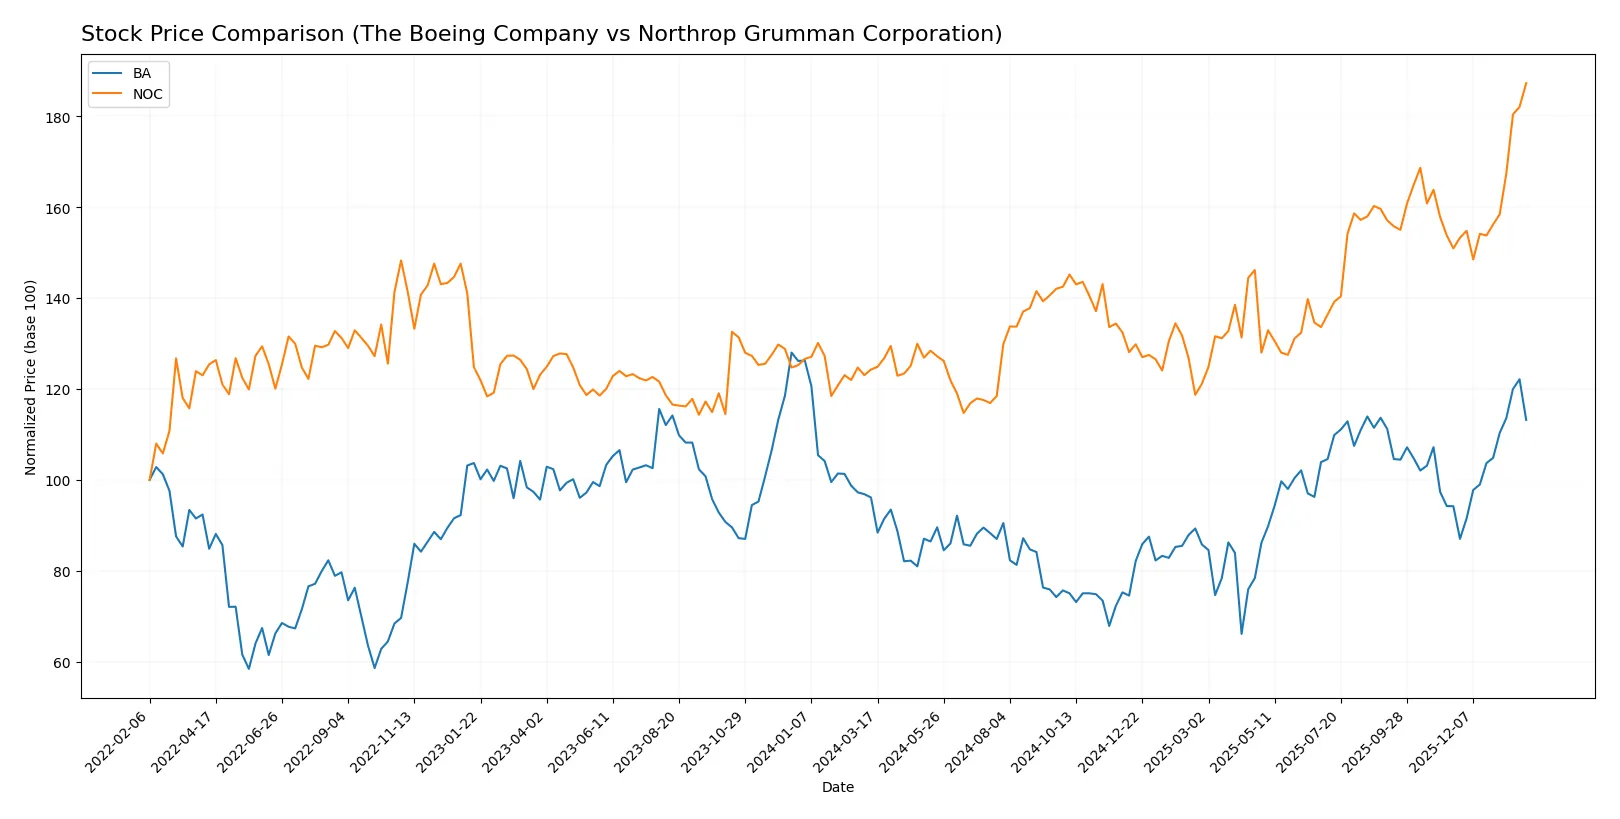
Trend Comparison
The Boeing Company’s stock rose 17.75% over the past 12 months, showing a clear bullish trend with accelerating momentum and a price range between 136.59 and 252.15. Trading volume is increasing, with recent strong buyer dominance.
Northrop Grumman Corporation’s stock gained 50.66% over the last year, also bullish with acceleration. Volatility is higher, ranging from 424.09 to 692.26, while volume trends decreased but showed strong buyer dominance recently.
Northrop Grumman outperformed Boeing, delivering substantially higher returns and stronger recent price acceleration despite lower overall volume trends.
Target Prices
Analysts show a positive outlook with solid upside potential for both The Boeing Company and Northrop Grumman Corporation.
| Company | Target Low | Target High | Consensus |
|---|---|---|---|
| The Boeing Company | 150 | 298 | 256.73 |
| Northrop Grumman Corporation | 623 | 815 | 736.09 |
The Boeing’s consensus target of 257 exceeds the current price of 234, indicating upside potential. Northrop Grumman’s consensus near 736 also suggests room for appreciation from its current 692 price.

Don’t Let Luck Decide Your Entry Point
Optimize your entry points with our advanced ProRealTime indicators. You’ll get efficient buy signals with precise price targets for maximum performance. Start outperforming now!
How do institutions grade them?
This section compares recent institutional grades for The Boeing Company and Northrop Grumman Corporation:
The Boeing Company Grades
The following table summarizes recent grades issued by major financial institutions for Boeing:
| Grading Company | Action | New Grade | Date |
|---|---|---|---|
| Citigroup | Maintain | Buy | 2026-01-28 |
| UBS | Maintain | Buy | 2026-01-28 |
| RBC Capital | Maintain | Outperform | 2026-01-28 |
| JP Morgan | Maintain | Overweight | 2026-01-28 |
| Bernstein | Maintain | Outperform | 2026-01-15 |
| Citigroup | Maintain | Buy | 2026-01-13 |
| JP Morgan | Maintain | Overweight | 2025-12-19 |
| Susquehanna | Maintain | Positive | 2025-11-12 |
| Freedom Capital Markets | Upgrade | Buy | 2025-11-03 |
| JP Morgan | Maintain | Overweight | 2025-10-30 |
Northrop Grumman Corporation Grades
Below is a summary of recent institutional grades for Northrop Grumman:
| Grading Company | Action | New Grade | Date |
|---|---|---|---|
| B of A Securities | Maintain | Buy | 2026-01-28 |
| BTIG | Maintain | Buy | 2026-01-28 |
| UBS | Maintain | Buy | 2026-01-28 |
| RBC Capital | Maintain | Outperform | 2026-01-28 |
| Citigroup | Maintain | Buy | 2026-01-28 |
| UBS | Maintain | Buy | 2026-01-15 |
| Citigroup | Maintain | Buy | 2026-01-13 |
| Truist Securities | Downgrade | Hold | 2026-01-09 |
| Morgan Stanley | Maintain | Overweight | 2025-12-16 |
| Alembic Global | Upgrade | Overweight | 2025-12-15 |
Which company has the best grades?
Both companies enjoy predominantly positive grades, with numerous buys and outperforms. Boeing’s ratings show consistent buy and outperform calls without downgrades. Northrop Grumman has mostly buy and outperform grades but includes a recent hold downgrade, indicating slightly more caution. Investors may interpret Boeing’s steadier upgrades as stronger institutional confidence.
Risks specific to each company
The following categories identify critical pressure points and systemic threats facing both firms in the 2026 market environment:
1. Market & Competition
The Boeing Company
- Faces intense competition in commercial airplanes and defense sectors, with margin pressures and innovation demands.
Northrop Grumman Corporation
- Competes primarily in defense with specialized tech; benefits from steady government contracts but faces evolving threats.
2. Capital Structure & Debt
The Boeing Company
- High debt-to-equity ratio (9.92) signals elevated leverage and financial risk; weak interest coverage at 1.95x is concerning.
Northrop Grumman Corporation
- Low debt levels (0.11 D/E) and strong interest coverage (8.62x) imply a conservative and stable capital structure.
3. Stock Volatility
The Boeing Company
- Beta of 1.163 indicates above-market volatility; wide price range (128.88-254.35) reflects market uncertainty.
Northrop Grumman Corporation
- Extremely low beta (0.049) suggests stock stability and less sensitivity to market swings.
4. Regulatory & Legal
The Boeing Company
- Subject to intense scrutiny from aviation regulators and government agencies; past quality and safety issues pose ongoing risks.
Northrop Grumman Corporation
- Faces regulatory oversight typical of defense contractors; fewer public controversies but must comply with complex defense regulations.
5. Supply Chain & Operations
The Boeing Company
- Vulnerable to supply disruptions impacting commercial and defense production; operational complexity across multiple segments increases risk.
Northrop Grumman Corporation
- Operations focused on defense systems and aerospace with robust supply chain controls; less exposed to global commercial disruptions.
6. ESG & Climate Transition
The Boeing Company
- Increasing pressure to reduce carbon footprint in commercial aviation; ESG demands may raise costs and affect brand reputation.
Northrop Grumman Corporation
- Faces ESG risks related to defense manufacturing and sustainability; less exposed to climate transition pressures than commercial aviation.
7. Geopolitical Exposure
The Boeing Company
- Exposed to international trade tensions affecting commercial sales and global supply chains; defense exports subject to geopolitical risks.
Northrop Grumman Corporation
- Geopolitical risks inherent in defense contracts and international arms sales; generally benefits from increased defense budgets amid tensions.
Which company shows a better risk-adjusted profile?
Northrop Grumman faces lower financial and market risks, supported by a conservative capital structure and stable stock volatility. Boeing’s high leverage, operational complexity, and volatile market exposure raise red flags. Boeing’s most impactful risk is its fragile financial health, evidenced by weak interest coverage and unfavorable ROIC. Northrop Grumman’s key risk lies in geopolitical exposure but is offset by solid financial metrics. The contrast in Altman Z-Scores—Boeing in distress zone (1.67) versus Northrop in safe zone (3.20)—confirms Northrop’s superior risk-adjusted profile.
Final Verdict: Which stock to choose?
The Boeing Company’s superpower lies in its ability to bounce back with strong revenue and earnings growth, reflecting resilience amid industry headwinds. However, its declining ROIC and high leverage remain points of vigilance. It suits investors with an appetite for turnaround stories and aggressive growth plays.
Northrop Grumman stands out with a strategic moat built on consistent value creation and robust free cash flow generation. Its lower financial risk profile and solid profitability offer better stability than Boeing. This stock fits well in a GARP (Growth at a Reasonable Price) portfolio seeking steady returns with moderate risk.
If you prioritize aggressive growth and can tolerate volatility, Boeing offers a compelling scenario thanks to its recent operational momentum. However, if you seek a more stable investment with a durable competitive advantage and healthier financials, Northrop Grumman outshines as the safer choice. Both require careful risk management given sector cyclicality and company-specific challenges.
Disclaimer: Investment carries a risk of loss of initial capital. The past performance is not a reliable indicator of future results. Be sure to understand risks before making an investment decision.
Go Further
I encourage you to read the complete analyses of The Boeing Company and Northrop Grumman Corporation to enhance your investment decisions: