Home > Comparison > Industrials > NOC vs TXT
The strategic rivalry between Northrop Grumman Corporation and Textron Inc. shapes the Aerospace & Defense sector’s evolution. Northrop Grumman operates as a capital-intensive industrial giant focused on advanced aerospace systems and missile defense. Textron combines aerospace manufacturing with diversified industrial and finance operations, blending innovation and service. This analysis pits sector leadership against operational diversity to identify which company offers superior risk-adjusted returns for a balanced portfolio.
Table of contents
Companies Overview
Northrop Grumman and Textron stand as pivotal players in the Aerospace & Defense sector with distinct strategic focuses.
Northrop Grumman Corporation: Aerospace & Defense Powerhouse
Northrop Grumman dominates the aerospace and defense industry, generating revenue through advanced aircraft systems, weapons, mission systems, and space solutions. Its core business spans from unmanned aircraft to missile defense and cyber systems. In 2026, the company emphasized integrated battle management and cutting-edge propulsion systems to maintain its technological edge and secure long-term defense contracts.
Textron Inc.: Diversified Industrial & Defense Manufacturer
Textron operates across aircraft, defense, industrial products, and finance, with a revenue engine rooted in manufacturing business jets, military helicopters, unmanned systems, and specialty vehicles. The company’s competitive advantage lies in its diversified product lines and financial services. In 2026, Textron focused on expanding its unmanned aircraft systems and enhancing aviation maintenance services to bolster its defense and commercial market segments.
Strategic Collision: Similarities & Divergences
Northrop Grumman pursues a high-tech, integrated systems approach, while Textron leverages diversification across aviation, defense, and industrial markets. Their primary battleground is advanced aerospace systems and unmanned vehicle technologies. Northrop’s investment profile centers on innovation and scale, whereas Textron’s model balances industrial breadth with niche defense capabilities, reflecting distinct risk and growth dynamics.
Income Statement Comparison
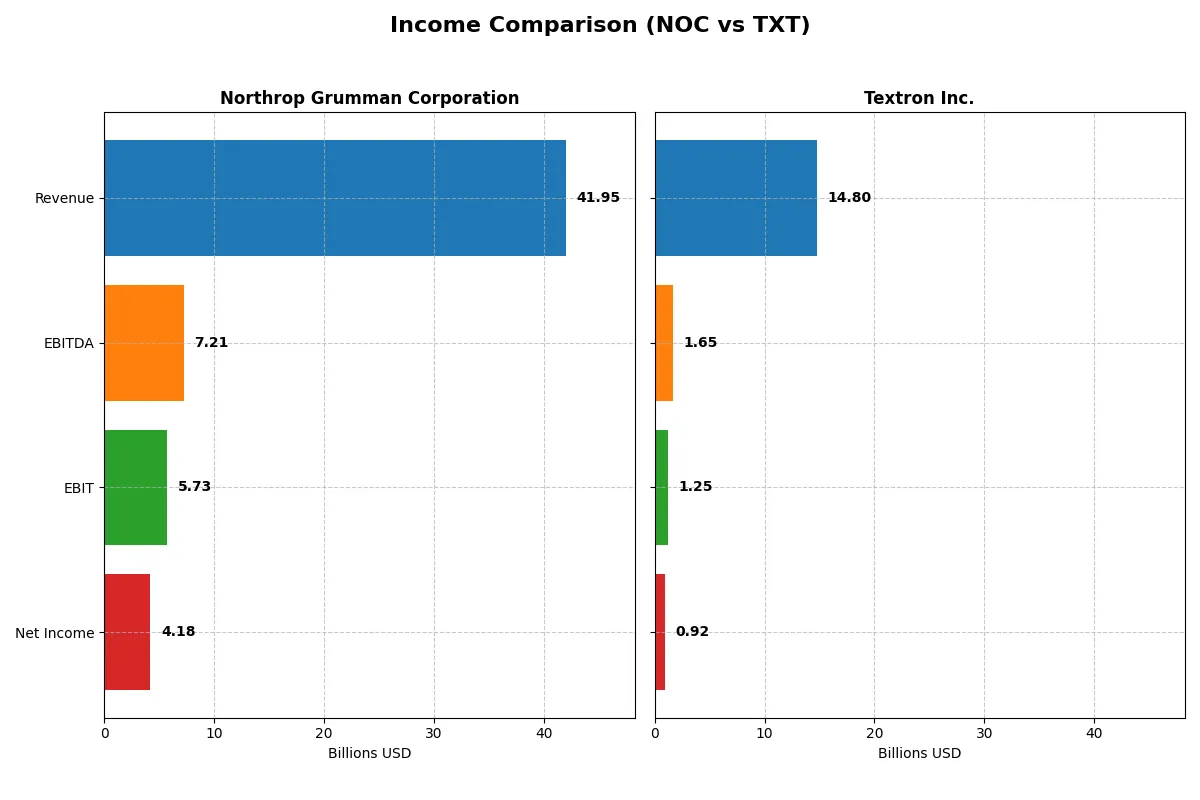
This data dissects the core profitability and scalability of both corporate engines to reveal who dominates the bottom line:
| Metric | Northrop Grumman Corporation (NOC) | Textron Inc. (TXT) |
|---|---|---|
| Revenue | 41.95B | 14.80B |
| Cost of Revenue | 33.64B | 12.30B |
| Operating Expenses | 4.03B | 1.25B |
| Gross Profit | 8.31B | 2.50B |
| EBITDA | 7.21B | 1.65B |
| EBIT | 5.73B | 1.25B |
| Interest Expense | 665M | 97M |
| Net Income | 4.18B | 921M |
| EPS | 29.14 | 5.11 |
| Fiscal Year | 2025 | 2025 |
Income Statement Analysis: The Bottom-Line Duel
This income statement comparison uncovers the operational efficiency and profit quality of each company’s core business engine.
Northrop Grumman Corporation Analysis
Northrop Grumman’s revenue climbed steadily from $35.7B in 2021 to $41.95B in 2025, showing 17.6% growth over five years. Net income, however, halved from $7B to $4.18B, reflecting margin compression. Gross margin held near 20%, but net margin declined to just under 10%, indicating rising costs and lower profitability momentum despite solid operating income gains.
Textron Inc. Analysis
Textron advanced both revenue and net income consistently, with revenue rising 19.5% to $14.8B in 2025 and net income up 23.5% to $921M. Gross margin hovered around 17%, while net margin improved modestly to 6.2%. EBIT margin expanded to 8.4%, supporting stronger earnings per share growth and signaling improving operational leverage and cost discipline.
Margin Power vs. Revenue Scale
Northrop Grumman commands larger revenue and stronger absolute profits but struggles with shrinking net margins and earnings erosion. Textron posts smaller top-line figures but delivers more consistent profit growth and margin expansion, reflecting better cost control. For investors, Northrop offers scale; Textron offers momentum and improving efficiency.
Financial Ratios Comparison
These vital ratios act as a diagnostic tool to expose the underlying fiscal health, valuation premiums, and capital efficiency of the companies compared below:
| Ratios | Northrop Grumman Corporation (NOC) | Textron Inc. (TXT) |
|---|---|---|
| ROE | 25.1% | 11.7% |
| ROIC | 9.2% | 9.4% |
| P/E | 19.6 | 17.0 |
| P/B | 4.91 | 1.99 |
| Current Ratio | 1.09 | 5.94 |
| Quick Ratio | 0.99 | 2.33 |
| D/E | 1.18 | 0.45 |
| Debt-to-Assets | 38.4% | 19.5% |
| Interest Coverage | 6.44 | 12.88 |
| Asset Turnover | 0.82 | 0.82 |
| Fixed Asset Turnover | 3.27 | 5.71 |
| Payout ratio | 31% | 2.1% |
| Dividend yield | 1.58% | 0.12% |
| Fiscal Year | 2025 | 2025 |
Efficiency & Valuation Duel: The Vital Signs
Financial ratios act as the company’s DNA, revealing hidden risks and operational excellence that shape investor confidence and valuation.
Northrop Grumman Corporation
Northrop Grumman demonstrates strong profitability with a 25.08% ROE and neutral net margin at 9.97%. The P/E of 19.57 suggests a fairly valued stock, though a high P/B of 4.91 signals some valuation stretch. Dividend yield stands at 1.58%, reflecting moderate shareholder returns alongside reinvestment in operations.
Textron Inc.
Textron posts a modest 11.7% ROE and a neutral net margin of 6.22%, with a slightly cheaper P/E of 17.04 and a reasonable P/B of 1.99. Its high current ratio (5.94) indicates ample liquidity but may signal inefficient capital use. Dividend yield is low at 0.12%, implying a focus on growth and reinvestment rather than income.
Balanced Profitability Meets Valuation Discipline
Northrop Grumman offers higher profitability and modest dividend returns, while Textron presents a more conservative valuation with stronger liquidity. Investors valuing operational efficiency may lean toward Northrop, whereas those prioritizing balance sheet strength might prefer Textron’s profile.
Which one offers the Superior Shareholder Reward?
Northrop Grumman (NOC) pays a 1.58% dividend yield with a solid 31% payout ratio, supported by strong free cash flow coverage (1.73x). Its buybacks are meaningful, enhancing total returns. Textron (TXT) yields just 0.12%, with a negligible 2% payout ratio but directs cash to buybacks and reinvestment. I see NOC’s balanced dividend and buyback approach as more sustainable and rewarding in 2026, offering superior total shareholder return potential compared to TXT’s minimal dividend and modest buybacks.
Comparative Score Analysis: The Strategic Profile
The radar chart reveals the fundamental DNA and trade-offs of Northrop Grumman and Textron, highlighting their financial strengths and vulnerabilities side by side:
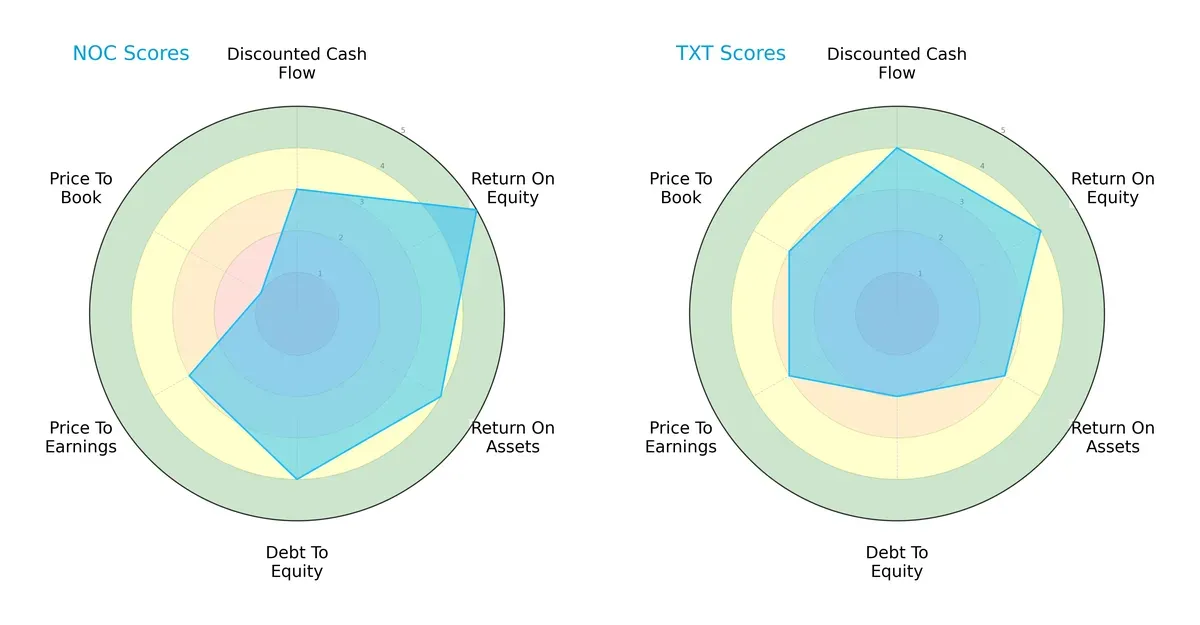
Northrop Grumman leads with a more balanced profile, excelling in ROE (5) and ROA (4) while maintaining strong debt management (4). Textron shows strength in discounted cash flow (4) but lags in debt-to-equity (2), indicating higher leverage risk. Northrop’s low price-to-book score (1) warns of potential overvaluation, whereas Textron maintains moderate valuation scores. Overall, Northrop dominates operational efficiency; Textron relies more on cash flow advantages.
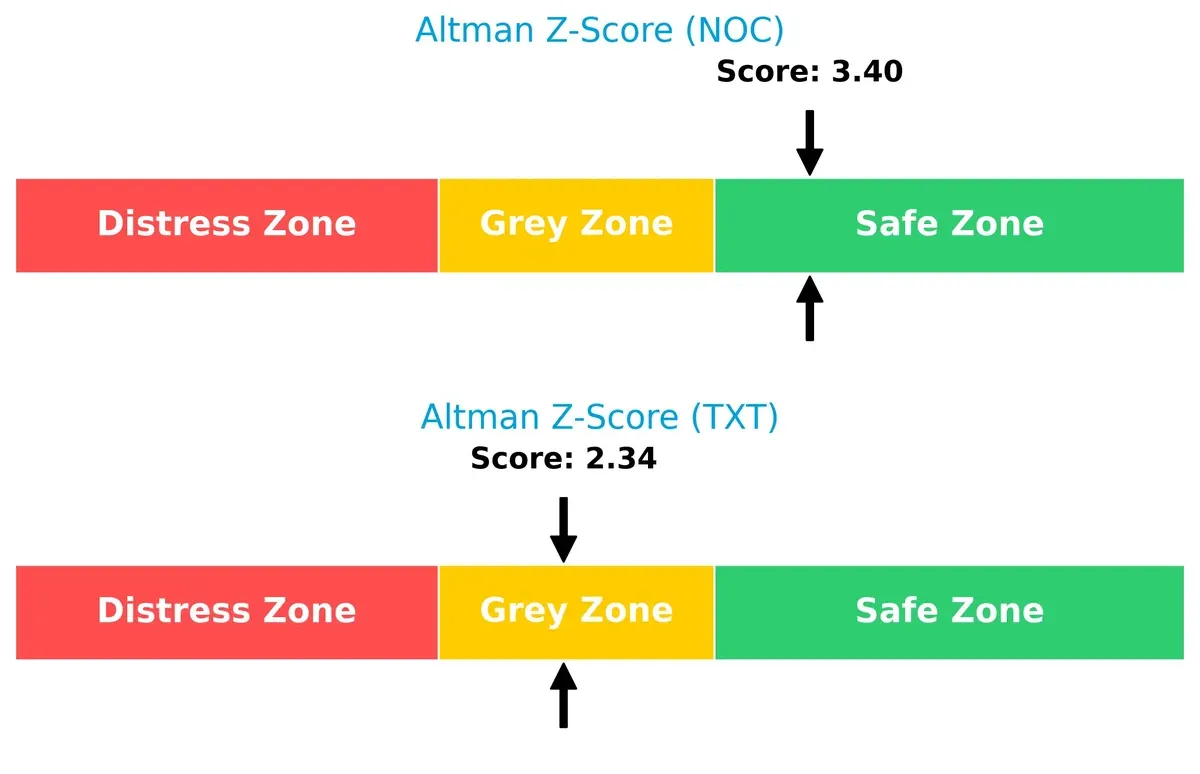
Bankruptcy Risk: Solvency Showdown
Northrop Grumman’s Altman Z-Score of 3.40 firmly places it in the safe zone, while Textron’s 2.34 sits in the grey zone, signaling higher bankruptcy risk in volatile cycles:
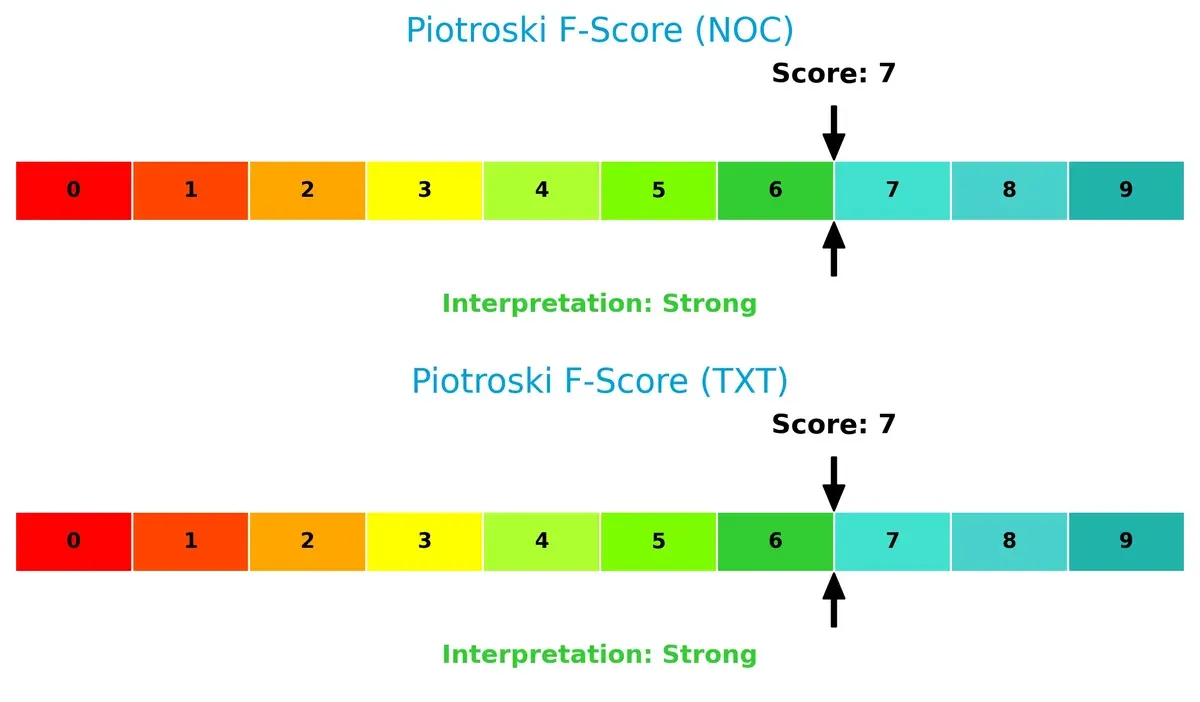
Financial Health: Quality of Operations
Both companies score a strong 7 on the Piotroski F-Score, reflecting solid internal financial health. Neither exhibits immediate red flags in profitability, leverage, or efficiency metrics:
How are the two companies positioned?
This section dissects the operational DNA of Northrop Grumman and Textron by comparing their revenue distribution and internal dynamics. The goal is to confront their economic moats to reveal which business model delivers the most resilient competitive advantage today.
Revenue Segmentation: The Strategic Mix
This visual comparison dissects how Northrop Grumman Corporation and Textron Inc. diversify income streams and where their primary sector bets lie:
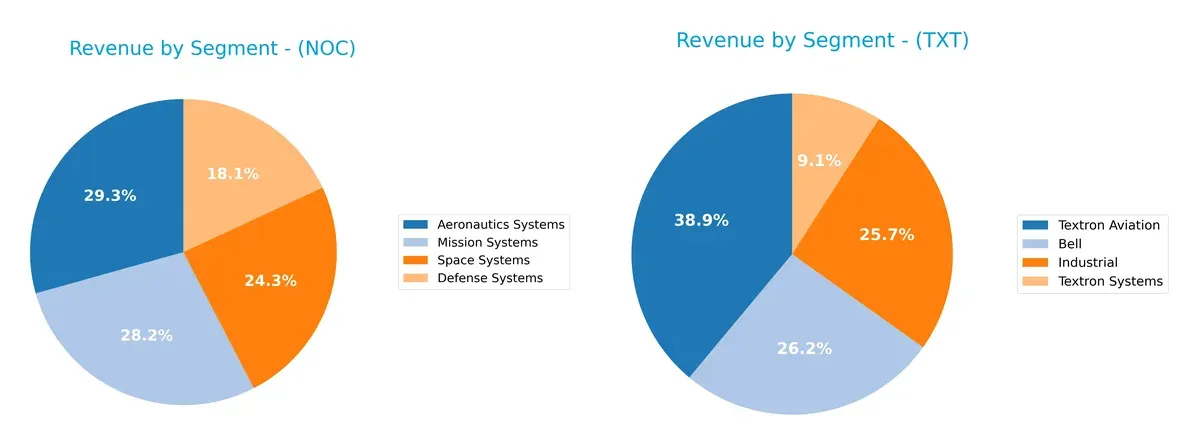
Northrop Grumman anchors revenue across four major segments, each exceeding $8B, with Aeronautics Systems leading at $13B and no single segment dominating excessively. Textron relies heavily on Textron Aviation, $5.3B, and Bell, $3.6B, showing less diversification. Northrop’s balanced portfolio reduces concentration risk and leverages broad defense infrastructure. Textron’s focus suggests dependency on aerospace innovation but exposes it to sector cyclicality and competitive pressures.
Strengths and Weaknesses Comparison
This table compares the strengths and weaknesses of Northrop Grumman Corporation (NOC) and Textron Inc. (TXT) based on diversification, profitability, financial statements, innovation, global presence, and market share:
NOC Strengths
- Broad product diversification across Aeronautics, Defense, Mission, and Space Systems
- Strong profitability with 25.08% ROE and 4.51% WACC advantage
- Favorable interest coverage and fixed asset turnover
- Significant U.S. revenue base over 36B USD
- Slightly favorable overall financial ratios
TXT Strengths
- Diversified portfolio with Bell, Industrial, Aviation, and Systems segments
- Favorable debt management with low debt-to-assets and strong interest coverage
- High fixed asset turnover (5.71)
- Strong global presence with international revenue over 4B USD
- Slightly favorable overall financial ratios
NOC Weaknesses
- Elevated debt-to-equity ratio (1.18) and unfavorable price-to-book (4.91)
- Neutral current and quick ratios near 1 suggest liquidity risks
- Lower dividend yield (1.58%) compared to typical standards
- Limited international revenue relative to large U.S. base
TXT Weaknesses
- High current ratio (5.94) may indicate inefficient asset use
- Very low dividend yield (0.12%) could deter income-focused investors
- Lower profitability with 11.7% ROE and 6.22% net margin
- Neutral price-to-earnings and price-to-book ratios
Northrop Grumman excels in profitability and scale, driven by a broad defense and aerospace product base concentrated in the U.S. Textron shows strength in financial prudence and asset efficiency with a more balanced geographic footprint. Both face liquidity and valuation challenges that will influence capital allocation and investor appeal.
The Moat Duel: Analyzing Competitive Defensibility
A structural moat is the only true barrier preventing long-term profits from being eroded by relentless competition. Let’s dissect the moats of two aerospace and defense giants:
Northrop Grumman Corporation: Complex Systems Integration as a Moat
Northrop Grumman’s competitive edge lies in its intangible assets and integrated systems expertise, reflected in a high ROIC comfortably above WACC. Despite declining ROIC trends, its advanced aerospace and defense portfolio promises moat reinforcement through emerging technologies in hypersonics and cyber warfare.
Textron Inc.: Operational Efficiency and Growth Momentum
Textron’s moat centers on cost advantage and operational scaling across diversified segments, unlike Northrop’s tech-heavy moat. Though its ROIC remains below WACC, a robust upward trend in profitability and revenue growth signals a strengthening competitive position, fueled by innovation in unmanned systems and expanding defense contracts.
Verdict: Complex Systems Integration vs. Operational Growth
Northrop Grumman maintains a deeper moat with consistent value creation, despite recent profitability erosion. Textron’s improving ROIC and growth trajectory suggest a narrowing gap, but Northrop remains better equipped to defend its market share through technological sophistication and scale.
Which stock offers better returns?
The past year reveals stark contrasts: Northrop Grumman surges with strong acceleration, while Textron declines despite recent modest gains.
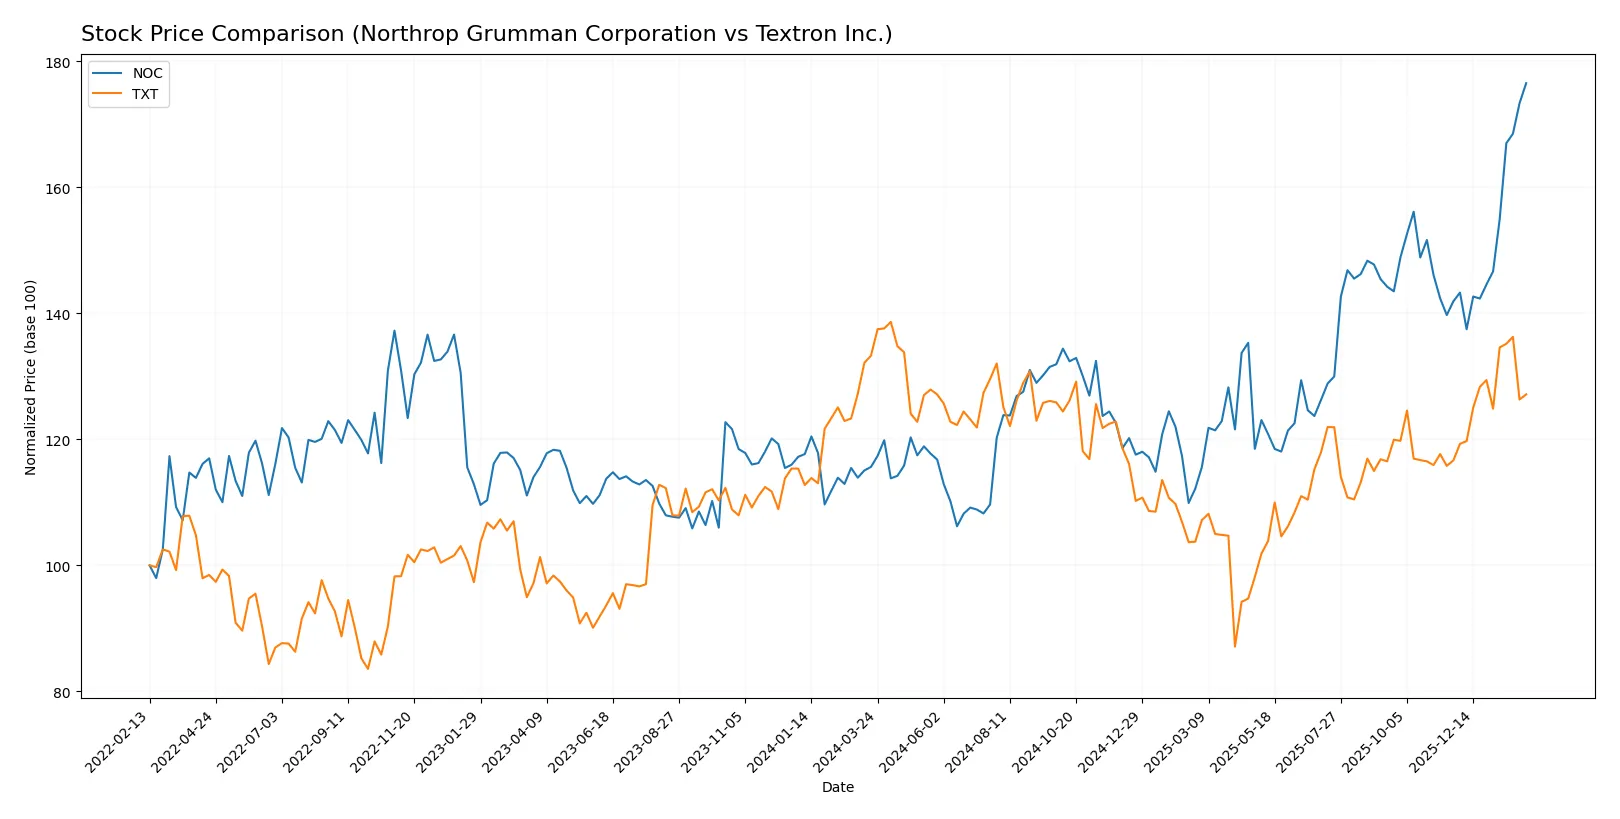
Trend Comparison
Northrop Grumman’s stock rose 52.68% over the last 12 months, reflecting a bullish trend with accelerating momentum and high volatility. The price ranged from 424.09 to 704.98.
Textron’s stock declined 4.61% over the same period, marking a bearish trend despite recent positive movement of 8.98%. Volatility remains low, with acceleration noted.
Northrop Grumman’s stock clearly outperformed Textron’s, delivering the highest market returns and stronger upward momentum throughout the year.
Target Prices
Analysts show a bullish target consensus for Northrop Grumman and Textron, reflecting confidence in defense sector growth.
| Company | Target Low | Target High | Consensus |
|---|---|---|---|
| Northrop Grumman Corporation | 623 | 815 | 732.25 |
| Textron Inc. | 92 | 110 | 101 |
The consensus target for Northrop Grumman exceeds its current price of $705, signaling upside potential. Textron’s target is also above its trading price of $88.63, suggesting room for price appreciation.

Don’t Let Luck Decide Your Entry Point
Optimize your entry points with our advanced ProRealTime indicators. You’ll get efficient buy signals with precise price targets for maximum performance. Start outperforming now!
How do institutions grade them?
The following tables summarize recent institutional grades for Northrop Grumman Corporation and Textron Inc.:
Northrop Grumman Corporation Grades
This table shows the latest grades from major financial institutions for Northrop Grumman Corporation.
| Grading Company | Action | New Grade | Date |
|---|---|---|---|
| Jefferies | maintain | Hold | 2026-02-02 |
| RBC Capital | maintain | Outperform | 2026-01-28 |
| Citigroup | maintain | Buy | 2026-01-28 |
| UBS | maintain | Buy | 2026-01-28 |
| B of A Securities | maintain | Buy | 2026-01-28 |
| BTIG | maintain | Buy | 2026-01-28 |
| UBS | maintain | Buy | 2026-01-15 |
| Citigroup | maintain | Buy | 2026-01-13 |
| Truist Securities | downgrade | Hold | 2026-01-09 |
| Morgan Stanley | maintain | Overweight | 2025-12-16 |
Textron Inc. Grades
This table displays recent institutional grades for Textron Inc. from recognized analysts.
| Grading Company | Action | New Grade | Date |
|---|---|---|---|
| Jefferies | maintain | Buy | 2026-02-02 |
| JP Morgan | maintain | Neutral | 2026-01-29 |
| Citigroup | maintain | Neutral | 2026-01-29 |
| UBS | maintain | Neutral | 2026-01-15 |
| Citigroup | maintain | Neutral | 2026-01-13 |
| JP Morgan | maintain | Neutral | 2025-10-27 |
| TD Cowen | maintain | Hold | 2025-10-24 |
| UBS | maintain | Neutral | 2025-10-24 |
| Barclays | maintain | Overweight | 2025-07-29 |
| UBS | upgrade | Neutral | 2025-07-28 |
Which company has the best grades?
Northrop Grumman consistently receives Buy and Outperform ratings, signaling stronger institutional confidence. Textron’s grades cluster around Neutral and Hold, indicating more cautious sentiment. Investors may perceive Northrop Grumman as having a more favorable outlook based on these grades.
Risks specific to each company
The following categories identify the critical pressure points and systemic threats facing both firms in the 2026 market environment:
1. Market & Competition
Northrop Grumman Corporation
- Dominates aerospace & defense with advanced systems, but faces intense government contract competition.
Textron Inc.
- Diversified in defense, aviation, and industrial sectors, facing broad competitive pressures across varied markets.
2. Capital Structure & Debt
Northrop Grumman Corporation
- Debt-to-equity ratio of 1.18 signals higher leverage risk; interest coverage remains strong at 8.62x.
Textron Inc.
- Lower leverage with debt-to-equity at 0.45 and stronger interest coverage at 12.84x, reflecting financial prudence.
3. Stock Volatility
Northrop Grumman Corporation
- Extremely low beta at 0.039 indicates minimal volatility, attractive for risk-averse investors.
Textron Inc.
- Beta near 1 (0.978) suggests stock moves closely with market, implying higher volatility risk.
4. Regulatory & Legal
Northrop Grumman Corporation
- Heavy reliance on US defense contracts exposes it to regulatory scrutiny and budget volatility.
Textron Inc.
- Operating in multiple sectors and regions, faces complex regulatory environments but diversified risk.
5. Supply Chain & Operations
Northrop Grumman Corporation
- Complex aerospace supply chains susceptible to geopolitical tensions and tech export controls.
Textron Inc.
- More diversified supply chains across industrial and aviation units, reducing single-point operational risks.
6. ESG & Climate Transition
Northrop Grumman Corporation
- Defense sector faces increasing ESG pressure; adapting to climate mandates remains challenging.
Textron Inc.
- Industrial and aviation segments face regulatory ESG demands but have opportunities in hybrid vehicle systems.
7. Geopolitical Exposure
Northrop Grumman Corporation
- Significant US defense focus links revenues to geopolitical defense priorities and budget shifts.
Textron Inc.
- Global operations expose it to currency risks and international trade uncertainties.
Which company shows a better risk-adjusted profile?
Northrop Grumman’s key risk lies in its high leverage and regulatory dependency on US defense budgets. Textron’s main risk is elevated stock volatility and complex regulatory exposure across sectors. Despite Northrop’s leverage, its very low beta and strong Altman Z-score (3.4, safe zone) suggest superior financial stability. Textron’s lower debt and stronger interest coverage are positives, but beta near 1 and a moderate Altman Z-score (2.34, grey zone) imply higher risk. Overall, Northrop Grumman offers a better risk-adjusted profile, supported by its minimal stock volatility and solid financial strength despite leverage concerns.
Final Verdict: Which stock to choose?
Northrop Grumman Corporation’s superpower lies in its strong value creation, consistently delivering returns well above its cost of capital. It operates as a cash generator with a robust moat in defense technology. A point of vigilance is its declining profitability trend, which could signal future challenges. This stock fits well in an Aggressive Growth portfolio seeking exposure to a resilient aerospace leader.
Textron Inc. boasts a strategic moat rooted in its improving profitability and efficient capital use, supported by a growing ROIC trend. Its balance sheet strength and lower leverage offer a safer profile compared to Northrop Grumman. Textron suits a GARP (Growth at a Reasonable Price) portfolio aiming for steady improvement with moderate risk.
If you prioritize sustained value creation and are comfortable with cyclical fluctuations, Northrop Grumman outshines with superior returns and a commanding industry position. However, if you seek better financial stability and a company on an upward profitability trajectory, Textron offers better risk-adjusted growth potential. Both present compelling cases, but your choice hinges on risk tolerance and growth strategy.
Disclaimer: Investment carries a risk of loss of initial capital. The past performance is not a reliable indicator of future results. Be sure to understand risks before making an investment decision.
Go Further
I encourage you to read the complete analyses of Northrop Grumman Corporation and Textron Inc. to enhance your investment decisions: