Home > Comparison > Industrials > RTX vs NOC
The strategic rivalry between RTX Corporation and Northrop Grumman Corporation shapes the aerospace and defense sector’s evolution. RTX operates as a diversified industrial conglomerate with aerospace systems, engines, and defense solutions. Northrop Grumman specializes in advanced aerospace systems, cyber, and missile defense technologies. This analysis pits RTX’s broad industrial scope against Northrop’s focused innovation to identify the superior risk-adjusted opportunity for a balanced portfolio.
Table of contents
Companies Overview
RTX Corporation and Northrop Grumman Corporation stand as two pillars in the aerospace and defense sector, shaping global security and innovation.
RTX Corporation: Integrated Aerospace & Defense Powerhouse
RTX Corporation dominates aerospace and defense through three core segments: Collins Aerospace, Pratt & Whitney, and Raytheon. It generates revenue by supplying aircraft engines, defense systems, and aftermarket services globally. In 2026, RTX emphasizes advancing threat detection and aerospace innovations, reinforcing its broad market position with diversified capabilities.
Northrop Grumman Corporation: Advanced Defense Systems Specialist
Northrop Grumman focuses on aerospace and defense with strong expertise in aeronautics, mission systems, and space technologies. Its revenue stems from designing aircraft systems, precision weapons, and cyber solutions. The company’s 2026 strategy centers on integrating unmanned systems and enhancing missile defense, highlighting its technological edge in strategic military solutions.
Strategic Collision: Similarities & Divergences
Both companies thrive in aerospace and defense but diverge in approach—RTX offers a diversified ecosystem spanning engines to threat detection, while Northrop Grumman pursues a focused high-tech weapons and systems portfolio. Their competition intensifies in military aerospace and defense innovation. Investors see RTX as a broad industrial leader, contrasting with Northrop’s niche specialization in advanced defense technology.
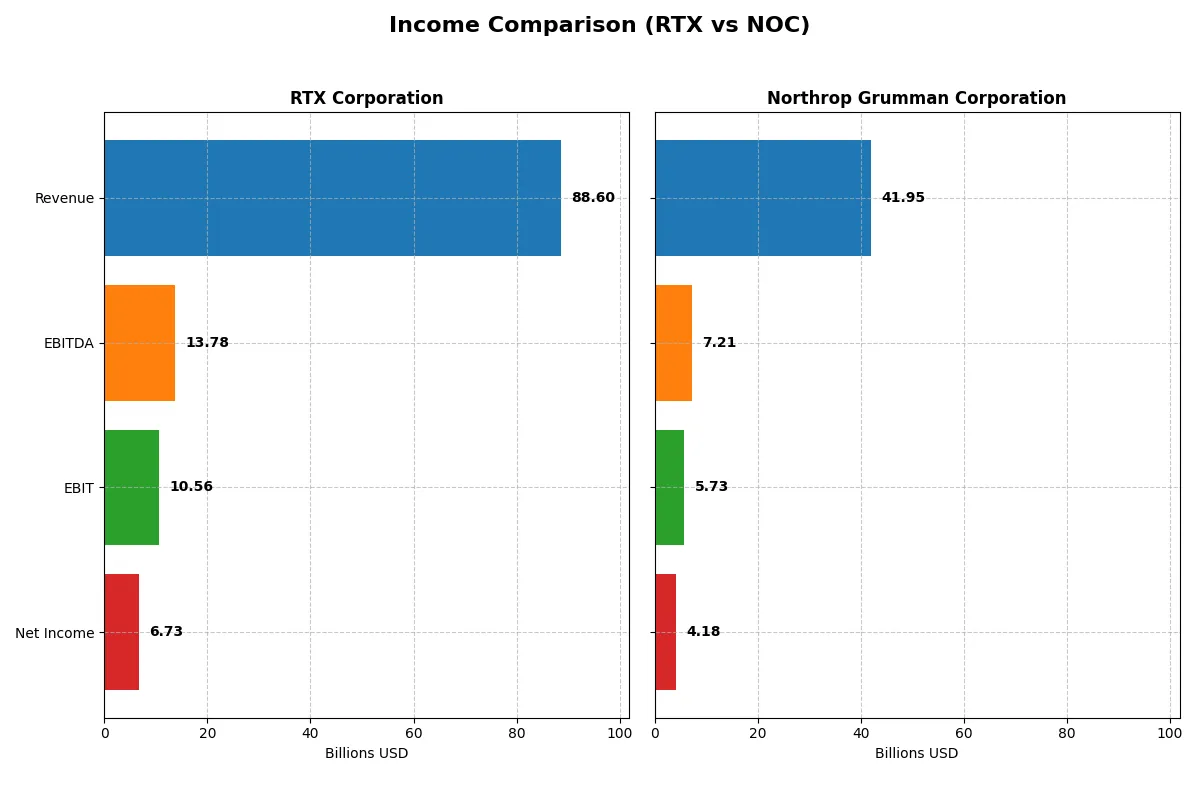
Income Statement Comparison
This data dissects the core profitability and scalability of both corporate engines to reveal who dominates the bottom line:
| Metric | RTX Corporation (RTX) | Northrop Grumman Corporation (NOC) |
|---|---|---|
| Revenue | 88.6B | 41.9B |
| Cost of Revenue | 70.8B | 33.6B |
| Operating Expenses | 8.9B | 4.0B |
| Gross Profit | 17.8B | 8.3B |
| EBITDA | 13.8B | 7.2B |
| EBIT | 10.6B | 5.7B |
| Interest Expense | 1.8B | 0.7B |
| Net Income | 6.7B | 4.2B |
| EPS | 5.03 | 29.14 |
| Fiscal Year | 2025 | 2025 |
Income Statement Analysis: The Bottom-Line Duel
This income statement comparison reveals which company drives greater operational efficiency and sustainable profitability.
RTX Corporation Analysis
RTX shows a strong revenue climb from $64B in 2021 to $88.6B in 2025, with net income nearly doubling to $6.7B. Its gross margin rose to 20.1%, and net margin expanded to 7.6%, signaling improving cost control. The 2025 jump in EBIT by 29% highlights accelerating operational momentum and robust margin health.
Northrop Grumman Corporation Analysis
Northrop Grumman’s revenue grows modestly to $41.9B in 2025 from $35.7B in 2021, but net income declines sharply by 40% overall to $4.18B. Gross margin remains stable near 19.8%, and net margin improved to 10%. However, stagnant revenue and negative net income growth suggest challenges in scaling profitability despite efficient cost management.
Momentum and Margin: Growth Leader vs. Margin Stability
RTX outpaces Northrop Grumman with superior revenue growth, expanding margins, and strong net income gains. Northrop Grumman maintains higher net margin but struggles with declining bottom-line growth. For investors, RTX’s profile offers compelling momentum and margin expansion, while Northrop Grumman reflects steadier profitability with less growth.
Financial Ratios Comparison
These vital ratios act as a diagnostic tool to expose the underlying fiscal health, valuation premiums, and capital efficiency of the companies analyzed below:
| Ratios | RTX Corporation (RTX) | Northrop Grumman (NOC) |
|---|---|---|
| ROE | 7.94% | 25.08% |
| ROIC | 4.74% | 9.93% |
| P/E | 32.3x | 19.6x |
| P/B | 2.56x | 4.91x |
| Current Ratio | 0.99 | 1.10 |
| Quick Ratio | 0.74 | 1.10 |
| D/E | 0.71 | 0.11 |
| Debt-to-Assets | 26.3% | 3.6% |
| Interest Coverage | 3.39x | -6.78x |
| Asset Turnover | 0.50 | 0.82 |
| Fixed Asset Turnover | 4.50 | 3.27 |
| Payout Ratio | 67.4% | 30.9% |
| Dividend Yield | 2.09% | 1.58% |
| Fiscal Year | 2025 | 2025 |
Efficiency & Valuation Duel: The Vital Signs
Ratios act as a company’s DNA, unveiling hidden risks and operational excellence to guide investors in assessing true financial health.
RTX Corporation
RTX shows neutral net margins at 7.6% but suffers from zero returns on equity and invested capital, signaling operational challenges. Its P/E ratio at 36.64 marks the stock as expensive. Dividend yield is modest at 1.45%, reflecting a cautious shareholder return, while reinvestment in R&D remains steady to support growth prospects.
Northrop Grumman Corporation
Northrop delivers a robust 25.08% ROE and a near 10% ROIC, indicating efficient capital use. Its P/E of 19.57 suggests a fairly valued stock. The dividend yield stands slightly higher at 1.58%, complemented by strong interest coverage and moderate leverage, supporting a balanced approach to rewarding shareholders and funding operations.
Premium Valuation vs. Operational Safety
Northrop Grumman offers a superior blend of profitability and valuation discipline compared to RTX’s stretched multiples and weak returns. Investors prioritizing operational efficiency and risk control may find Northrop’s profile more resilient. RTX’s profile suits those focused on growth reinvestment despite its valuation premium.
Which one offers the Superior Shareholder Reward?
I compare RTX Corporation and Northrop Grumman Corporation on dividend yields, payout ratios, and buybacks to assess shareholder rewards in 2026. RTX yields 1.45% with a 53% payout, supported by buybacks absorbing 75% of operating cash flow. Northrop Grumman yields 1.58% with a safer 31% payout, deploying significant free cash flow into robust buybacks. RTX’s higher yield and payout risk sustainability, while Northrop’s conservative payout combined with strong buybacks suggests more durable total returns. Given Northrop’s superior free cash flow per share (23.0 vs. RTX’s 5.9) and prudent capital allocation, I judge Northrop Grumman offers the more attractive shareholder reward in 2026.
Comparative Score Analysis: The Strategic Profile
The radar chart reveals the fundamental DNA and trade-offs of RTX Corporation and Northrop Grumman Corporation:
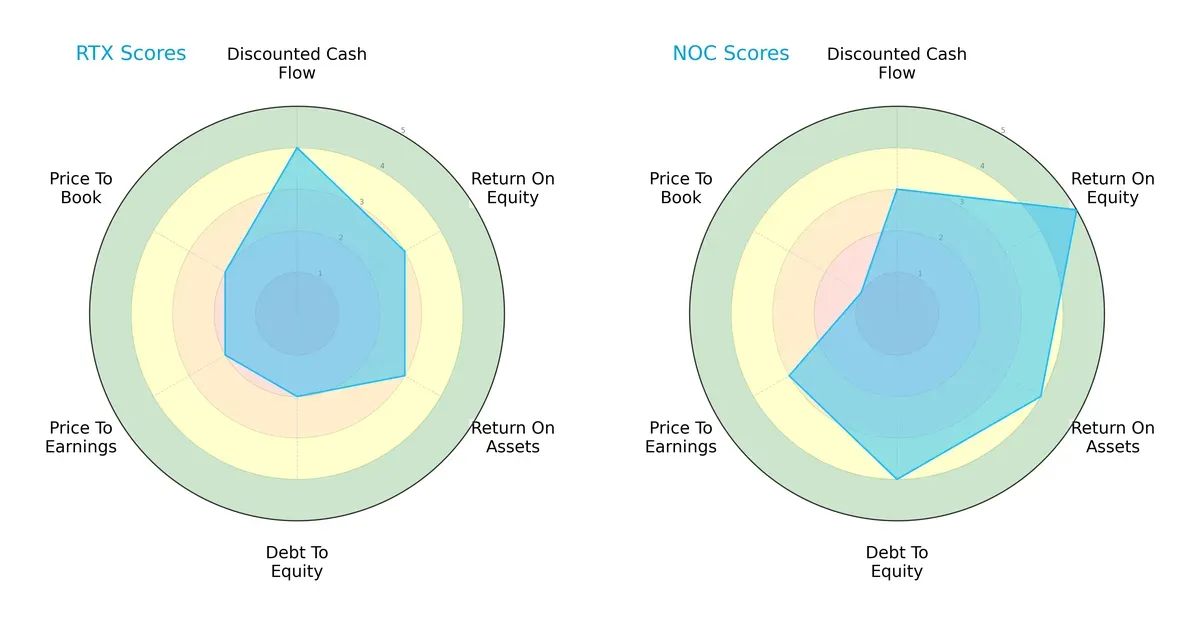
Northrop Grumman demonstrates a more balanced profile with superior ROE (5 vs. 3) and ROA (4 vs. 3), signaling efficient profit and asset utilization. RTX leads slightly in discounted cash flow (4 vs. 3) but shows weaknesses in debt management (2 vs. 4) and valuation metrics (PE and PB scores both at 2 vs. NOC’s 3 and 1). NOC leverages a strong capital structure, while RTX relies more on cash flow projections for value.
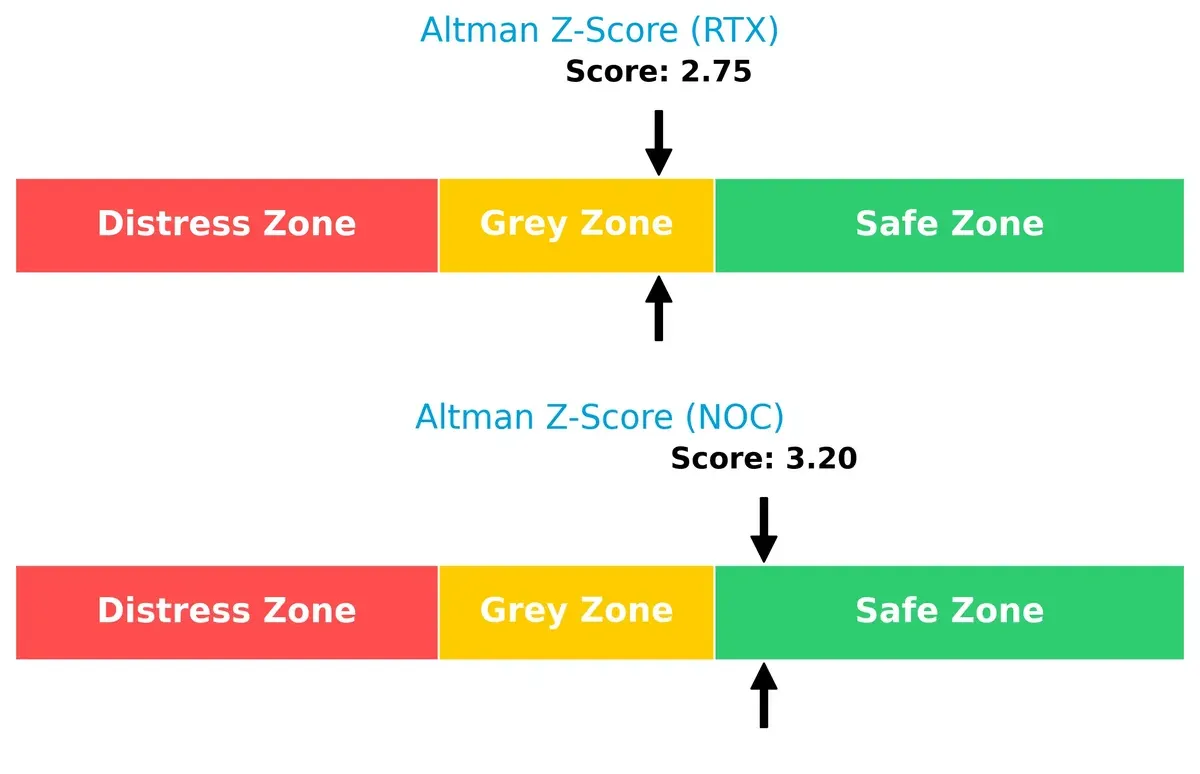
Bankruptcy Risk: Solvency Showdown
Northrop Grumman’s Altman Z-Score (3.20) places it safely above RTX’s 2.75 in the grey zone, indicating better long-term survival prospects in the current cycle:
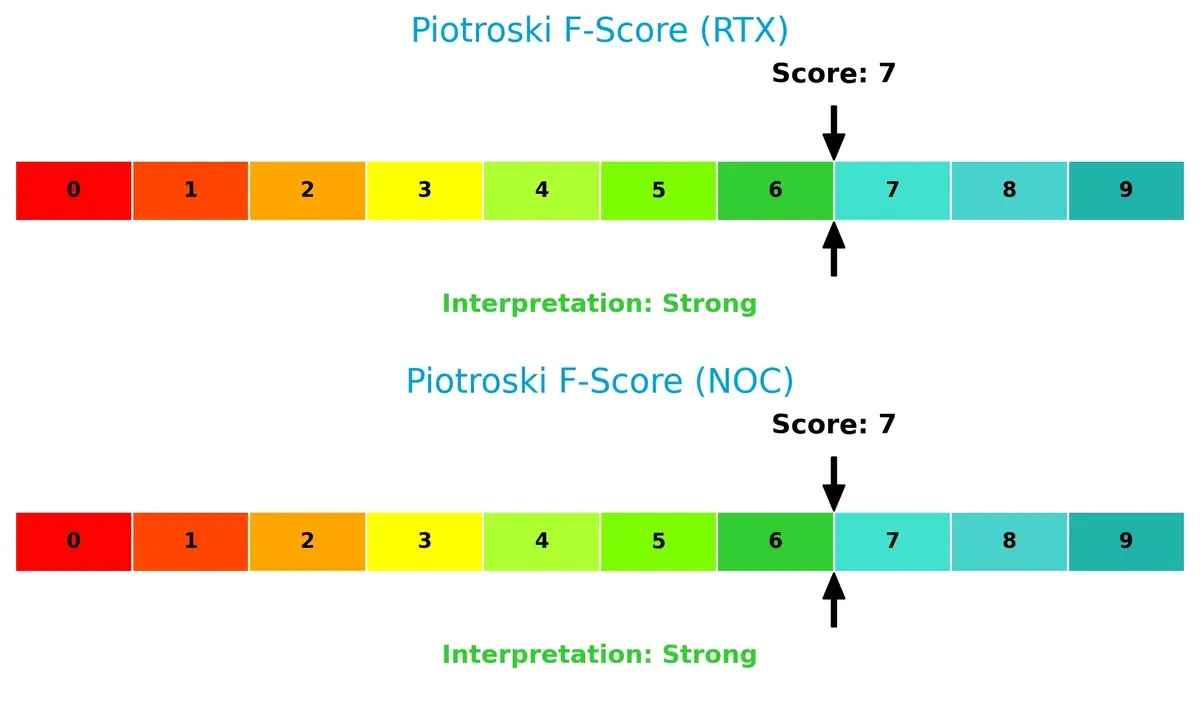
Financial Health: Quality of Operations
Both companies score a strong 7 on the Piotroski F-Score, indicating robust financial health with no glaring red flags in operational quality or internal metrics:
How are the two companies positioned?
This section dissects RTX and NOC’s operational DNA by comparing their revenue distribution and internal strengths and weaknesses. The goal is to confront their economic moats to reveal which offers the most resilient, sustainable advantage today.
Revenue Segmentation: The Strategic Mix
This visual comparison dissects how RTX Corporation and Northrop Grumman diversify their income streams and where their primary sector bets lie:
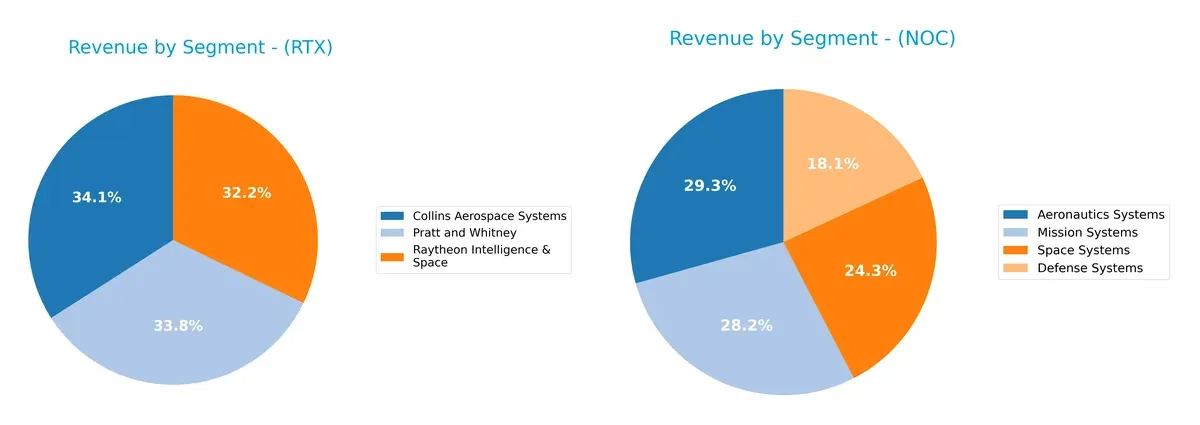
RTX anchors its revenue in three nearly equal pillars: Collins Aerospace Systems at $28.3B, Pratt and Whitney at $28.1B, and Raytheon Intelligence & Space at $26.7B. This balanced tripartite mix contrasts with Northrop Grumman’s concentration around Aeronautics Systems ($13B) and Mission Systems ($12.5B), with Space Systems close behind at $10.8B. RTX’s diversification reduces concentration risk, while Northrop’s focus on aerospace and defense systems signals strength in specialized infrastructure dominance.
Strengths and Weaknesses Comparison
This table compares the Strengths and Weaknesses of RTX Corporation and Northrop Grumman Corporation:
RTX Strengths
- Strong diversification across aerospace systems
- Balanced revenue streams including Collins Aerospace and Pratt & Whitney
- Favorable WACC and debt ratios
- Solid interest coverage ratio
NOC Strengths
- Higher profitability with favorable ROE and neutral ROIC
- Favorable WACC and strong interest coverage
- Diverse segments including Aeronautics and Space Systems
- Better liquidity ratios with current and quick ratios above 1
RTX Weaknesses
- Unfavorable ROE and ROIC indicating low capital efficiency
- Weak liquidity with current and quick ratios at zero
- Unfavorable asset turnover ratios
- High P/E ratio signaling expensive valuation
NOC Weaknesses
- Unfavorable price-to-book ratio suggesting potential overvaluation
- Lower net margin compared to ROE, indicating room for margin improvement
RTX shows strength in diversification and conservative debt management but faces challenges in profitability and liquidity. NOC excels in profitability and liquidity but carries valuation concerns. Both companies’ profiles suggest distinct strategic priorities: RTX needs to improve operational efficiency, while NOC must address valuation risks.
The Moat Duel: Analyzing Competitive Defensibility
A structural moat shields long-term profits from relentless competitive forces. Without it, profits erode swiftly. Let’s dissect the moats of RTX Corporation and Northrop Grumman Corporation:
RTX Corporation: Intangible Assets & Scale Moat
RTX leverages deep intangible assets and integrated aerospace systems, reflected in stable margins and strong revenue growth. However, its declining ROIC signals weakening capital efficiency in 2026, threatening moat durability.
Northrop Grumman Corporation: Technological Edge & Specialized Defense Systems
Northrop Grumman’s moat hinges on advanced aerospace technology and mission-critical defense contracts. Despite a slight ROIC decline, it maintains value creation and a resilient margin profile, positioning it for selective market expansion.
Technological Innovation vs. Scale Integration: Who Defends Better?
Northrop Grumman’s slightly favorable moat outpaces RTX’s very unfavorable ROIC gap. I see Northrop better equipped to defend and grow profits amid rising competition and evolving defense needs.
Which stock offers better returns?
The past year reveals strong upward momentum for both stocks, with RTX showing notable price acceleration and NOC exhibiting higher volatility amid its gains.
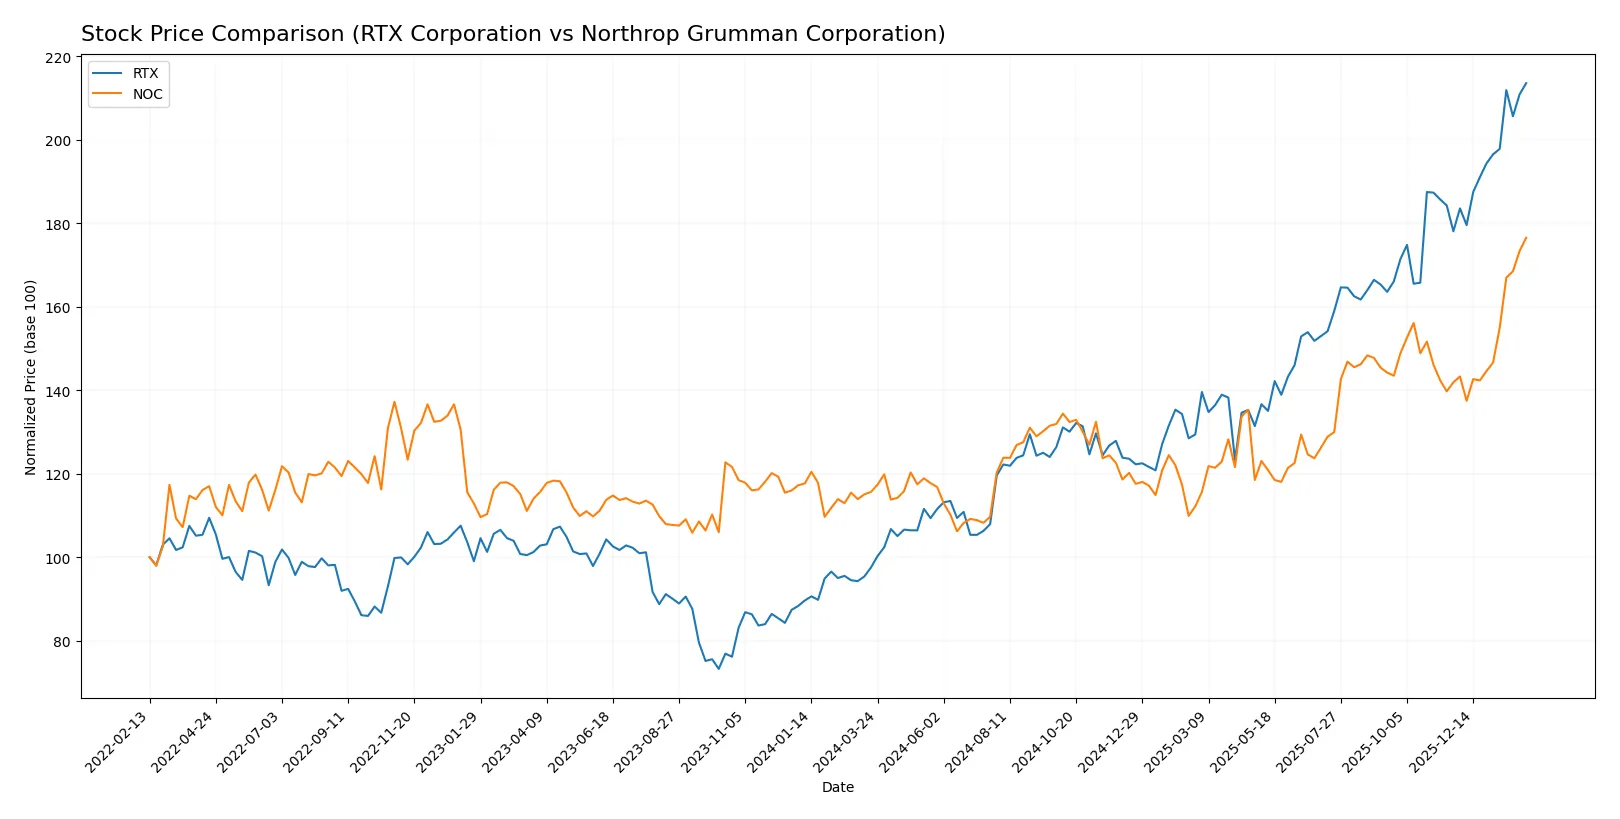
Trend Comparison
RTX Corporation’s stock surged 118.98% over the past 12 months, maintaining a bullish trend with accelerating gains. The price ranged from 92.93 to 203.5, reflecting steady upward momentum.
Northrop Grumman Corporation gained 52.68% over the same period, also bullish with acceleration. Its price showed wider swings, from 424.09 to 704.98, indicating higher volatility.
RTX outperformed NOC with more than double the total return and a steadier acceleration in price, delivering the strongest market performance this year.
Target Prices
Analysts present a bullish consensus for RTX Corporation and Northrop Grumman Corporation, reflecting confidence in aerospace and defense growth.
| Company | Target Low | Target High | Consensus |
|---|---|---|---|
| RTX Corporation | 168 | 235 | 214.7 |
| Northrop Grumman Corporation | 623 | 815 | 732.25 |
The target consensus for RTX exceeds its current price of 203.5, suggesting upside potential. Northrop Grumman’s consensus price also surpasses the current 704.98, indicating robust analyst optimism.

Don’t Let Luck Decide Your Entry Point
Optimize your entry points with our advanced ProRealTime indicators. You’ll get efficient buy signals with precise price targets for maximum performance. Start outperforming now!
How do institutions grade them?
RTX Corporation Grades
Here are the latest grades from major financial institutions for RTX Corporation:
| Grading Company | Action | New Grade | Date |
|---|---|---|---|
| UBS | maintain | Neutral | 2026-01-28 |
| JP Morgan | maintain | Overweight | 2026-01-28 |
| RBC Capital | maintain | Outperform | 2026-01-28 |
| Citigroup | maintain | Buy | 2026-01-13 |
| UBS | downgrade | Neutral | 2026-01-05 |
| JP Morgan | maintain | Overweight | 2025-12-19 |
| B of A Securities | maintain | Buy | 2025-10-27 |
| UBS | maintain | Buy | 2025-10-22 |
| Goldman Sachs | maintain | Neutral | 2025-10-22 |
| Susquehanna | maintain | Positive | 2025-10-22 |
Northrop Grumman Corporation Grades
This table summarizes recent institutional grades for Northrop Grumman Corporation:
| Grading Company | Action | New Grade | Date |
|---|---|---|---|
| B of A Securities | maintain | Buy | 2026-01-28 |
| BTIG | maintain | Buy | 2026-01-28 |
| UBS | maintain | Buy | 2026-01-28 |
| RBC Capital | maintain | Outperform | 2026-01-28 |
| Citigroup | maintain | Buy | 2026-01-28 |
| UBS | maintain | Buy | 2026-01-15 |
| Citigroup | maintain | Buy | 2026-01-13 |
| Truist Securities | downgrade | Hold | 2026-01-09 |
| Morgan Stanley | maintain | Overweight | 2025-12-16 |
| Alembic Global | upgrade | Overweight | 2025-12-15 |
Which company has the best grades?
Northrop Grumman consistently earns strong Buy and Outperform ratings, with fewer downgrades than RTX. This generally signals greater analyst confidence, potentially attracting more investor interest and support.
Risks specific to each company
The following categories identify critical pressure points and systemic threats facing both firms in the 2026 market environment:
1. Market & Competition
RTX Corporation
- Faces intense competition from diversified aerospace and defense firms; margin pressure remains neutral.
Northrop Grumman Corporation
- Benefits from niche defense segments and strong ROE, but pricing power challenged by high P/B ratio.
2. Capital Structure & Debt
RTX Corporation
- Shows favorable debt-to-equity and interest coverage ratios, but liquidity ratios are weak, signaling potential short-term constraints.
Northrop Grumman Corporation
- Maintains strong debt metrics and liquidity with interest coverage at 8.62, supporting financial stability.
3. Stock Volatility
RTX Corporation
- Beta at 0.418 indicates moderate volatility, with a recent price near the 52-week high.
Northrop Grumman Corporation
- Exceptionally low beta of 0.039 signals defensive stock behavior and lower price volatility.
4. Regulatory & Legal
RTX Corporation
- Subject to stringent U.S. and international defense regulations; compliance costs may rise amid geopolitical tensions.
Northrop Grumman Corporation
- Similar regulatory challenges, but diversified product lines may mitigate impact of specific legal risks.
5. Supply Chain & Operations
RTX Corporation
- Complex global supply chains for aerospace components remain vulnerable to disruption and cost inflation.
Northrop Grumman Corporation
- Also exposed to supply chain risks, but focused segments may offer better operational control.
6. ESG & Climate Transition
RTX Corporation
- Increasing ESG pressures could raise capital costs; sustainability initiatives are still developing.
Northrop Grumman Corporation
- Faces growing ESG scrutiny but shows progress in integrating climate transition strategies.
7. Geopolitical Exposure
RTX Corporation
- Heavy reliance on U.S. and allied government contracts exposes it to shifting defense budgets and foreign policy risks.
Northrop Grumman Corporation
- Similar geopolitical risks; however, its focus on strategic missile defense may benefit from rising global tensions.
Which company shows a better risk-adjusted profile?
Northrop Grumman faces fewer financial vulnerabilities with strong liquidity, superior ROE, and a safer Altman Z-Score. RTX’s liquidity weaknesses and moderate profitability dampen its risk profile despite solid debt metrics. NOC’s low beta and defensive positioning further strengthen its risk-adjusted appeal. The most impactful risk for RTX is its poor liquidity ratios, raising short-term solvency concerns. For Northrop Grumman, the high price-to-book ratio signals valuation risk despite strong fundamentals. Recent market moves confirm NOC’s resilience through low volatility and stable cash flow, justifying my preference for its risk-adjusted profile.
Final Verdict: Which stock to choose?
RTX Corporation’s superpower lies in its robust income growth and expanding margins, signaling effective operational leverage. Its point of vigilance is the declining return on invested capital, which hints at potential value erosion ahead. RTX suits portfolios targeting aggressive growth with tolerance for operational risks.
Northrop Grumman commands a strategic moat through superior capital efficiency and a strong return on equity, reflecting disciplined capital allocation. Its balance sheet strength and safer liquidity profile make it a more stable choice compared to RTX. Northrop Grumman fits well within GARP portfolios seeking steady growth with reasonable risk.
If you prioritize high-growth potential and can weather some value dilution, RTX is compelling due to its accelerating revenue and earnings momentum. However, if you seek better stability and capital efficiency with a proven moat, Northrop Grumman outshines as the more prudent option. Each stock addresses distinct investor profiles amid sector headwinds.
Disclaimer: Investment carries a risk of loss of initial capital. The past performance is not a reliable indicator of future results. Be sure to understand risks before making an investment decision.
Go Further
I encourage you to read the complete analyses of RTX Corporation and Northrop Grumman Corporation to enhance your investment decisions: