Home > Comparison > Financial Services > BK vs NTRS
The strategic rivalry between The Bank of New York Mellon Corporation and Northern Trust Corporation shapes asset management’s evolution. BNY Mellon operates as a diversified financial powerhouse with broad custody and wealth services, while Northern Trust focuses on specialized wealth management and institutional asset servicing. This analysis pits broadscale diversification against targeted expertise to determine which model offers superior risk-adjusted returns in today’s complex financial landscape. I aim to identify the optimal choice for a resilient, diversified portfolio.

Table of contents
Companies Overview
The Bank of New York Mellon Corporation and Northern Trust Corporation stand as pillars in the global asset management arena.
The Bank of New York Mellon Corporation: Global Custody and Investment Services Leader
The Bank of New York Mellon Corporation dominates asset management with a broad custody and securities services platform. It generates revenue through custody, trust, investment management, and market services. In 2026, it strategically emphasizes integrated cash management and data analytics to enhance client solutions across financial institutions and high-net-worth individuals.
Northern Trust Corporation: Specialized Wealth and Asset Servicing Powerhouse
Northern Trust Corporation excels in wealth management and asset servicing tailored to institutions and affluent families. Its revenue stems from trust services, investment management, and asset servicing. The firm prioritizes expanding both its asset servicing capabilities and wealth advisory solutions, focusing on customized financial consulting and risk management.
Strategic Collision: Similarities & Divergences
Both firms share a foundation in asset management and custody, but BNY Mellon operates with a broader, more diversified service spectrum. Northern Trust adopts a more relationship-driven, tailored wealth management approach. Their primary battleground is institutional asset servicing versus personalized wealth advisory. This divergence creates distinct investment profiles: BNY Mellon offers scale and breadth, while Northern Trust emphasizes client intimacy and specialized services.
Income Statement Comparison
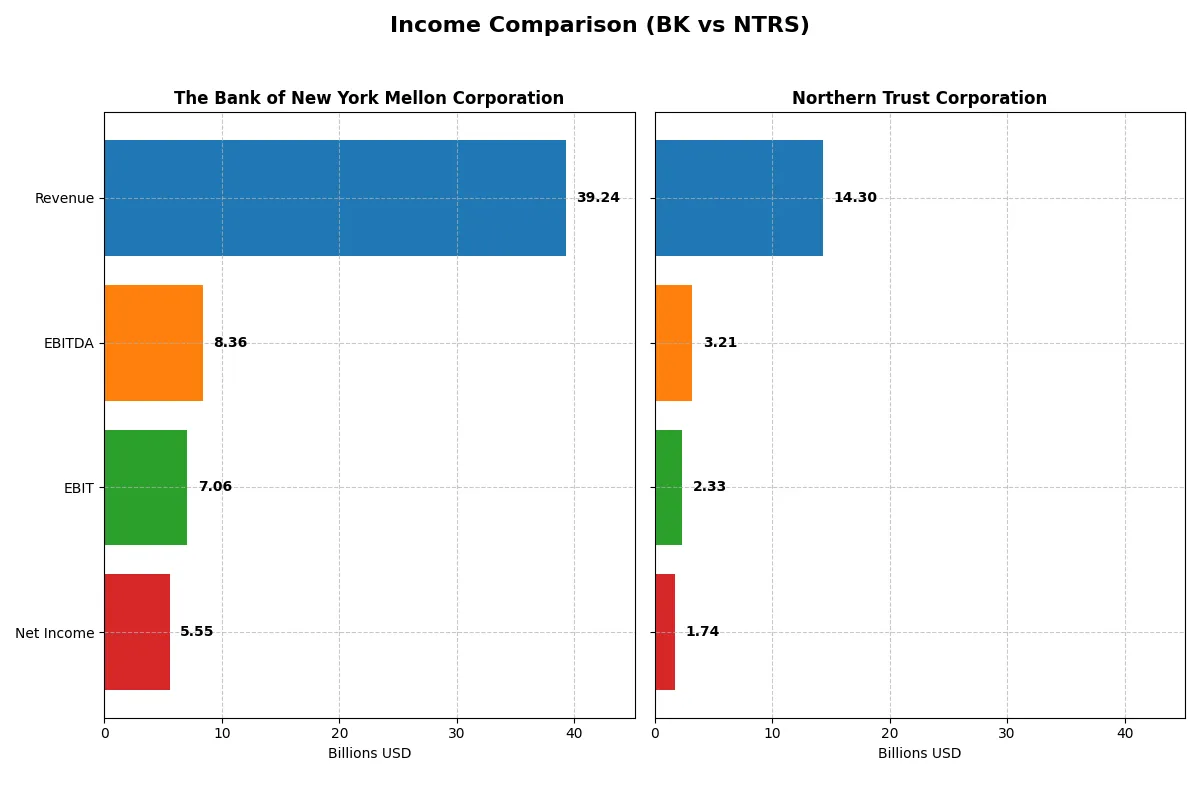
This data dissects the core profitability and scalability of both corporate engines to reveal who dominates the bottom line:
| Metric | The Bank of New York Mellon Corporation (BK) | Northern Trust Corporation (NTRS) |
|---|---|---|
| Revenue | 39.2B | 14.3B |
| Cost of Revenue | 19.4B | 6.2B |
| Operating Expenses | 12.8B | 5.8B |
| Gross Profit | 19.9B | 8.1B |
| EBITDA | 8.4B | 3.2B |
| EBIT | 7.1B | 2.3B |
| Interest Expense | 20.7B | 6.2B |
| Net Income | 5.5B | 1.7B |
| EPS | 7.46 | 8.79 |
| Fiscal Year | 2025 | 2025 |
Income Statement Analysis: The Bottom-Line Duel
This Income Statement comparison reveals which company runs a more efficient and profitable financial engine in the current market environment.
The Bank of New York Mellon Corporation Analysis
BK’s revenue rose sharply from 16B in 2021 to 39B in 2025, showing strong top-line growth despite a slight dip in 2025. Net income climbed from 3.8B to 5.5B over the period, with net margin expanding to a healthy 14.1%. Gross and EBIT margins remain robust at 50.6% and 18.0%, signaling efficient cost control and operational leverage.
Northern Trust Corporation Analysis
NTRS grew revenue steadily from 6.5B in 2021 to 14.3B in 2025, though it fell nearly 10% in the latest year. Net income increased modestly to 1.7B but declined alongside margins, with net margin slipping to 12.2%. Gross margin held at 56.5%, higher than BK, but EBIT margin contracted to 16.3%, reflecting pressure on operational efficiency and profitability.
Verdict: Margin Power vs. Revenue Scale
BK outpaces NTRS with superior revenue growth and stronger EBIT and net margins, delivering more consistent profit expansion. NTRS shows better gross margin but struggles with margin sustainability and recent earnings decline. Investors focused on scalable profit engines may find BK’s profile more compelling given its robust margin improvement and bottom-line momentum.
Financial Ratios Comparison
These vital ratios act as a diagnostic tool to expose underlying fiscal health, valuation premiums, and capital efficiency of the companies compared:
| Ratios | The Bank of New York Mellon Corporation (BK) | Northern Trust Corporation (NTRS) |
|---|---|---|
| ROE | 12.5% | 13.4% |
| ROIC | 6.4% | 5.0% |
| P/E | 14.7 | 14.7 |
| P/B | 1.85 | 1.98 |
| Current Ratio | 0.70 | 0.41 |
| Quick Ratio | 0.70 | 0.41 |
| D/E (Debt-to-Equity) | 0.76 | 1.27 |
| Debt-to-Assets | 7.2% | 9.3% |
| Interest Coverage | 0.34 | 0.38 |
| Asset Turnover | 0.08 | 0.08 |
| Fixed Asset Turnover | 11.0 | 30.8 |
| Payout ratio | 25.4% | 33.5% |
| Dividend yield | 1.7% | 2.3% |
| Fiscal Year | 2025 | 2025 |
Efficiency & Valuation Duel: The Vital Signs
Financial ratios act as the company’s DNA, revealing hidden risks and operational excellence that drive investor confidence and portfolio decisions.
The Bank of New York Mellon Corporation
BK posts a solid net margin of 14.14%, reflecting decent profitability, while its ROE at 12.52% signals moderate shareholder returns. The P/E ratio of 14.74 indicates a fairly valued stock. Dividend yield stands at 1.72%, showing consistent shareholder payouts amid neutral capital efficiency and slightly unfavorable liquidity metrics.
Northern Trust Corporation
NTRS shows a favorable net margin of 12.15%, with ROE at 13.4%, indicating strong profitability and shareholder value. The P/E ratio of 14.75 suggests the stock is reasonably priced. Dividend yield is higher at 2.27%, reflecting a more generous return, although higher leverage and weaker liquidity ratios raise some concerns.
Moderate Valuation Meets Operational Trade-Offs
Both BK and NTRS trade near similar P/E levels with respectable profitability. BK offers stable dividends with balanced capital structure, while NTRS delivers higher yield but with elevated debt and weaker liquidity. Investors seeking income might prefer NTRS’s profile, whereas BK suits those prioritizing operational stability.
Which one offers the Superior Shareholder Reward?
I compare BK and NTRS distribution strategies in 2025. BK pays a 1.7% dividend yield with a 25% payout ratio, showing conservative income distribution. NTRS offers a higher 2.3% yield and a 33% payout, balancing income with growth. BK’s buybacks are modest but consistent, supporting steady returns. NTRS lacks clear buyback data but reinvests heavily in growth, suggesting capital appreciation focus. BK’s model is more sustainable given its stronger free cash flow coverage. I conclude BK offers a more attractive total return profile for income-focused investors in 2026.
Comparative Score Analysis: The Strategic Profile
The radar chart reveals the fundamental DNA and trade-offs of The Bank of New York Mellon Corporation and Northern Trust Corporation:
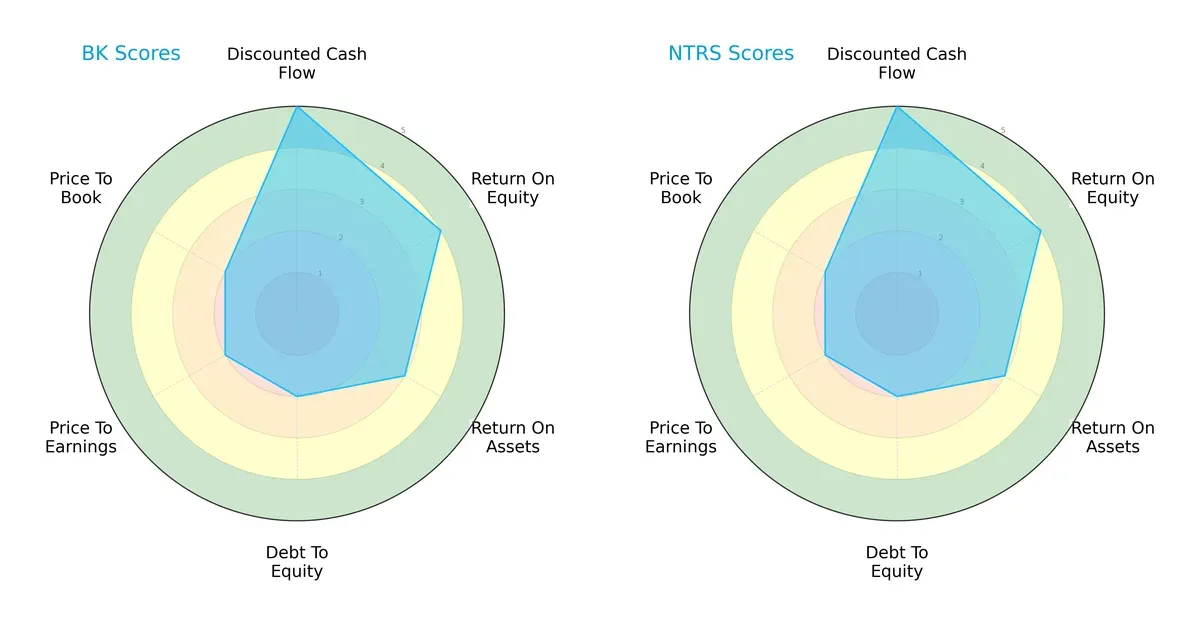
Both firms show identical scores across DCF (5), ROE (4), ROA (3), Debt/Equity (2), and Valuation metrics (PE and PB at 2 each). This parity suggests a balanced profile with no clear edge for either company. Both rely on solid discounted cash flow projections but are moderate in financial leverage and valuation appeal. Neither stands out as a distinct outperformer, pointing to similar strategic positions in the sector.
Bankruptcy Risk: Solvency Showdown
The Altman Z-Scores place both banks deep in the distress zone, signaling elevated bankruptcy risk in this cycle:
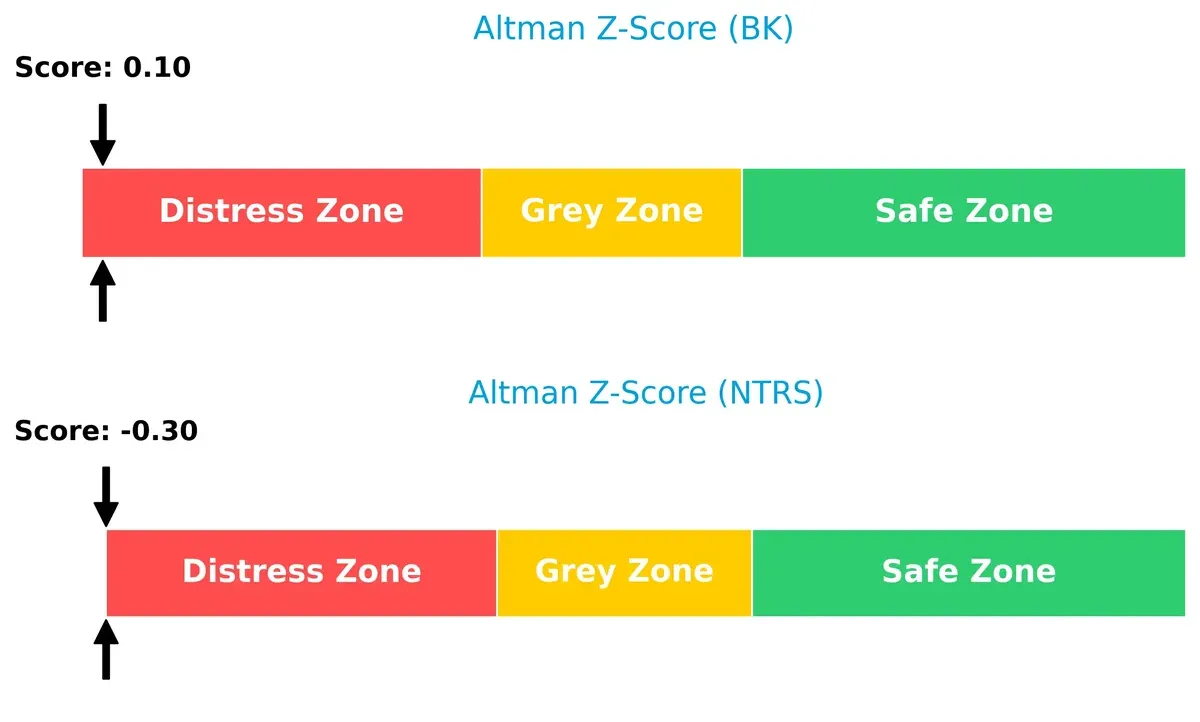
The Bank of New York Mellon scores 0.10, while Northern Trust scores -0.30, with both far below the 1.8 safe threshold. This indicates high financial vulnerability and potential insolvency risks, demanding caution from long-term investors amid uncertain macro conditions.
Financial Health: Quality of Operations
Northern Trust edges ahead in financial health with a stronger Piotroski F-Score, signaling superior operational quality:
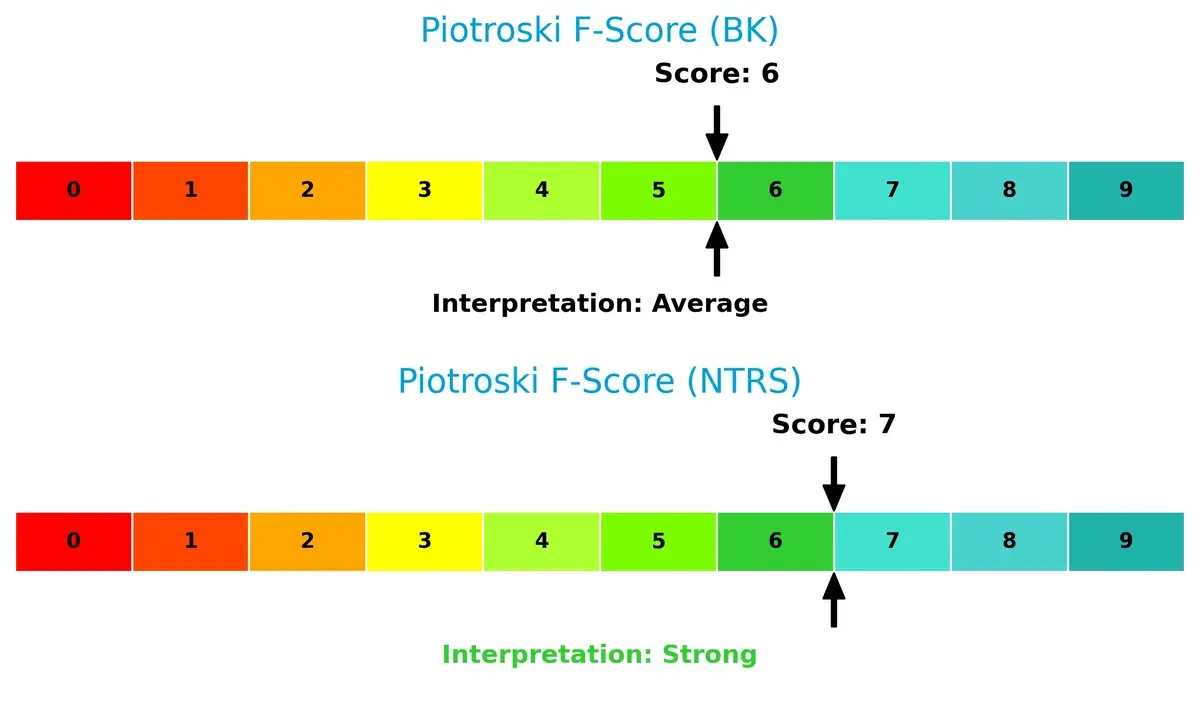
Northern Trust scores 7 (strong), whereas The Bank of New York Mellon scores 6 (average). While both show no immediate red flags, Northern Trust’s higher score reflects better profitability, liquidity, and efficiency metrics, suggesting more robust internal financial controls and resilience.
How are the two companies positioned?
This section dissects the operational DNA of BK and NTRS by comparing their revenue distribution and internal dynamics. The goal is to confront their economic moats to reveal which model offers the most resilient competitive advantage today.
Revenue Segmentation: The Strategic Mix
This visual comparison dissects how The Bank of New York Mellon Corporation and Northern Trust Corporation diversify their income streams and where their primary sector bets lie:
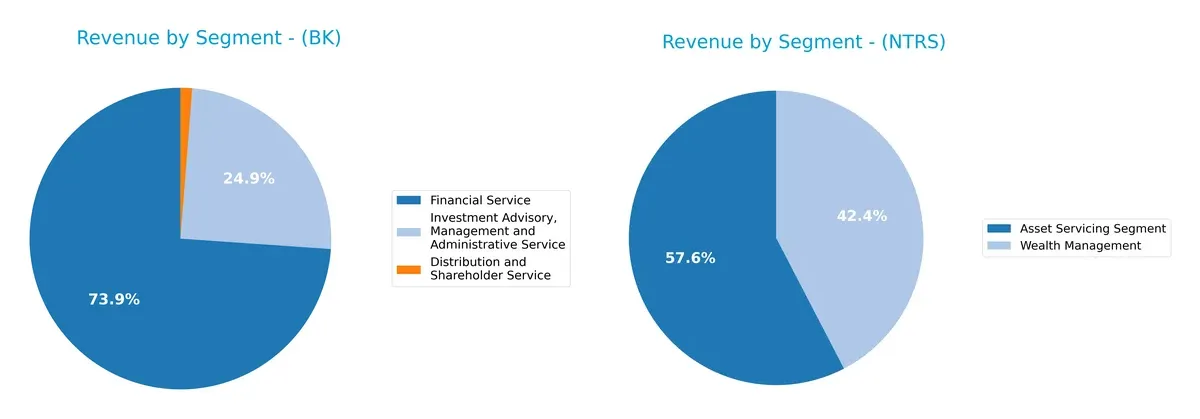
The Bank of New York Mellon leans heavily on Financial Service, generating $9.3B, while also anchoring $3.1B from Investment Advisory. Northern Trust splits revenue more evenly between Asset Servicing ($4.4B) and Wealth Management ($3.2B). BK’s concentration in Financial Service signals infrastructure dominance but heightens concentration risk. NTRS’s balanced mix suggests diversified client exposure and less vulnerability to a single segment’s downturn.
Strengths and Weaknesses Comparison
This table compares the strengths and weaknesses of BK and NTRS across key financial and strategic dimensions:
BK Strengths
- Diversified revenue streams across Financial Services, Investment Advisory, and Distribution
- Strong presence in the US and significant revenue from Asia Pacific and EMEA
- Favorable net margin and dividend yield
- Favorable debt-to-assets ratio
- High fixed asset turnover
NTRS Strengths
- Focused revenue in Asset Servicing and Wealth Management
- Favorable net margin and dividend yield
- Favorable fixed asset turnover and debt-to-assets ratio
- Balanced domestic and foreign revenue with growing foreign presence
BK Weaknesses
- Unfavorable current and quick ratios indicating liquidity concerns
- Unfavorable interest coverage and asset turnover ratios
- WACC significantly higher than ROIC, indicating capital inefficiency
- Neutral ROE and PB ratios suggest limited profitability growth
- Slightly unfavorable global ratios evaluation
NTRS Weaknesses
- Unfavorable debt-to-equity ratio signaling higher leverage risk
- Low current and quick ratios indicate liquidity pressure
- Unfavorable interest coverage ratio
- WACC exceeds ROIC, pointing to capital allocation challenges
- Slightly unfavorable global ratios evaluation
BK demonstrates broad diversification and strong asset turnover but faces liquidity and capital efficiency challenges. NTRS shows strengths in profitability and asset utilization but carries higher leverage and liquidity risks. Both companies must address capital allocation inefficiencies to improve their financial stability.
The Moat Duel: Analyzing Competitive Defensibility
A structural moat stands as the sole shield protecting long-term profits from relentless competitive erosion:
The Bank of New York Mellon Corporation: Custody & Scale Moat
I see BNY Mellon’s moat rooted in its vast custody and asset servicing scale. This creates high switching costs and steady revenue streams, reflected in its stable 18% EBIT margin. Its growing ROIC trend suggests improving capital efficiency, though current value destruction signals caution. Expansion into data analytics and integrated cash management may deepen its moat in 2026.
Northern Trust Corporation: Wealth Management & Client Loyalty
Northern Trust’s moat centers on intimate wealth management relationships, contrasting BNY Mellon’s scale focus. Its higher gross margin (56.5%) signals pricing power, but declining ROIC and shrinking profitability warn of weakening competitive positioning. Opportunities lie in expanding alternative asset classes and private banking, but market disruption risks loom large.
Scale Economies vs. Client Intimacy: Who Defends Better?
BNY Mellon’s scale-driven moat shows a recovering ROIC trend despite value destruction. Northern Trust suffers from a shrinking moat with declining returns. I conclude BNY Mellon holds the deeper moat and is better positioned to defend market share in 2026.
Which stock offers better returns?
The past year shows marked bullish trends for both stocks, with The Bank of New York Mellon Corp. accelerating after a strong price surge. Northern Trust Corp. also gains traction, displaying robust upward momentum.
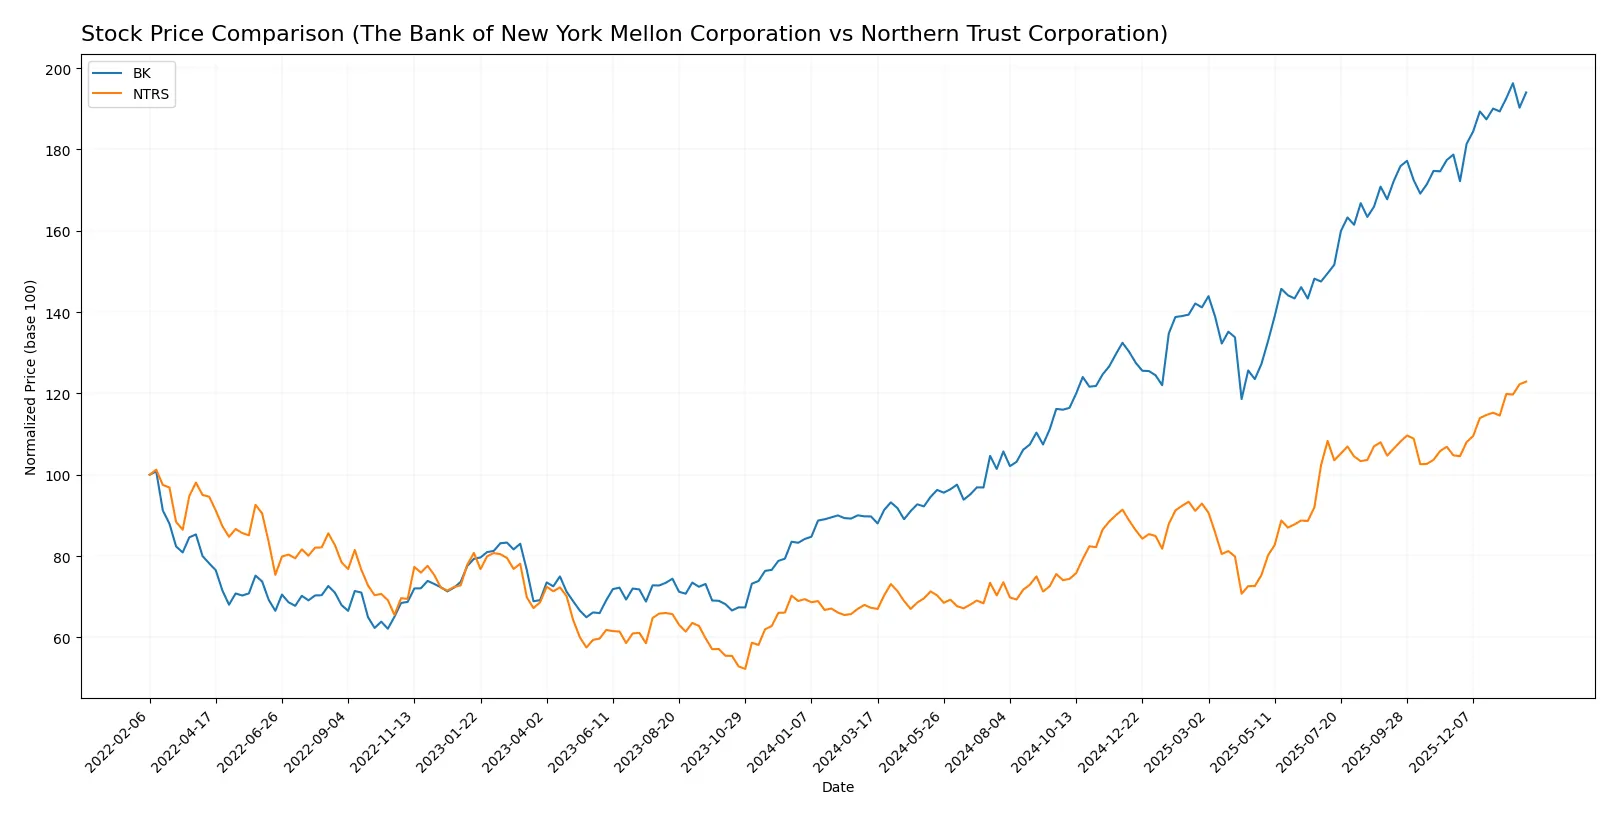
Trend Comparison
The Bank of New York Mellon Corp. stock rose 116.19% over 12 months, marking a bullish trend with acceleration and a high volatility level (19.39 std deviation). The price peaked at 121.33 and bottomed at 54.41.
Northern Trust Corp. increased 82.65% over the same period, also bullish with acceleration but slightly higher volatility (19.71 std deviation). Its highest price was 149.43, lowest 81.45, showing solid gains.
Comparing trends, BK outperformed NTRS with a 116.19% gain versus 82.65%. Both show acceleration, but BK delivered the highest market performance over the year.
Target Prices
Analysts present confident target price ranges for both The Bank of New York Mellon Corporation and Northern Trust Corporation.
| Company | Target Low | Target High | Consensus |
|---|---|---|---|
| The Bank of New York Mellon Corporation (BK) | 110 | 143 | 130.25 |
| Northern Trust Corporation (NTRS) | 131 | 160 | 146.17 |
The consensus target prices for BK and NTRS exceed their current prices of 119.92 and 149.43 respectively, signaling moderate upside potential. Analysts expect both financial services firms to outperform their current valuations.

Don’t Let Luck Decide Your Entry Point
Optimize your entry points with our advanced ProRealTime indicators. You’ll get efficient buy signals with precise price targets for maximum performance. Start outperforming now!
How do institutions grade them?
The following tables summarize recent institutional grades for The Bank of New York Mellon Corporation and Northern Trust Corporation:
The Bank of New York Mellon Corporation Grades
This table presents the latest grade updates from various reputable firms:
| Grading Company | Action | New Grade | Date |
|---|---|---|---|
| Citigroup | Maintain | Neutral | 2026-01-14 |
| Morgan Stanley | Maintain | Overweight | 2026-01-14 |
| RBC Capital | Maintain | Sector Perform | 2026-01-14 |
| Wells Fargo | Maintain | Equal Weight | 2026-01-14 |
| Keefe, Bruyette & Woods | Maintain | Outperform | 2026-01-14 |
| Truist Securities | Upgrade | Buy | 2026-01-07 |
| TD Cowen | Maintain | Buy | 2026-01-07 |
| Barclays | Maintain | Overweight | 2026-01-05 |
Northern Trust Corporation Grades
This table shows recent grade assessments by major financial institutions:
| Grading Company | Action | New Grade | Date |
|---|---|---|---|
| Goldman Sachs | Maintain | Sell | 2026-01-28 |
| Citigroup | Maintain | Neutral | 2026-01-28 |
| TD Cowen | Maintain | Buy | 2026-01-26 |
| Wells Fargo | Maintain | Equal Weight | 2026-01-23 |
| RBC Capital | Maintain | Outperform | 2026-01-23 |
| Evercore ISI Group | Maintain | In Line | 2026-01-23 |
| Morgan Stanley | Maintain | Underweight | 2026-01-23 |
| Barclays | Maintain | Equal Weight | 2026-01-05 |
Which company has the best grades?
The Bank of New York Mellon generally receives stronger grades, including multiple “Buy” and “Outperform” ratings. Northern Trust faces notable “Sell” and “Underweight” grades. These differences could influence investor sentiment and portfolio positioning.
Risks specific to each company
The following categories identify the critical pressure points and systemic threats facing both firms in the 2026 market environment:
1. Market & Competition
The Bank of New York Mellon Corporation
- Larger market cap and broader service segments provide scale advantages but face intense asset management competition.
Northern Trust Corporation
- Smaller market cap, focuses on wealth and asset servicing niches, competing aggressively with innovative digital services.
2. Capital Structure & Debt
The Bank of New York Mellon Corporation
- Moderate debt-to-equity (0.76), favorable debt-to-assets (7.17%) but weak interest coverage (0.34) signals risk in servicing debt.
Northern Trust Corporation
- Higher debt-to-equity (1.27) and similar interest coverage (0.38) increase financial leverage risk compared to BK.
3. Stock Volatility
The Bank of New York Mellon Corporation
- Beta of 1.109 indicates moderate market sensitivity, fitting typical financial services volatility.
Northern Trust Corporation
- Higher beta at 1.285 suggests greater stock price fluctuations and sensitivity to market swings.
4. Regulatory & Legal
The Bank of New York Mellon Corporation
- Operates globally with complex regulatory oversight across multiple jurisdictions, raising compliance costs.
Northern Trust Corporation
- Also faces stringent regulatory environments but with less geographic breadth, slightly reducing complexity.
5. Supply Chain & Operations
The Bank of New York Mellon Corporation
- Relies heavily on technology and data centers; operational risks include cybersecurity and IT disruptions.
Northern Trust Corporation
- Similar operational risk profile, but smaller scale could mean less operational redundancy and resilience.
6. ESG & Climate Transition
The Bank of New York Mellon Corporation
- Increasing pressure to align investments with ESG goals; exposure to renewable energy investments adds transition risk.
Northern Trust Corporation
- ESG integration is critical; smaller asset base may limit scale but could ease agile adaptation to climate policies.
7. Geopolitical Exposure
The Bank of New York Mellon Corporation
- Significant international operations expose BK to geopolitical tensions and currency risk.
Northern Trust Corporation
- Less global footprint reduces exposure but still vulnerable to U.S. and select international political risks.
Which company shows a better risk-adjusted profile?
The Bank of New York Mellon faces considerable debt servicing risk and complex regulatory burdens but benefits from scale and diversification. Northern Trust’s higher leverage and stock volatility elevate its financial risk, despite stronger Piotroski scores indicating operational resilience. BK’s broader market presence and more balanced capital structure suggest a marginally better risk-adjusted profile. Notably, BK’s unfavorable interest coverage ratio signals caution, while Northern Trust’s elevated beta warns of greater market sensitivity.
Final Verdict: Which stock to choose?
The Bank of New York Mellon Corporation (BK) shines with its operational efficiency and accelerating profitability, making it a robust cash generator. Its point of vigilance lies in a stretched current ratio, signaling liquidity risks. BK suits an aggressive growth portfolio seeking exposure to a financial powerhouse improving its returns amid challenging capital costs.
Northern Trust Corporation (NTRS) boasts a strategic moat through strong asset turnover and a higher dividend yield, underpinning its recurring revenue safety. It carries a more conservative risk profile compared to BK, despite signs of declining profitability. NTRS fits well within a GARP (Growth at a Reasonable Price) portfolio focused on income and moderate growth stability.
If you prioritize aggressive growth and operational momentum, BK is the compelling choice due to its improving profitability and solid cash generation. However, if you seek income stability with a defensive edge, NTRS offers better stability and a reliable dividend, despite its challenges in maintaining profitability. Both demand caution given liquidity constraints and value destruction signals, underscoring the importance of matching investment style to risk tolerance.
Disclaimer: Investment carries a risk of loss of initial capital. The past performance is not a reliable indicator of future results. Be sure to understand risks before making an investment decision.
Go Further
I encourage you to read the complete analyses of The Bank of New York Mellon Corporation and Northern Trust Corporation to enhance your investment decisions: