Home > Comparison > Financial Services > STT vs NTRS
The strategic rivalry between State Street Corporation and Northern Trust Corporation shapes the trajectory of asset management. State Street operates as a broad-based financial services powerhouse with diversified institutional offerings. Northern Trust focuses on wealth management and tailored asset servicing for high-net-worth clients. This analysis explores which business model delivers superior risk-adjusted returns, balancing scale against specialization, to guide investors seeking durable leadership within financial services.

Table of contents
Companies Overview
State Street Corporation and Northern Trust Corporation stand as titans in the global asset management landscape.
State Street Corporation: Institutional Asset Management Powerhouse
State Street Corporation dominates as a global asset management and investment servicing leader. It generates revenue through custody, trading services, portfolio management, and alternative investment strategies. In 2026, its strategic focus sharpens on expanding ESG investing and enhancing data-driven analytics, reinforcing its competitive edge in institutional investor solutions.
Northern Trust Corporation: Wealth and Asset Servicing Specialist
Northern Trust Corporation excels in wealth management and asset servicing for corporations and high-net-worth clients. Its core revenue stems from custody, investment management, brokerage, and private banking services. The company prioritizes tailored wealth solutions while advancing risk analytics and private equity offerings, targeting affluent clients and institutional investors in 2026.
Strategic Collision: Similarities & Divergences
Both firms emphasize asset servicing but diverge in client focus—State Street targets institutional investors, Northern Trust balances high-net-worth individuals and institutions. They compete fiercely in custody and risk analytics, yet State Street leans on scale and ETFs, whereas Northern Trust favors personalized wealth management. Their distinct business models forge contrasting investment profiles: broad institutional reach versus boutique client engagement.
Income Statement Comparison
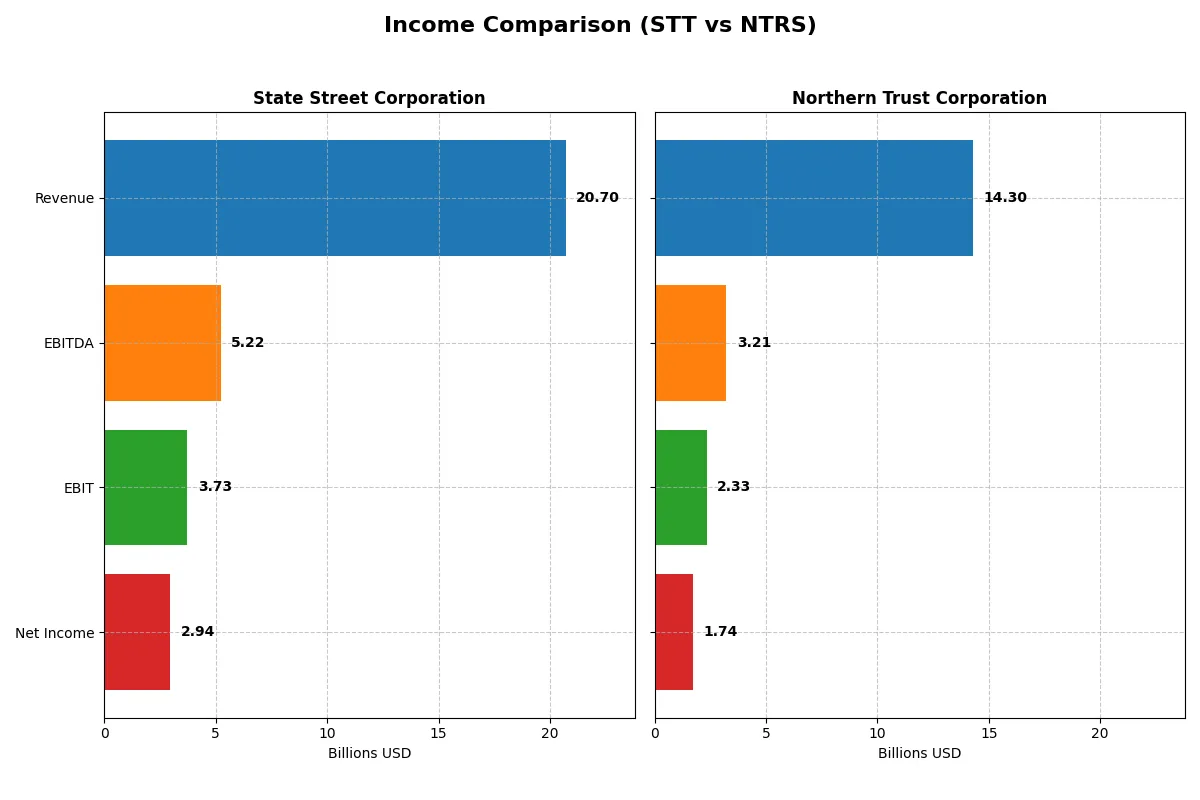
This data dissects the core profitability and scalability of both corporate engines to reveal who dominates the bottom line:
| Metric | State Street Corporation (STT) | Northern Trust Corporation (NTRS) |
|---|---|---|
| Revenue | 20.7B | 14.3B |
| Cost of Revenue | 6.79B | 6.21B |
| Operating Expenses | 10.18B | 5.75B |
| Gross Profit | 13.91B | 8.09B |
| EBITDA | 5.22B | 3.21B |
| EBIT | 3.73B | 2.33B |
| Interest Expense | 8.68B | 6.21B |
| Net Income | 2.95B | 1.74B |
| EPS | 9.56 | 8.79 |
| Fiscal Year | 2025 | 2025 |
Income Statement Analysis: The Bottom-Line Duel
This income statement comparison reveals the true efficiency and profitability of two financial sector leaders over recent years.
State Street Corporation Analysis
State Street grew revenue by 72% from 2021 to 2025, despite a 5.8% dip in 2025. Gross margin held strong at 67.2%, showcasing robust cost control. Net income rose steadily, hitting $2.95B in 2025. EBIT margin expanded to 18%, reflecting improving operational efficiency and solid momentum despite rising interest expenses.
Northern Trust Corporation Analysis
Northern Trust’s revenue surged 120% over five years but contracted nearly 10% in 2025. Gross margin declined to 56.5%, signaling margin pressure. Net income grew moderately to $1.74B in 2025 but EBIT margin slipped to 16.3%. The company faces margin compression and weaker earnings momentum, exacerbated by elevated interest expenses.
Margin Strength vs. Revenue Growth
State Street delivers superior margin health and consistent net income expansion, while Northern Trust boasts higher revenue growth but weaker profitability. State Street’s efficient cost management and margin resilience give it a fundamental edge. Investors seeking steady earnings growth should favor State Street’s disciplined profitability profile.
Financial Ratios Comparison
These vital ratios act as a diagnostic tool to expose the underlying fiscal health, valuation premiums, and capital efficiency of the companies compared below:
| Ratios | State Street Corporation (STT) | Northern Trust Corporation (NTRS) |
|---|---|---|
| ROE | 10.58% | 13.40% |
| ROIC | 2.72% | 5.04% |
| P/E | 12.27 | 14.75 |
| P/B | 1.30 | 1.98 |
| Current Ratio | 3.59 | 0.41 |
| Quick Ratio | 3.59 | 0.41 |
| D/E | 1.07 | 1.27 |
| Debt-to-Assets | 8.14% | 9.27% |
| Interest Coverage | 0.43 | 0.38 |
| Asset Turnover | 0.06 | 0.08 |
| Fixed Asset Turnover | 6.52 | 30.78 |
| Payout ratio | 29.66% | 33.47% |
| Dividend yield | 2.42% | 2.27% |
| Fiscal Year | 2025 | 2025 |
Efficiency & Valuation Duel: The Vital Signs
Ratios serve as a company’s DNA, revealing hidden risks and operational excellence beyond the surface numbers.
State Street Corporation
State Street shows a solid net margin at 14.23% and a moderate ROE of 10.58%, suggesting steady profitability. Its P/E of 12.27 and P/B of 1.3 mark the stock as reasonably valued, not stretched. The 2.42% dividend yield reflects a shareholder-friendly policy, balancing payouts with reinvestment in operational efficiency.
Northern Trust Corporation
Northern Trust posts a respectable 12.15% net margin and a higher ROE of 13.4%, indicating efficient equity use. Its P/E at 14.75 suggests a slightly pricier valuation compared to peers, while a P/B of 1.98 borders on neutral. The 2.27% dividend yield signals consistent shareholder returns, with capital also allocated to growth initiatives.
Valuation Discipline vs. Operational Efficiency
State Street offers a more favorable valuation profile with balanced profitability and a higher dividend yield. Northern Trust delivers stronger ROE but trades at a premium with fewer favorable ratios overall. Investors prioritizing valuation discipline may lean toward State Street, while those favoring operational efficiency might prefer Northern Trust’s profile.
Which one offers the Superior Shareholder Reward?
I compare State Street Corporation (STT) and Northern Trust Corporation (NTRS) on dividends, payout ratios, and buybacks. STT yields 2.4% with a 30% payout ratio and moderate buybacks. NTRS yields 2.3% with a 33% payout and less intense buybacks. STT’s lower payout ratio and consistent buybacks suggest a more sustainable model. NTRS pays a slightly higher dividend but trades at a higher price-to-book, indicating less margin of safety. I find STT offers superior total shareholder reward in 2026 given its balanced distribution and capital allocation discipline.
Comparative Score Analysis: The Strategic Profile
The radar chart reveals the fundamental DNA and trade-offs of State Street Corporation and Northern Trust Corporation:
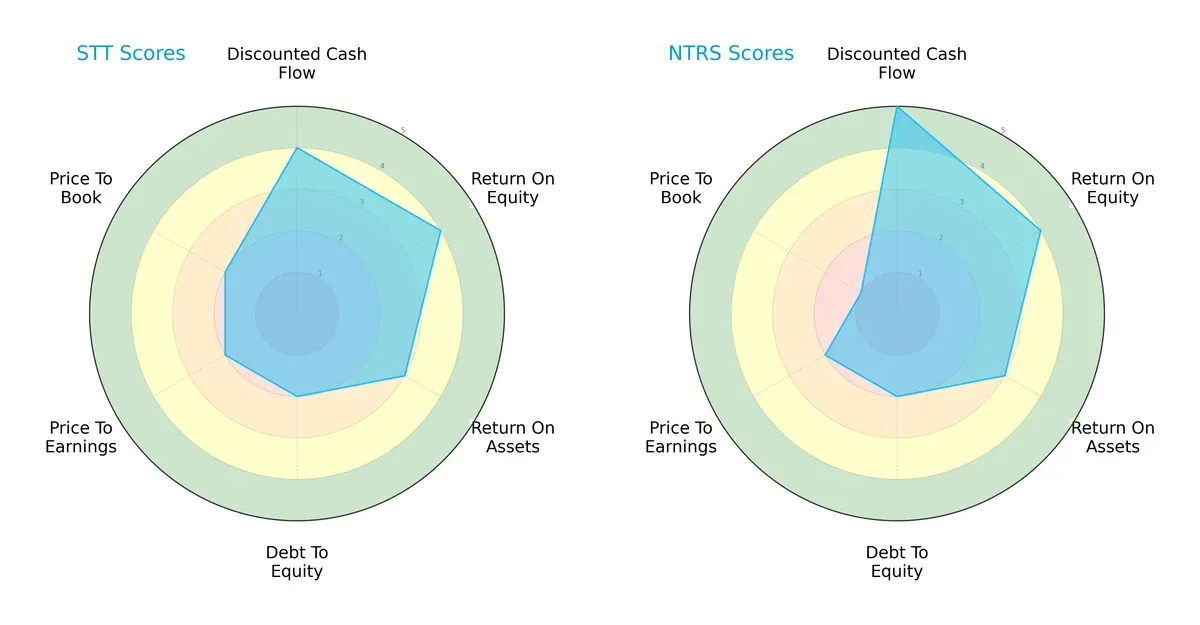
State Street (STT) and Northern Trust (NTRS) share balanced overall scores of 3. NTRS edges STT with a superior discounted cash flow score (5 vs. 4), suggesting stronger future cash flow projections. Both firms show equal return on equity (4) and return on assets (3), signaling comparable operational efficiency. Debt-to-equity scores match at 2, indicating similar leverage risk. However, STT holds a slight valuation advantage on price-to-book (2 vs. 1), implying better market pricing relative to book value. Overall, NTRS leans on cash flow strength, while STT offers a more balanced valuation profile.
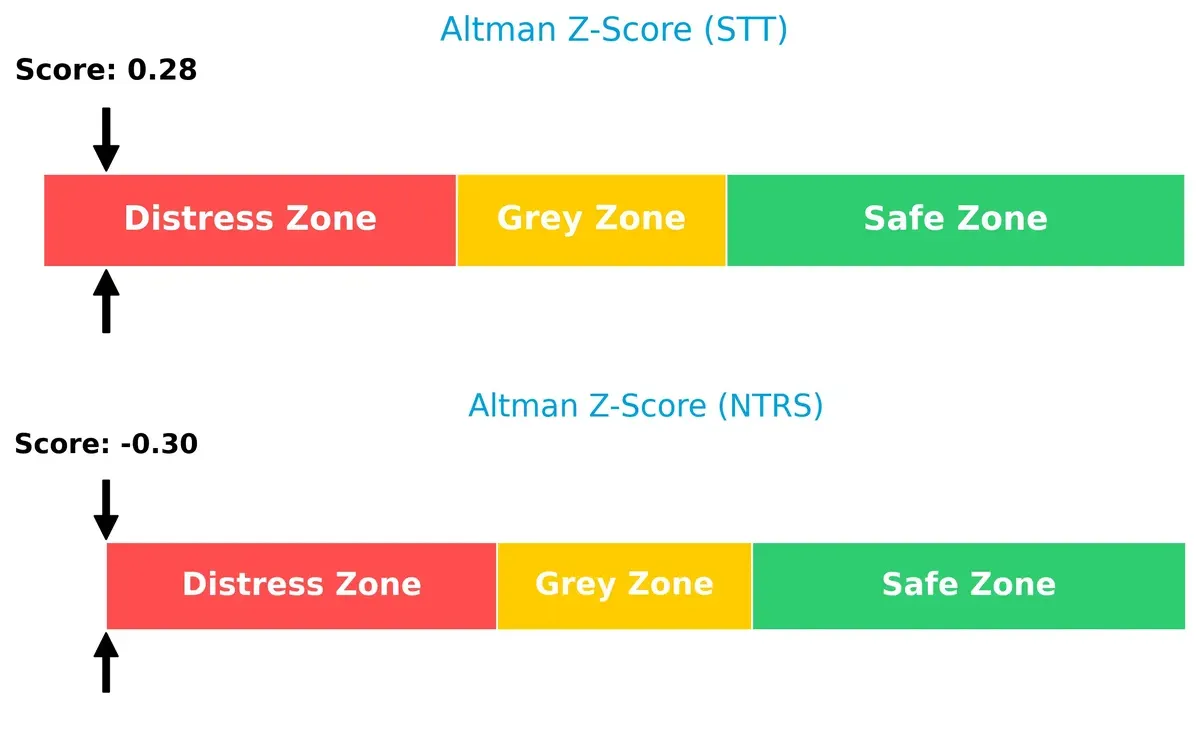
Bankruptcy Risk: Solvency Showdown
The Altman Z-Scores place both firms in the distress zone, with STT at 0.28 and NTRS at -0.30, signaling high bankruptcy risk in this cycle:
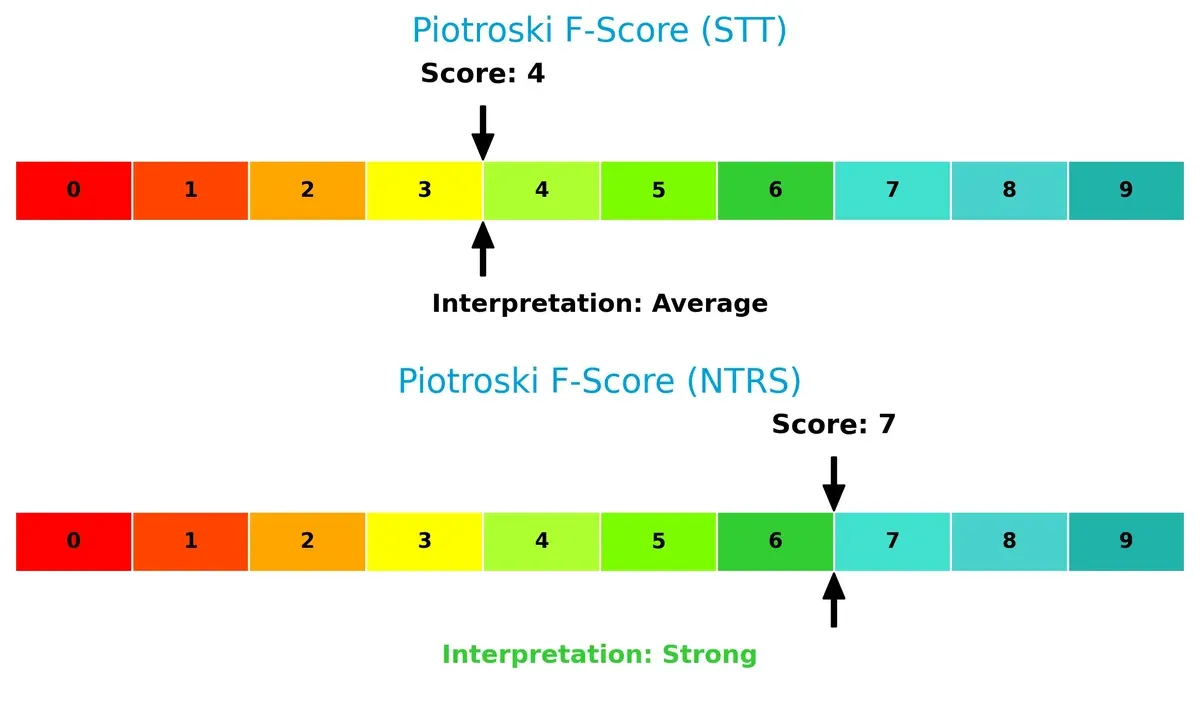
Financial Health: Quality of Operations
Northern Trust outperforms State Street in financial health, boasting a Piotroski F-Score of 7 versus STT’s 4, indicating stronger internal metrics and fewer red flags:
How are the two companies positioned?
This section dissects the operational DNA of State Street and Northern Trust by comparing revenue distribution and internal dynamics. The goal is to confront their economic moats and identify the most resilient, sustainable advantage today.
Revenue Segmentation: The Strategic Mix
The following visual comparison dissects how State Street Corporation and Northern Trust Corporation diversify their income streams and where their primary sector bets lie:
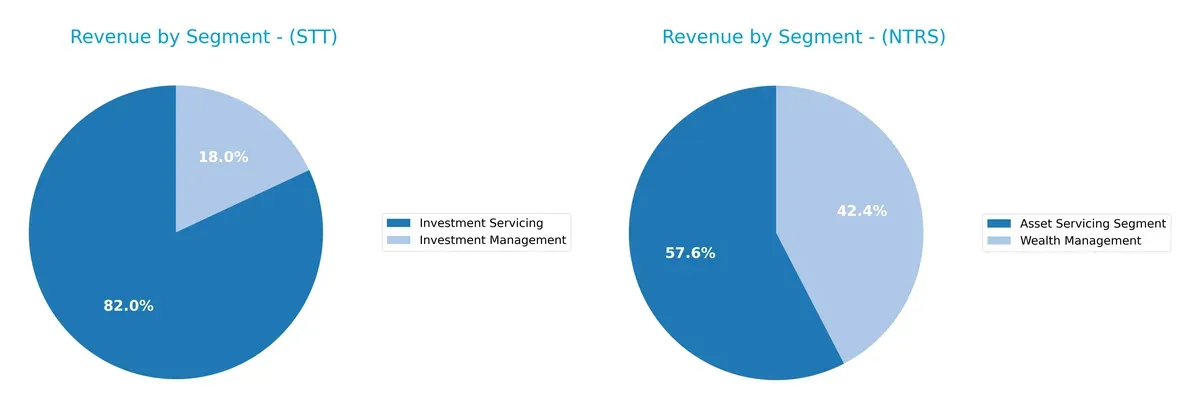
State Street anchors its revenue in Investment Servicing, generating $10.7B in 2024, dwarfing its $2.3B Investment Management segment. Northern Trust shows a more balanced mix, with $4.4B in Asset Servicing and $3.2B in Wealth Management. State Street’s heavy reliance on servicing exposes it to concentration risk but benefits from infrastructure dominance. Northern Trust’s diversified streams reduce risk and pivot on wealth advisory growth.
Strengths and Weaknesses Comparison
This table compares the strengths and weaknesses of State Street Corporation and Northern Trust Corporation:
State Street Corporation Strengths
- Higher net margin at 14.23%
- Favorable P/E of 12.27
- Strong dividend yield of 2.42%
- Balanced US and Non-US revenue near 7.5B and 5.5B
- Favorable fixed asset turnover at 6.52
- Lower debt to assets at 8.14%
Northern Trust Corporation Strengths
- Higher ROE and neutral ROIC at 13.4% and 5.04%
- Favorable fixed asset turnover significantly higher at 30.78
- Strong net margin of 12.15%
- Consistent wealth management revenue around 3.2B
- Favorable dividend yield at 2.27%
- Debt to assets favorable at 9.27%
State Street Corporation Weaknesses
- ROIC below WACC: 2.72% vs. 16.54%
- Unfavorable current ratio at 3.59 indicating possible liquidity concerns
- High debt to equity of 1.07
- Low interest coverage at 0.43
- Asset turnover very low at 0.06
- Neutral ROE at 10.58%
Northern Trust Corporation Weaknesses
- Unfavorable current and quick ratios at 0.41 indicate liquidity risk
- Debt to equity higher at 1.27
- Interest coverage low at 0.38
- Asset turnover low at 0.08
- P/B ratio less favorable at 1.98
- WACC high at 16.75%
Both companies show solid profitability metrics and dividend yields supporting shareholder returns. However, liquidity and capital efficiency ratios reveal operational weaknesses. State Street’s broader geographic diversification contrasts with Northern Trust’s concentrated wealth management focus, influencing their strategic priorities.
The Moat Duel: Analyzing Competitive Defensibility
A structural moat is the only reliable shield protecting long-term profits from relentless competition erosion:
State Street Corporation: Intangible Assets and Scale Moat
State Street leverages deep institutional relationships and brand reputation, reflected in stable margins near 18% EBIT. Yet, declining ROIC signals growing pressure. Expansion in ESG and data analytics may deepen its moat if executed well in 2026.
Northern Trust Corporation: Client Relationship and Wealth Management Moat
Northern Trust’s moat centers on wealth management trust and personalized services, contrasting State Street’s scale. Despite lower margins around 16%, it sustains premium client loyalty. However, weakening profitability and ROIC trends pose risks; growth in private markets offers upside.
Verdict: Institutional Scale vs. High-Touch Client Focus
Both firms show shrinking ROIC below WACC, destroying value amid rising costs. State Street’s broader product scale offers a wider moat, but Northern Trust’s focused client relationships create deeper loyalty. State Street is better positioned to defend market share through diversification and innovation.
Which stock offers better returns?
Over the past year, both stocks exhibited strong bullish momentum with accelerating price gains. Northern Trust shows higher volatility and sharper recent gains, while State Street’s trend remains steadily upward.
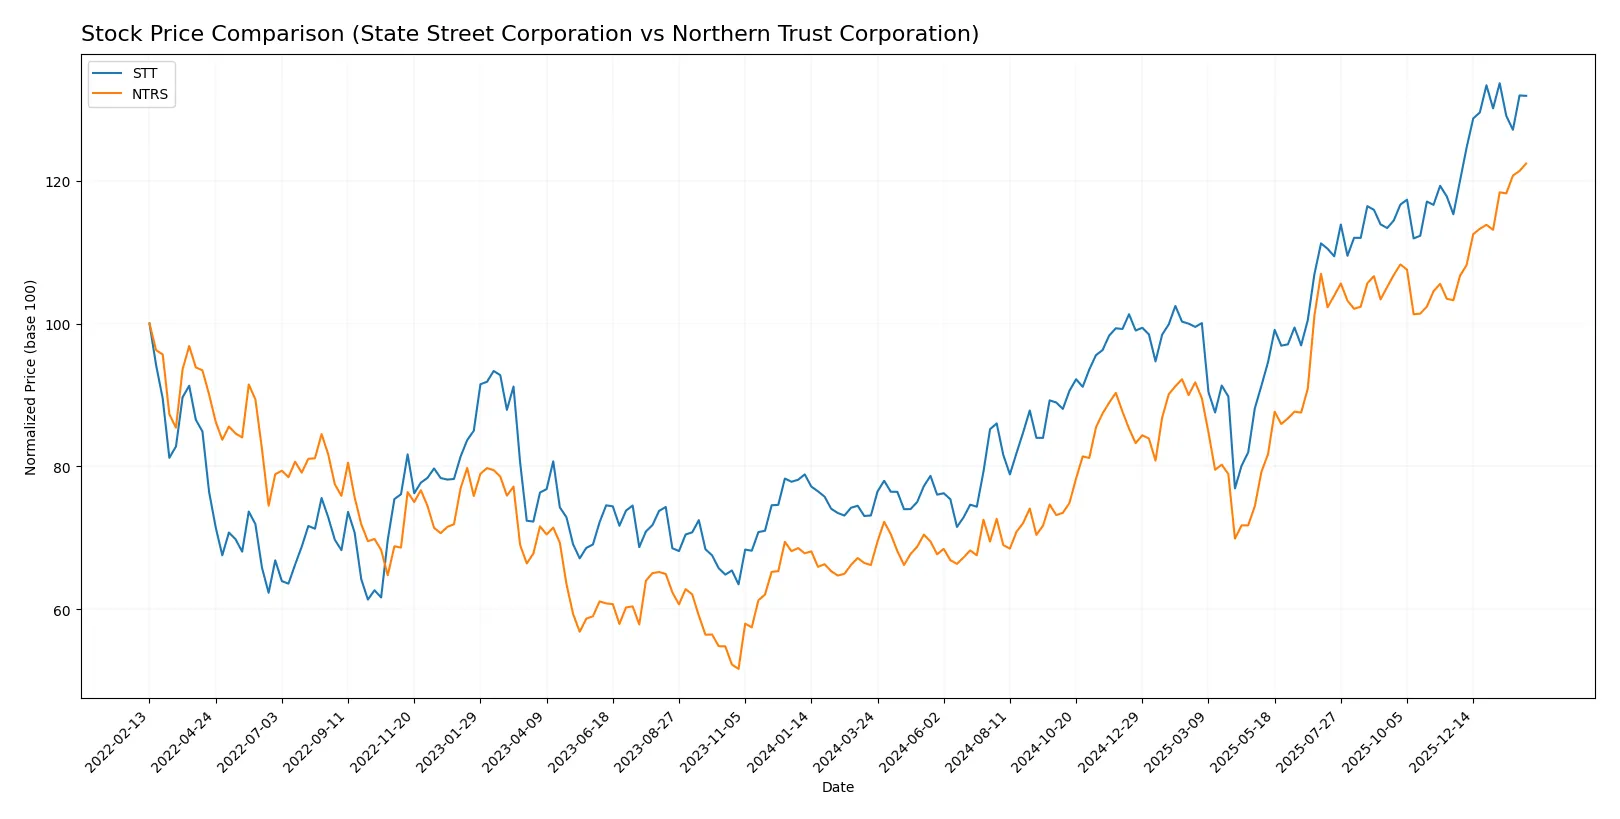
Trend Comparison
State Street Corporation’s stock rose 80.43% over the past year, marking a bullish trend with accelerating momentum and a moderate volatility of 17.04. It reached a high of 132.57 and a low of 70.91.
Northern Trust Corporation’s stock advanced 85.01% in the same period, also bullish with acceleration. It experienced higher volatility at 20.02 and wider price swings between 81.45 and 150.71.
Northern Trust outperformed State Street with a higher overall return and greater recent price acceleration, delivering the strongest market performance in this comparison.
Target Prices
Analysts present a clear consensus on target prices for State Street Corporation and Northern Trust Corporation.
| Company | Target Low | Target High | Consensus |
|---|---|---|---|
| State Street Corporation | 128 | 164 | 142.17 |
| Northern Trust Corporation | 131 | 160 | 146.17 |
The target consensus prices for both companies exceed current stock prices, signaling moderate upside potential in the asset management sector. This reflects analysts’ confidence in their growth prospects despite market volatility.

Don’t Let Luck Decide Your Entry Point
Optimize your entry points with our advanced ProRealTime indicators. You’ll get efficient buy signals with precise price targets for maximum performance. Start outperforming now!
How do institutions grade them?
State Street Corporation Grades
The following table shows recent grades assigned to State Street Corporation by leading institutions.
| Grading Company | Action | New Grade | Date |
|---|---|---|---|
| Morgan Stanley | maintain | Overweight | 2026-01-20 |
| TD Cowen | maintain | Buy | 2026-01-07 |
| Truist Securities | downgrade | Hold | 2026-01-07 |
| Barclays | downgrade | Equal Weight | 2026-01-05 |
| Citigroup | maintain | Buy | 2025-12-30 |
| Citigroup | maintain | Buy | 2025-10-24 |
| Truist Securities | maintain | Buy | 2025-10-20 |
| Morgan Stanley | maintain | Overweight | 2025-10-20 |
| Wells Fargo | maintain | Overweight | 2025-10-20 |
| Keefe, Bruyette & Woods | maintain | Outperform | 2025-10-20 |
Northern Trust Corporation Grades
This table summarizes recent institutional grades for Northern Trust Corporation.
| Grading Company | Action | New Grade | Date |
|---|---|---|---|
| Citigroup | maintain | Neutral | 2026-01-28 |
| Goldman Sachs | maintain | Sell | 2026-01-28 |
| TD Cowen | maintain | Buy | 2026-01-26 |
| RBC Capital | maintain | Outperform | 2026-01-23 |
| Morgan Stanley | maintain | Underweight | 2026-01-23 |
| Evercore ISI Group | maintain | In Line | 2026-01-23 |
| Wells Fargo | maintain | Equal Weight | 2026-01-23 |
| TD Cowen | maintain | Buy | 2026-01-07 |
| Barclays | maintain | Equal Weight | 2026-01-05 |
| Citigroup | maintain | Neutral | 2025-12-30 |
Which company has the best grades?
State Street Corporation generally receives stronger grades, including multiple Buy and Overweight ratings, compared to Northern Trust’s mix of Neutral and Equal Weight grades. Investors may interpret State Street’s ratings as reflecting greater confidence in its near-term performance.
Risks specific to each company
The following categories identify the critical pressure points and systemic threats facing both firms in the 2026 market environment:
1. Market & Competition
State Street Corporation
- Faces pressure from fintech disruptors and fee compression in asset management.
Northern Trust Corporation
- Competes in wealth management with growing demand for personalized solutions but faces margin pressure.
2. Capital Structure & Debt
State Street Corporation
- Debt-to-equity ratio at 1.07 signals moderate leverage with unfavorable interest coverage (0.43).
Northern Trust Corporation
- Higher leverage at 1.27 and weaker interest coverage (0.38) increase financial risk.
3. Stock Volatility
State Street Corporation
- Beta of 1.44 shows higher sensitivity to market swings, raising volatility risk.
Northern Trust Corporation
- Lower beta at 1.28 suggests more stable stock price behavior relative to the market.
4. Regulatory & Legal
State Street Corporation
- Large global footprint exposes it to stringent regulatory scrutiny across multiple jurisdictions.
Northern Trust Corporation
- Operating in wealth management adds complexity with evolving fiduciary and compliance requirements.
5. Supply Chain & Operations
State Street Corporation
- Operational risks from reliance on technology platforms and data security threats.
Northern Trust Corporation
- Similar operational dependencies but with more focus on private banking systems integration risks.
6. ESG & Climate Transition
State Street Corporation
- Strong ESG product offerings but faces transition risk as investors demand net-zero alignment.
Northern Trust Corporation
- Emphasizes sustainable investing; however, regulatory ESG reporting requirements add compliance costs.
7. Geopolitical Exposure
State Street Corporation
- Global custody and trading services expose it to geopolitical tensions affecting cross-border flows.
Northern Trust Corporation
- Geographically concentrated in North America, somewhat insulating from broader geopolitical shocks.
Which company shows a better risk-adjusted profile?
State Street’s biggest risk lies in its higher market volatility and operational complexity across global markets. Northern Trust’s primary concern is its elevated leverage combined with weaker interest coverage. Despite these risks, Northern Trust’s stronger Piotroski score (7 vs. 4) and slightly lower beta suggest a better risk-adjusted profile. The data shows Northern Trust’s disciplined financial strength contrasts with State Street’s distressed Altman Z-score, underscoring my cautious preference for Northern Trust in 2026.
Final Verdict: Which stock to choose?
State Street Corporation’s superpower lies in its resilient income generation and favorable margin profile. However, its declining return on invested capital signals a value destruction trend, warranting close monitoring. It suits portfolios aiming for steady income with moderate risk tolerance.
Northern Trust Corporation boasts a strategic moat through superior asset turnover and strong return on equity, reflecting operational efficiency. Despite a less favorable income growth trajectory, it offers relatively better financial strength and stability than State Street. Fits well in balanced portfolios seeking moderate growth with defensive characteristics.
If you prioritize consistent income and dividend yield, State Street appears compelling given its margin stability. However, if you seek operational efficiency and stronger capital returns, Northern Trust offers better stability and a strategic edge. Both carry risks from declining ROIC, so risk-aware investors should weigh their tolerance carefully.
Disclaimer: Investment carries a risk of loss of initial capital. The past performance is not a reliable indicator of future results. Be sure to understand risks before making an investment decision.
Go Further
I encourage you to read the complete analyses of State Street Corporation and Northern Trust Corporation to enhance your investment decisions: